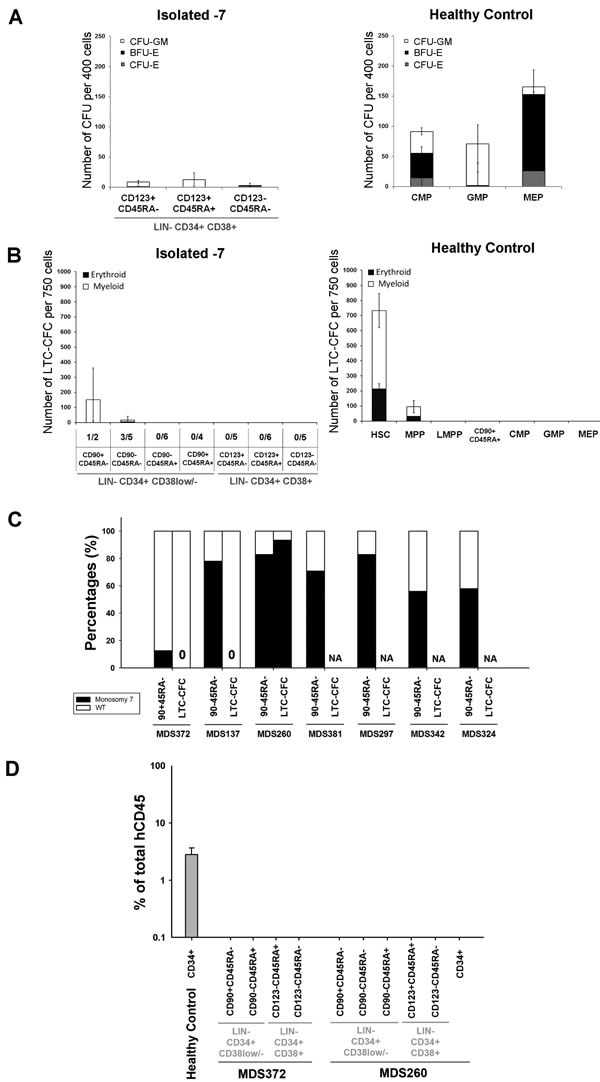
Figure 3. Functional assessment of stem and progenitor cells in isolated monosomy 7 MDS.

A. Mean (SEM) colony forming activity from indicated stem/progenitor cell populations from isolated −7 patients (n = 7) and HC (n = 6). Mean (SEM) burst forming unit-erythroid (BFU-E), CFU-erythroid (CFU-E) and CFU-granulocyte/monocyte (CFU-GM) based on colony morphology. B. Mean (SEM) LTC-CFC activity of indicated cell populations from isolated −7 (n = 6) and HC (n = 5). For isolated −7 MDS, the frequency of patients with readout is indicated below the x-axis for each population. C. Percentages of sorted stem cells and LTC-CFCs derived from LIN−CD34+CD38−CD90+CD45RA− or LIN−CD34+CD38low/−CD90−CD45RA− cells with (black) and without (white) −7 karyotype as detected by FISH. 10, 8 and 16 LTC-CFC colonies were picked and analysed for MDS372 MDS137 and MDS260, respectively. NA = Not applicable as no LTC-CFC readout D. Mean (SEM) human CD45+ engraftment in NSG mice 5 months after transplantation of CD34-enriched cells (CD34+) from one HC and indicated populations from 2 isolated −7 patients. Three NSG mice were used per sorted population.
