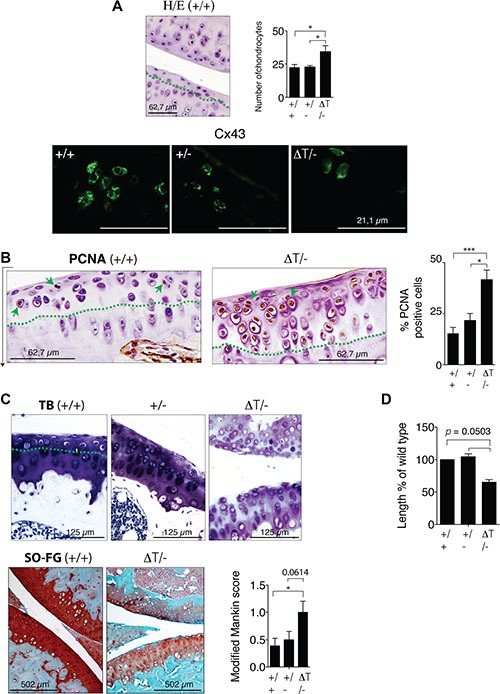
Figure 3. CTD-deficient mice have changes in the ECM composition of cartilage.

(A) Cartilage staining with HE of wild-type (+/+), (+/−) and CTD-deficient mice (ΔT/−) showed a significant increase in the number of chondrocytes in the cartilage of CTD-mutant mice (eight month old mice). The increase in cellularity was studied in the noncalcified cartilage interface above the tidemark (green dashed line). A representative image is shown. Mean ± S.E.M. (n = 21 for +/+, n = 10 for +/− and for ΔT/−). Below, cellular localization of Cx43 and CTD-truncated Cx43 in cartilage was studied by immunofluorescence. (B) IHC analysis using an anti-PCNA antibody. Mean ± S.E.M. (n = 24 for +/+, n = 10 for +/− and n = 17 for ΔT/−). (C) Safranin-O fast green, toluidine blue staining of knee joints and modified Mankin score [77, 78] (below n = 9), eight month old mice. CTD-deficient mice showed reduced staining in the femoral condyles and tibial plateaus. The increase in cellularity was also observed in the cartilage area above the tidemark. (D) Diagram showing the relative length of long bones (tibia and femur) of newborn CTD-deficient mice compared to the wild type. Mice pups on day of birth were used to perform these studies. Mean ± S.E.M. (n = 5) *p < 0.05; **p < 0.01; ***p < 0.001, Mann-Whitney test.
