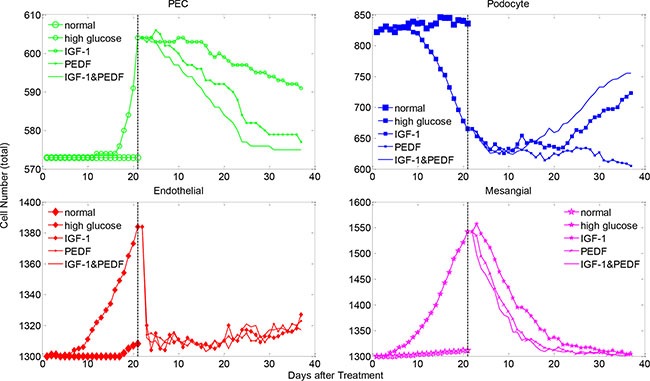
Figure 5. The changes in the total cell numbers under single and dual cytokine treatments.

Shown are total cell numbers of each glomerular cell type under denoted treatments after high-glucose induced injury. The cell number dynamics under normal and high glucose conditions are plotted for comparison. See Supplementary Figure S12 for the changes in the healthy cell numbers under various cytokine treatments.
