
Figure 7. In vitro transport ratios (%) of various NPs.
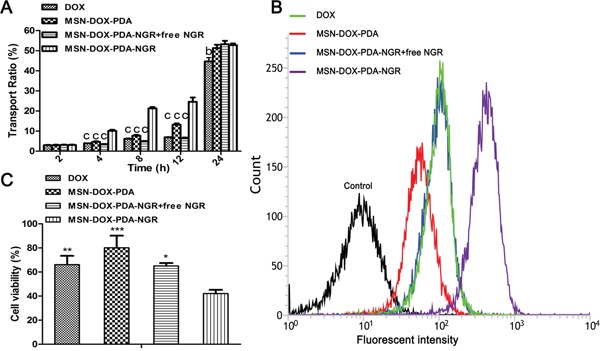
A. Transport ratio across BCEC-C6 monolayer of different DOX formulations during 24 hours. B. Flow cytometric analysis and C. viability of C6 cells (below) after treatment with different DOX formulations; bp < 0.01, cp < 0.001, *p < 0.05, **p < 0.01, and ***p < 0.001 compared with MSN-DOX-PDA-NGR (n = 3).