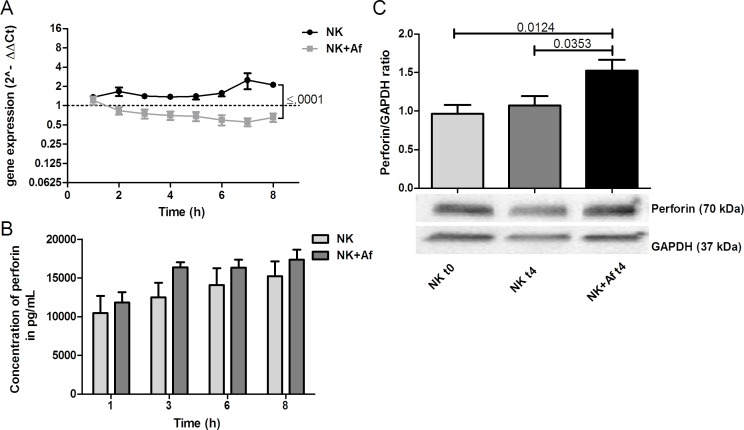
Figure 3. Gene expression and intra- and extracellular protein levels of perforin.
A. Gene expression of perforin (PRF1) in interleukin (IL)-2 pre-stimulated human NK cells co-incubated with A. fumigatus hyphae (grey squares, NK+Af) or incubated alone (black dots, NK). The X axis represents the time (hours); first assessment of transcript levels was performed at hour 1. The Y axis represents the relative fold-change of perforin at specific time points to perforin at time point 0 (dotted line; < 1 down-regulation, > 1 up-regulation). Squares and dots represent means, bars the standard error of means (n = 5). The P value represents the difference at time point 8 hours.B. Concentration of perforin in the supernatant of NK cells incubated for up to 8 hours with A. fumigatus hyphae (dark-grey columns on the right, NK+Af)) or without the fungus (light-grey columns on the left, NK). The boxes represent means, the whiskers standard error (n = 5). C. Bottom: Western blot analysis of intracellular perforin and GAPDH in NK cells incubated with A. fumigatus hyphae (NK + Af t4) or without the fungus (NK t4) for 4 hours and of the control at time point 0 (NK t0). Shown is one representative experiment out of a total of five independent experiments. Top: Calculated ratios of perforin to GAPDH in NK cells at 0 hours (light-grey column on the left), NK cells incubated alone for 4 hours (dark-grey column in the center) and NK cells incubated with A. fumigatus hyphae for 4 hours (black column on the right). The boxes represent means, the whiskers standard error (n = 5).

