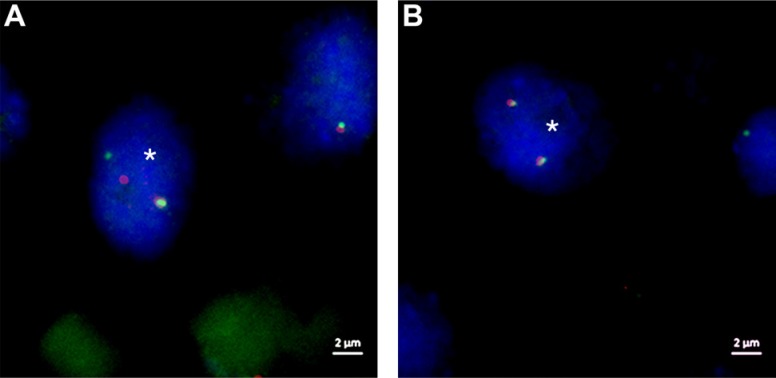
Figure 1. FISH images of ZytoLight SPECTM FGFR3 Dual Color Break Apart Probe sample ID 51.
(A) Tumor cell nucleus (*) with a classical break apart event of chromosome region 4p16.3 displaying one single orange (proximal to FGFR3) and one single green (distal to FGFR3) signal as well as one fusion (adjacent orange-green) signal. (B) Tumor cell with normal chromosome region 4p16.3 showing two fusion signals (adjacent orange-green signals) per nucleus. DAPI counterstain, original magnification 1000-fold, white scale bar equals 2 μm.

