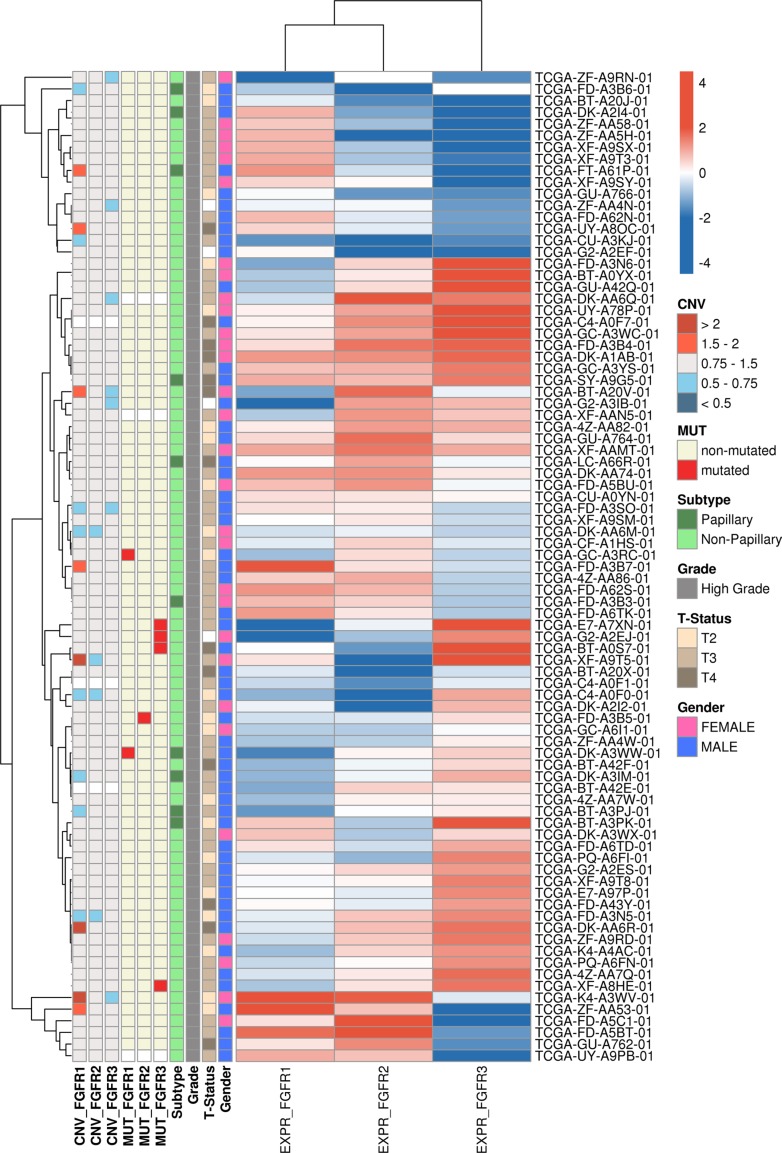
Figure 4. Heatmap showing the FGFR1, FGFR2 and FGFR3 mRNA expression in the 85 “squamous-like” bladder cancer samples identified by hierarchical cluster analysis of the entire TCGA cohort.
Samples are annotated with gender, stage, grade, histological subtype as well as mutational status and CNVs for FGFR1-3.

