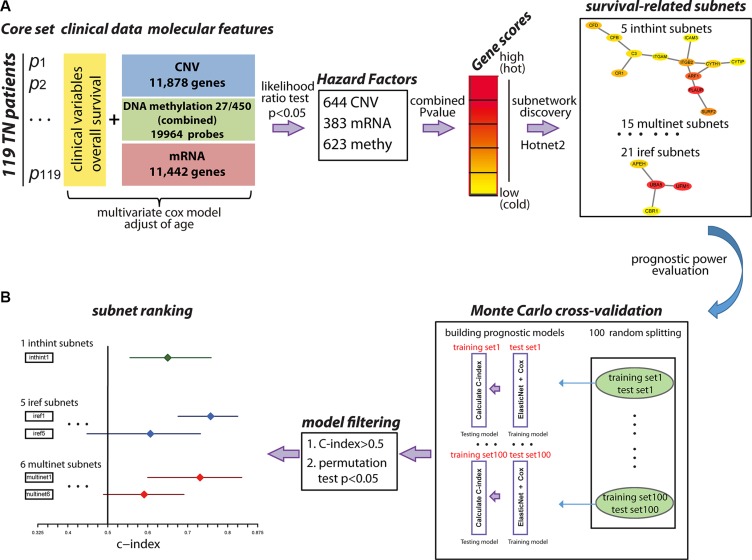
Figure 1. An overview of the methodology.
(A). Identification of survival-related subnetwork biomarkers. First, molecular features (CNV, mRNA, DNA methylation) and clinical variables from 119 TNBC patients were collected as the core set. Next, multivariate cox model was used to select hazard factors (644 CNV, 383 mRNA, 623 DNA methylation) filtered by likelihood ratio test p-value < 0.05, which represented the significance of each molecular feature correlated with patient overall survival adjusted for age. Furthermore, the heat score for each gene was calculated as the negative sum of the natural logarithm of the single molecular feature p-values (Red: high score; Yellow: low score) to evaluate the collaborative effect of different molecular features on patient overall survival. Subnetworks were identified using HotNet2 algorithm in three PPI networks using a heat diffusion process and a statistical test based on both the score of the genes and the local topology of the subnetwork. (B). Evaluation of the multi-dimensional subnetwork-derived prognostic models. Monte Carlo cross-validation and C-index were applied to assess the predictive power of each subnetwork signature. During each of the 100 times of random splitting, 80% of the total samples were used to train the model and the remaining of 20% were used as the test set for C-index calculation. C-index > 0.5 and permutation test p < 0.05 were applied as the filtering criteria. C-index for each subnetwork was plotted with the median in the center and the whiskers marking the 25% and 75% percentile. The vertical black line marked the C-index equivalent to a random guess (C-index = 0.5).

