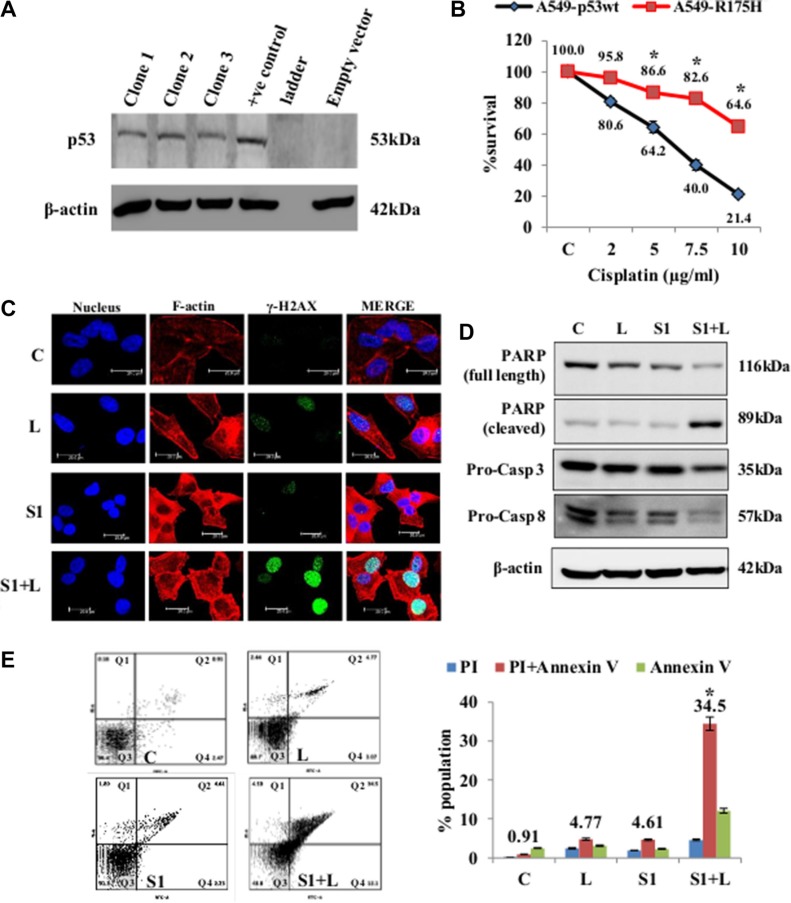
Figure 7. Cell death and DNA damage in response to treatment in A549/p53 dominant-negative cells.
(A) Confirmation of stable clones was done by western blot analysis using p53 specific antibody. (B) MTT assay for cisplatin shows that the mutant cell line is resistant to the drug as compared p54-wt A549 cells. (C) Confocal images of A549/p53 dominant negative cells shows an elevated level of DNA damage in combination than single agent treatment. Increased accumulation of γ-H2AX indicates DNA damage. Nucleus= Blue (DAPI), F-actin= Red (TRITC), γ-H2AX= Green (FITC). (D) Western blot analysis shows a caspase mediated cell death in A549/p53 mut cells in response to treatment. (E) AnnexinV-PI dual staining and flow cytometry analysis shows significantly higher apoptosis in combination treatment than low dose cisplatin and scriptaid. Q1=necrotic population, Q2=late phase apoptosis, Q3=live cells, Q4= early phase apoptosis. C= control, L=2μg/ml cisplatin, S1= 1μg/ml scriptaid. * indicates p < 0.05.

