Abstract
Proteorhodopsin (PR) and Gloeobacter rhodopsin (GR) are retinal-based light-driven proton pumps that absorb visible light (maxima at 520–540 nm). Shifting the action spectra of these proton pumps beyond 700 nm would generate new prospects in optogenetics, membrane sensor technology, and complementation of oxygenic phototrophy. We therefore investigated the effect of red-shifting analogues of retinal, combined with red-shifting mutations, on the spectral properties and pump activity of the resulting pigments. We investigated a variety of analogues, including many novel ones. One of the novel analogues we tested, 3-methylamino-16-nor-1,2,3,4-didehydroretinal (MMAR), produced exciting results. This analogue red-shifted all of the rhodopsin variants tested, accompanied by a strong broadening of the absorbance band, tailing out to 850–950 nm. In particular, MMAR showed a strong synergistic effect with the PR-D212N,F234S double mutant, inducing an astonishing 200 nm red shift in the absorbance maximum. To our knowledge, this is by far the largest red shift reported for any retinal protein. Very importantly, all MMAR-containing holoproteins are the first rhodopsins retaining significant pump activity under near-infrared illumination (730 nm light-emitting diode). Such MMAR-based rhodopsin variants present very promising opportunities for further synthetic biology modification and for a variety of biotechnological and biophysical applications.
Introduction
Microbial (or type-I) rhodopsins are a family of heptahelical light-activable membrane proteins found in a broad phylogenetic range of microbial life.1 They facilitate various light-driven functions in their hosts via the active transport of ions (e.g., proton, sodium, potassium, or chloride pumps)2 or sensory signaling mechanisms (e.g., sensory rhodopsins, channelrhodopsins).3 The archaeal proton pump bacteriorhodopsin (BR) was the first member of this family to be discovered and has been well-characterized by various crystallographic and spectroscopic techniques over the past four decades.4,5
Proteorhodopsins are another archetype of the proton-pumping rhodopsins that have elicited considerable interest recently.6 The green-light-absorbing proteorhodopsin (PR) (λmax = 520 nm) was initially discovered in 2000 in Monterey Bay during a metagenomic screen of marine uncultured γ-proteobacteria.7 Many variants of PR have since been found ubiquitously distributed among various strata of life, including numerous bacteria, archaea, and eukaryotes.8−11 Gloeobacter rhodopsin (GR) (λmax = 540 nm) is a far relative of PR that was discovered in the cyanobacterium Gloeobacter violaceus PCC 7421.12 GR is also a light-driven proton pump and shares ∼30% sequence identity with PR, while conserving several key residues involved in its proton pumping function.5
PR and GR contain the typical seven transmembrane α-helical protein motif (opsin), which binds a molecule of all-trans retinal (A1) via a covalent Schiff base (SB) linkage with a buried lysine residue. Upon photoexcitation, retinal isomerizes from the all-trans to the 13-cis configuration, eliciting specific structural changes in the protein. A proton is transferred from the protonated SB to a nearby Asp (the counterion; D97 in PR, D121 in GR) and is ultimately released at the extracellular surface. Another proton is picked up from the cytoplasm to reprotonate the SB and the retinal undergoes thermal reisomerization back to the ground state. As a net effect, a proton is pumped across the cell membrane per photon absorbed, thereby generating a proton gradient.13
This light-driven proton motive force can be coupled to ATP synthesis, which is used to drive the growth and survival of PR-expressing host organisms under energy-limiting conditions.14,15 Both PR and GR also express readily in non-native hosts such as Escherichia coli,7,16 in contrast to BR.17 PR has further been shown to be able to contribute to physiological processes in E. coli such as chemotaxis18 and the heterologous generation of bioproducts such as biohydrogen.19 These features make PR and GR attractive model systems for a variety of synthetic biology applications. For instance, when expressed in the cyanobacterium Synechocystis sp. PCC 6803, PR was observed to stimulate growth upon illumination compared with a nonfunctional PR mutant.20
A great challenge in many of these applications has been to extend the action spectrum into the far-red and near-infrared (NIR) range of the electromagnetic spectrum (≥700 nm), which is relatively unexplored. It has been suggested that PRs can complement oxophototrophy further when their spectral band is shifted bathochromically to utilize photons outside the range of photosynthetically active radiation (PAR; 400–700 nm),21,22 which is hardly exploited by oxygenic photosynthesis.23,24 Red-light activation is also highly desired in the field of optogenetics, where microbial rhodopsins like channelrhodopsins are used to modulate the activity of neurons or other mammalian cells by light.25,26 Light of wavelength ≥700 nm penetrates much further into biological tissue, which for instance would be very useful for the optogenetic stimulation of deeper brain regions.
One of the primary approaches to shift the action spectrum of microbial rhodopsins has been to modify the protein (opsin) environment. Several red-shifted mutants of PR and GR have been constructed using random mutagenesis screens27 or targeted mutagenesis of specific binding pocket residues.28 However, most mutants are strongly functionally impaired, which presents a major drawback. Nonetheless, a few red-shifted mutants have been identified that retain 30–50% of the pumping activity of the wild-type protein, such as the single mutant PR-T101A (PR-TA) (λmax = 536 nm) and the double mutant PR-D212N,F234S (PR-DNFS) (λmax = 540 nm).27,29
Chromophore substitution is another verified strategy to shift the absorption spectrum of these proteins. We have previously demonstrated red and blue shifts in the absorbance bands of PR, GR, and PR-DNFS using analogues of A1 with different ring modifications.29 Of these, the analogue all-trans-3,4-dehydroretinal (A2) induced a significant red shift (26–32 nm) in all pigments while largely retaining the pump activity.29 A2 is the only other naturally occurring retinal, and it has been found in the photoreceptor cells of certain fish, invertebrates, and amphibians.30−32 It was also shown to cause a red shift in the absorbance bands of archaeal rhodopsins with a minimal effect on activity.33,34 The additional conjugation in A2 between C3 and C4 (Figure 1b) decreases the energy gap for the π–π* transition, causing the spectral shift to longer wavelengths (Tables 1 and S1 and Figure S1).
Figure 1.
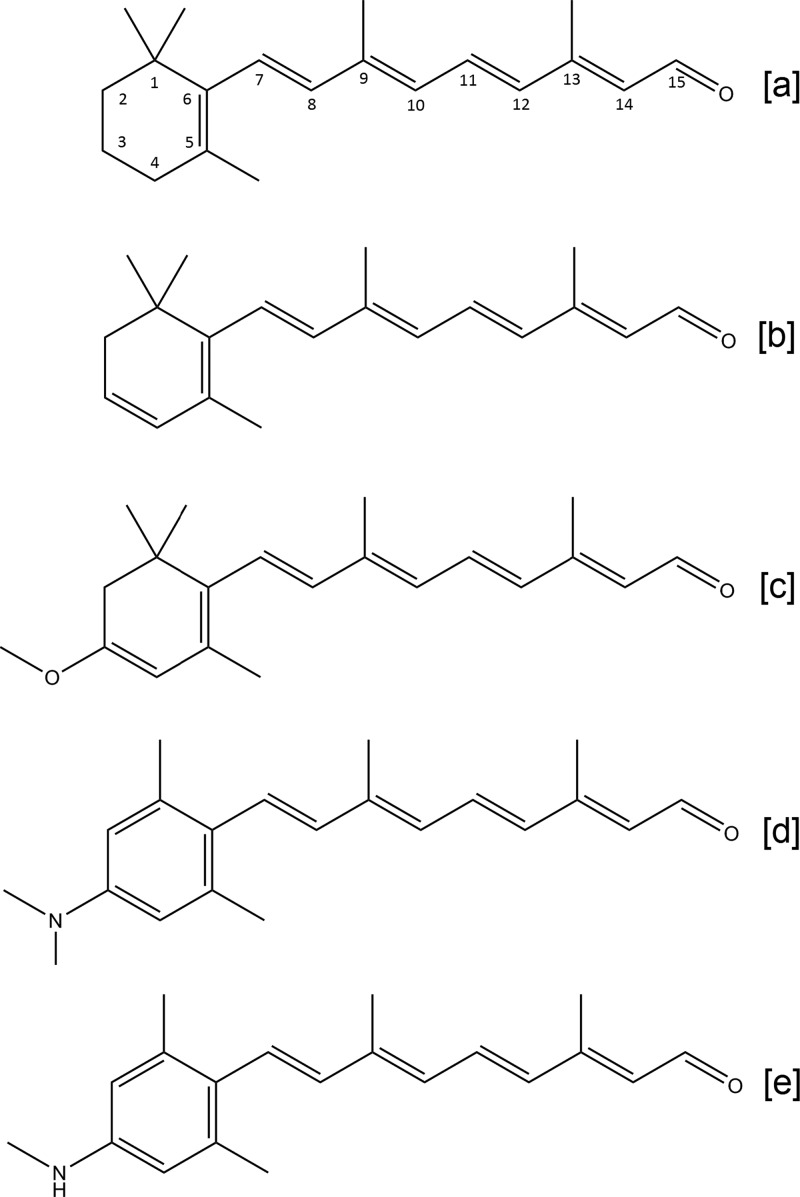
Chemical structures of retinal analogues used in this study: [a] A1; [b] A2; [c] MOA2; [d] DMAR; [e] MMAR. For spectral properties, see Figure S1 and Table S1.
Table 1. Absorbance Maximum (λmax) Values and Proton Pumping Scores of the Analogue Pigments Generated in This Study.
| H+ c |
||||||
|---|---|---|---|---|---|---|
| opsin | retinal analogue | λmax (nm)a | white | 617 nm | 660 nm | 730 nm |
| A1 | 520 | +++ | + | – | – | |
| PR | A2 | 552 | +++ | +++ | + | – |
| MOA2 | 585 | ++ | – | nd | nd | |
| DMAR | 558 | – | + | nd | nd | |
| MMAR | 567 | – | + | + | ++ | |
| A1 | 540 | ++ | nd | – | – | |
| PR-DNFS | A2 | 566 | + | nd | – | + |
| MMAR | ∼740 | – | nd | – | ++ | |
| A1 | 536 | + | nd | + | – | |
| PR-TA | A2 | 563 | + | nd | + | + |
| MMAR | 561b | – | nd | + | ++ | |
| A1 | 540 | ++++ | +++ | ++ | – | |
| A2 | 566 | ++++ | ++++ | ++++ | + | |
| GR | MOA2 | 620 | ++ | – | nd | nd |
| DMAR | 538b | + | + | nd | nd | |
| MMAR | 570 | + | + | ++ | ++ | |
| A1 | 549 | ++++ | ++++ | +++ | – | |
| A2 | 571 | +++ | nd | ++++ | ++ | |
| GR-FS | MOA2 | 630 | ++ | – | – | – |
| MMAR | 571b | + | + | ++ | ++++ | |
λmax of purified protein.
λmax from hydroxylamine difference spectrum in vesicles.
Proton pumping activity normalized within each light condition to the highest pumping rate measured under that condition: ++++, 100–70%; +++, 70–40%; ++, 40–20%; +, 20–5%; −, <5% (see Selected Materials and Methods for relative rates between sets and further explanation). nd = not determined.
In this report, we specifically focus on red-shifting retinal analogues. We elaborated the conjugation of A2 by adding different electron-withdrawing substituents at C3 in the β-ionone ring and/or at C13 or C14 in the polyene chain. Analogues modified at C13 or C14, however, showed poor reactivity or low stability of the resulting holoprotein (Ganapathy and de Grip, unpublished). Here we report on the ring-modified analogues all-trans-3-methoxy-3,4-dehydroretinal (MOA2), all-trans-3-dimethylamino-16-nor-1,2,3,4-didehydroretinal (DMAR), and all-trans-3-methylamino-16-nor-1,2,3,4-didehydroretinal (MMAR) (Figure 1). Promising analogues were combined with red-shifted mutants (Figure 2). While all of the analogues tested yielded red-shifted pigments, MMAR was finally identified as the most promising analogue from our study, inducing bathochromic shifts of up to an astonishing 200 nm while retaining activity in NIR light. MMAR pigments have broad potential for a variety of biotechnological, optogenetic, and oxyphototrophic applications.
Figure 2.
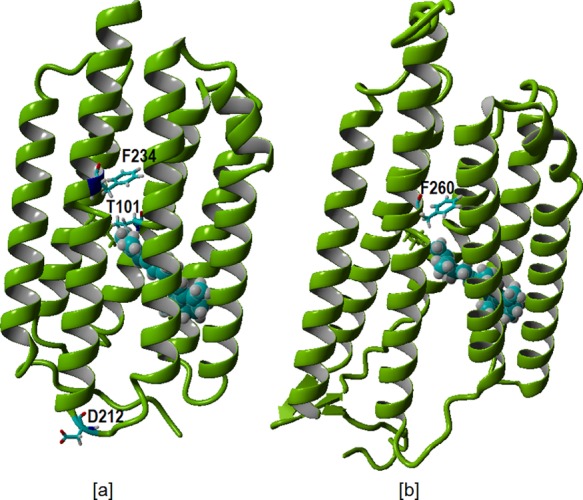
[a] Homology model of PR selectively displaying in cyan the mutation sites F234 and T101 near the retinal binding pockets and D212 in the loop region. [b] Homology model for GR selectively displaying in cyan the mutation site F260 in the retinal binding pocket. Retinal is represented in cyan as a space-filling residue.
Results and Discussion
Characterization of the Proton Pumps
In view of the red-shifting potential of the F234S mutation in PR,27 we engineered the equivalent mutation in GR (F260S; Figure 2). In contrast to PR, the mutant GR-F260S (GR-FS) showed only a 9 nm red shift, but also, in contrast to PR, high expression levels (ca. 105 molecules/cell) and pump activity (Table 1) were observed. The mutants PR-DNFS, PR-TA, and GR-FS (Figure 2) were constructed using mismatch PCR, as described in the Supporting Information (SI). PR, GR, and their mutants were recombinantly expressed in E. coli strain UT5600 under control of the lac promoter. Opsin expression was induced by addition of IPTG to the cell culture. All of the opsins could be fully regenerated with A1 and A2 upon addition of retinal either to the culture or to isolated membrane vesicles.29 Good regeneration rates were also observed with MOA2 and MMAR, but complete regeneration with DMAR was difficult to achieve. The presence of a C-terminal His6 tag allowed extensive purification of the pigments after solubilization with the detergent n-dodecyl-β-d-maltoside (DDM). The absorbance maxima of pigments that were not very stable in DDM were estimated by measuring the pigment absorbance in intact membrane vesicles (see Selected Materials and Methods). To test their proton pumping activity under red and near-infrared illumination, the pigments were assayed in intact starved cells under white light (800 μE·m–2·s–1), 617 nm light-emitting diode (LED) (1500 μE·m–2·s–1), 660 nm LED (800 μE·m–2·s–1), and 730 nm LED (150 μE·m–2·s–1) illumination.
In all of the pigment variants tested in the current study, A1 and A2 corroborated the results reported before with PR, GR, and PR-DNFS (Table 1). A2 caused a 22–32 nm red shift in the absorbance bands and retained strong proton pumping activity upon white light illumination (50–100% of A1), except for PR-DNFS (23%). However, under 730 nm illumination, very low but measurable activity was observed only for the A2 pigments of GR and GR-FS (Figures 5e and 6e and Table 1). This was expected, considering the width of the emission band of the 730 nm LED and the absorbance bands of the pigments.
Figure 5.
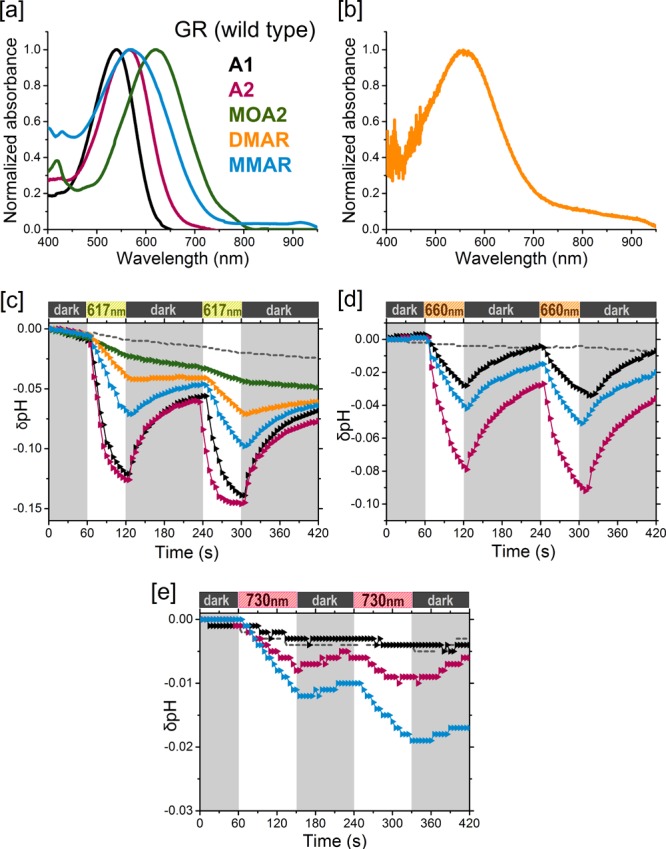
Analogue pigments of GR. [a] Normalized absorbance spectra of His-tag-purified pigments in DDM containing A1 (black), A2 (pink), MOA2 (green). or MMAR (blue). [b] Hydroxylamine difference spectrum of the DMAR pigment (orange) in membrane vesicles. [c–e] Proton pumping activities of the pigments (same colors as in [a]) in starved E. coli UT5600 cells upon illumination with [c] 617 nm, [d] 660 nm, and [e] 730 nm LEDs. Controls are the same as in Figure 3.
Figure 6.
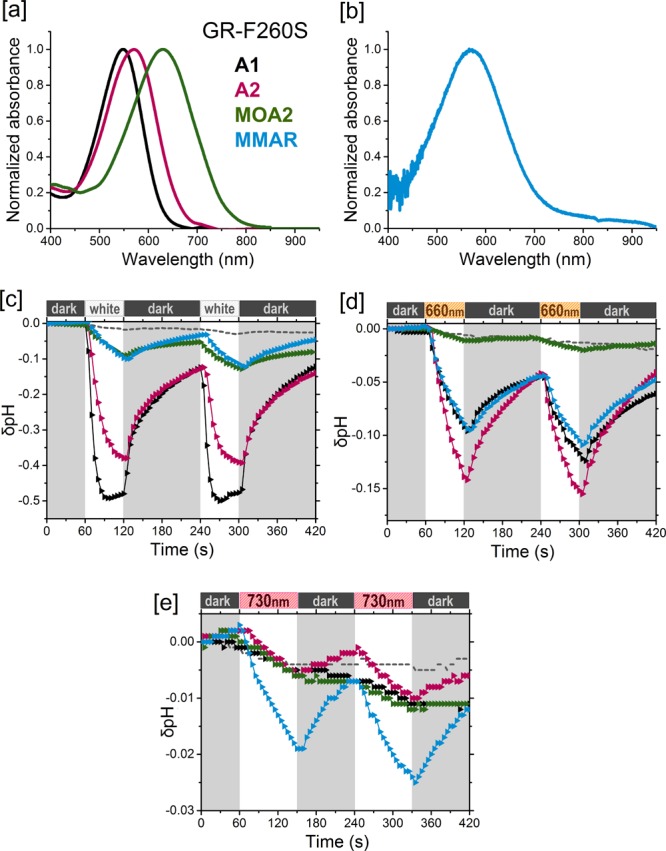
Analogue pigments of GR-F260S. [a] Normalized absorbance spectra of His-tag-purified pigments in DDM containing A1 (black), A2 (pink), and MOA2 (green). [b] Hydroxylamine difference spectrum of the MMAR pigment (blue) in membrane vesicles. [c–e] Proton pumping activities of the pigments (same colors as in [a]) in starved E. coli UT5600 cells upon illumination with [c] white light, [d] a 660 nm LED, and [e] a 730 nm LED, Controls are the same as in Figure 3.
While searching for further red-shifting analogues, we noticed two A2 derivatives with electronegative groups at C3: 3-methoxy-A2 (MOA2), which red-shifts visual rhodopsins up to 130 nm with retention of activity,35 and a 3-dimethylaminophenyl derivative, which red-shifted channelrhodopsin2 by 40 nm but slowed down the photocycle.36
Properties of MOA2 and DMAR Pigments
We first tested all-trans MOA2 (Figure 1c), which contains the strong electron-withdrawing methoxy group at C3 on the β-ionone ring. The π system is extensively delocalized over the lone electron pairs on the oxygen atom of MOA2, resulting in a large red shift of ca. 50 nm relative to A1 (λmax = 434 nm for MOA2 in DMF) along with a broadening of the main absorbance band (Table S1 and Figure S1). All of the opsin variants tested reacted smoothly with this analogue. The resulting pigments were quite stable in DDM, allowing extensive purification. MOA2 not only induced very large red shifts in λmax (55–90 nm, depending on the opsin) but also increased the half-width of the spectra. As a result, all the spectra tail out clearly beyond 700 nm up to 800–850 nm (Figures 3a, 4a, 5a, and 6a).
Figure 3.
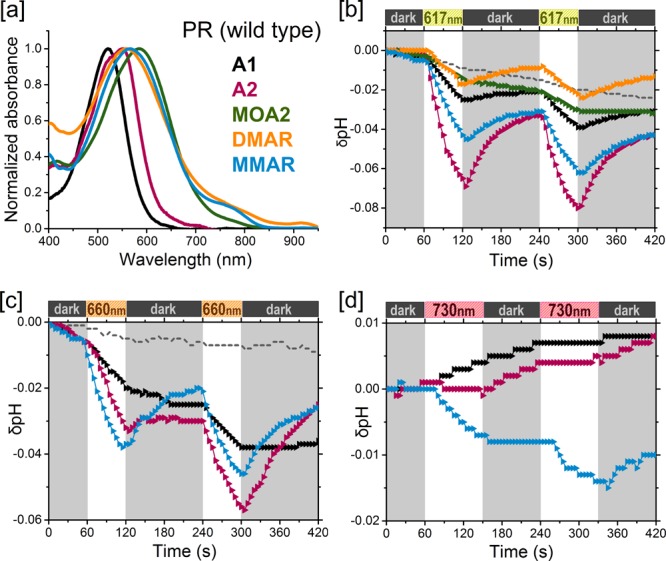
Analogue pigments of PR. [a] Normalized absorbance spectra of purified pigments in DDM containing A1 (black), A2 (pink), MOA2 (green), DMAR (orange), or MMAR (blue). [b–d] Proton pumping activities of the pigments (same colors as in [a]) in starved E. coli UT5600 cells upon illumination with [b] 617 nm, [c] 660 nm, and [d] 730 nm LEDs. Controls without retinal are represented as dotted gray lines.
Figure 4.
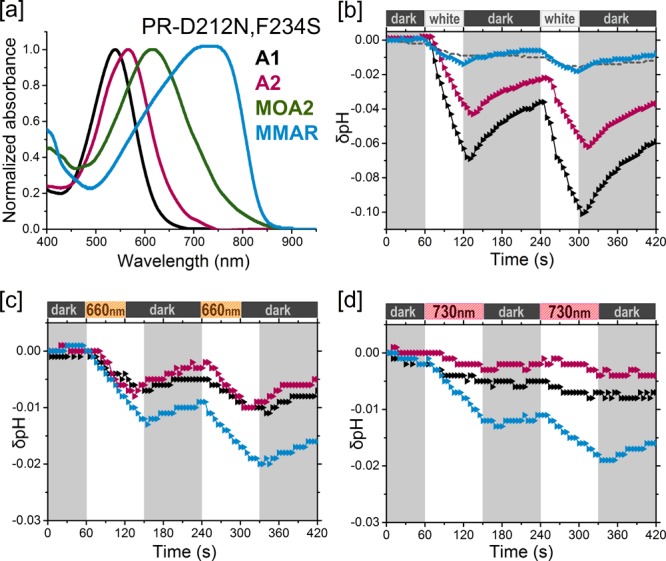
Analogue pigments of PR-D212N,F234S. [a] Normalized absorbance spectra of purified pigments in DDM containing A1 (black), A2 (pink), MOA2 (green), or MMAR (blue). [b–d] Proton pumping activities of the pigments (same colors as in [a]) in starved E. coli UT5600 cells upon illumination with [b] white light, [c] a 660 nm LED, and [d] a 730 nm LED. Controls are the same as in Figure 3.
Under white light illumination, all of the MOA2 pigments tested showed moderate proton pump activity (20–40% of that for the corresponding A1 pigments). We expected this ratio to increase in red light in view of the red-shifted absorbance bands of the MOA2 pigments. However, hardly any pump activity could be detected with 617 nm LED illumination (Table 1 and Figures 3, 5, and 6), despite the high photon flux of the LED source used and its spectral overlap with the central part of the absorbance band of the pigments.
The strong electronegative character of the methoxy substituent apparently affects the photocycle to such an extent that lower-energy excitation >600 nm cannot drive it to completion, thus effectively suppressing the pump mechanism. We are in the process of investigating this perplexing phenomenon in a follow-up study using femtosecond spectroscopy and a computational investigation of the energetic constraints involved in photoisomerization of MOA2 pigments.
Subsequently, we turned to the dimethylaminophenyl derivative. The analogue tested by AzimiHashemi et al.36 has an aromatized ring moiety with a dimethylamino substituent at C3 but lacking methyl groups. We have previously reported that the aromatic phenylretinal, which also lacks methyl groups on the β-ionone ring, did not form a stable pigment with GR.29 Therefore, we decided to position additional methyl groups at C1 and C5 of the dimethylaminophenyl moiety to improve the fit and stability of the retinal analogue inside the binding pocket.37,38 This resulted in a novel derivative, all-trans-3-dimethylamino-16-nor-1,2,3,4-didehydroretinal (DMAR) (Figure 1d). DMAR, however, showed low reactivity with most opsins and very low stability of the resulting pigments in DDM. Of all the pigments tested, only PR:DMAR could be successfully purified (Figure 3a), and it showed a broad red-shifted absorbance band peaking at 558 nm (38 nm red shift relative to A1) and tailing out to at least 850 nm. On the positive side, while the tested DMAR pigments showed relatively low pumping rates under white light illumination (<10% of that for A1; Table 1), this activity persisted with 617 nm illumination (Figures 3b and 5c).
We surmised that the bulky dimethylamino group might sterically hinder the fit and reactivity of DMAR in the retinal binding pocket. Hence, we anticipated that the reactivity of this analogue and the stability of the resulting pigments would improve if the dimethylamino group in DMAR were replaced by a monomethylamino group. This group is not much bulkier than the methoxy group in MOA2, an analogue that yields very stable pigments. This strategy resulted in MMAR (Figure 1e).
Properties of MMAR Pigments
MMAR yielded impressive results. This analogue contains only a single methyl group on the C3 amino substituent, which does not appear to affect the absorbance of the compound in DMF, as DMAR and MMAR display similar complex absorbance bands with λmax ≈ 434 nm and an electronic sideband at 360 nm (Figure S1).
MMAR induced bathochromic shifts in all of the opsins tested: a 47 nm red shift in the λmax of PR and a 23–30 nm red shift in the λmax of PR-TA, GR, and GR-FS (Table 1), accompanied by extensive spectral broadening and tailing up to 850–950 nm (Figures 3a, 4a, 5a, and 6b). Spectacular, however, was the ca. 200 nm red shift (equivalent to 5005 cm–1) relative to A1 in PR-DNFS, which will be discussed in more detail below. Except for GR-FS:MMAR, the obtained MMAR pigments were sufficiently stable in DDM to allow purification. All of the pigments were also spectrally assayed in the membrane-bound state (plasma membrane vesicles isolated from the E. coli cells) using an end-on spectrophotometer (see Selected Materials and Methods and the SI). The latter data were very similar to those obtained with the purified pigments, confirming that detergent solubilization does not measurably affect the spectral properties.
Upon protonation of the counterion (D97; pKa ∼ 6.5), PR-derived pigments exhibited a 20–30 nm red shift in the main absorbance band (Figure S2a). Among all of the PR pigments, only PR:MMAR displayed a complex absorbance band with λmax at 567 nm containing a 770 nm composite band, which tails off to 850 nm (Figure 3a). Surprisingly, the entire band shape of this pigment was very sensitive to protonation (presumably of the counterion D97), since acidification led to a strong enhancement of the lower-energy bands (Figure S2b). While MMAR does not appear to have a significant effect on the pKa of the counterion, the charge distribution and electrostatic interactions in the retinal binding pocket apparently have a strong influence on its spectral properties. The influence of the binding pocket environment was further obvious in the PR-TA mutant, where MMAR also induced a red shift (25 nm), but a much smaller one than in PR (47 nm), as well as a broad absorbance band tailing out to 850 nm but without the wings observed in PR:MMAR (not shown).
We surmise that the exceptional spectral broadening seen in the MMAR pigments may originate from a population of degenerate electronic or vibronic transitions, the absorbance cross-section of which apparently strongly depends on the local charge distribution. This is most strikingly seen in PR-DNFS, where binding of MMAR induced a very large red shift of about 200 nm, creating a complex absorbance band with a broad maximum around 740 nm (Figure 4a). The band shape here is in fact a mirror image of the one for PR:MMAR, since now the lower-energy transitions contribute most strongly to the absorbance band (Figures 3a and 4a). The band shape of PR-DNFS:MMAR also shows some pH dependence, with the hypsochromic shoulder presenting a congruent red shift upon acidification and the 740 band somewhat increasing (not shown). Apparently, the mutation strongly facilitated the change in band shape, and this can still be further enhanced by acidification. To our knowledge, this is the first report of such a large synergistic spectral shift induced by a retinal analogue in an opsin mutant.
The extremely large red shift in PR-DNFS:MMAR in combination with the broad trilobal absorbance band is impressive and unexplained as of yet. However, it is clear that the electronic transitions involved in shaping the PR:MMAR absorbance band are particularly sensitive to the local charge distribution. This is obvious upon counterion protonation as well as in the F234S mutant, both sites situated in or near the binding pocket (Figures 2 and S3). This effect is then expected to be protein-dependent, and in fact the equivalent GR mutant GR-FS:MMAR displays only a moderate 23 nm red shift in λmax with just a long spectral tail extending to 950 nm (Figure 6b). A major difference in the binding site between PR and GR is the presence of a large aromatic Phe residue (F152) near the retinal ring in PR, where GR has only a small Gly hydrogen (G178) in the equivalent position (Figure S3). The Phe ring may fixate and/or interact with the aromatic ring of MMAR in such a way as to select or enhance low-energy electronic transitions.
All of the MMAR pigments displayed relatively low proton pumping activities under white light, in the range of 0.1–1.5 H+·s–1 per protein (5–10% of the rate displayed with A1 and A2). Most importantly, however, we observed that the proton pumping activity persisted at about the same level with red light illumination. Significant activity was retained with 730 nm LED illumination, in fact strongly surpassing that of any remaining A2 activity (Figures 3d, 4d, 5e, and 6e and Table 1). Because of the low intensity of the 730 nm LED, an absolute comparison cannot yet be made. However, we estimate that under equal-intensity illumination, the pumping activity with the 730 nm LED would be at least as high as that under white light. Even the PR-DNFS mutant, which is quite impaired in its pump function (30–40% of that for the wild type in white light with A127,29) clearly displays pumping activity under 730 nm LED illumination with MMAR (Figure 4d). The highest activity under this NIR light was observed for the GR-FS:MMAR combination (0.2 H+·s–1 per protein; Figure 6e). However, this rate will increase considerably with higher light intensity and a broader frequency range.
The influence of the local charge environment on its absorbance band thus renders MMAR an excellent candidate for the spectral modulation of microbial rhodopsins. Considering the pumping activity of GR-FS:MMAR and the unique spectral properties of PR-DNFS:MMAR, these analogue pigments would make very promising starting materials for further engineering strategies. For instance, the PR-DNFS:MMAR combination may be a good starting point for directed evolution and computational studies so as to improve the pump function and/or to further red-shift the absorbance band.
Next to the proton pump function, the MMAR pigments could have an interesting alternative function as voltage sensors. The D97N mutant of PR:A1 was shown to be a sensitive sensor of the membrane voltage, exhibiting strongly voltage-dependent fluorescence emission that peaks around 700 nm.39 In preliminary experiments, we observed very strong red-shifted fluorescence of PR-D97N:MMAR peaking around 800 nm (not shown). This spectral range would be quite useful for biotechnological and optogenetic applications, and we are currently further exploring this prospect.
For microbial, cellular, or in vitro applications, the opsins can be easily expressed in transformed cells and the retinal analogues applied to the culture or to membrane vesicles. For in vivo applications, the opsins can be expressed in situ (e.g., via recombinant virus) and the retinal locally applied by stereotactic injection.
Conclusion
We have utilized a novel very effective retinal analogue in combination with site-directed mutagenesis to generate novel rhodopsin proton pump variants that for the first time can be activated by near-infrared light. This research has important implications for synthetic biology strategies to complement oxygenic photosynthesis20 and toward (near-infra-)red light activation of biotechnological and optogenetic tools and membrane sensors.25,26,39,40
Selected Materials and Methods
Most of the materials and methods used in this study are detailed in the Supporting Information. Here we elaborate upon the methods that are most relevant to the data presented above.
Difference Spectroscopy upon Bleaching with Hydroxylamine
The main absorbance bands of the pigments in membrane vesicles isolated from E. coli cells or in a solubilized state were extracted by reaction with hydroxylamine (see the SI). Hydroxylamine specifically attacks the Schiff base bond between lysine and retinal. This results in a loss of the main pigment absorbance band, thereby generating a new absorbance band of the liberated retinaloxime (peaking in 1% DDM between 350 and 402 nm; cf. Table S1). Subtracting the spectrum taken before from that taken after incubation with hydroxylamine generates a difference spectrum that resolves a negative band corresponding to the loss of the proteorhodopsin absorbance band. This reaction thus eliminates the contributions from other membrane components (cytochromes, excess retinal), allowing for a more accurate estimate of the absorbance maximum. This protocol could also be applied to membrane vesicles, which is necessary to extract the absorbance bands of pigments that were not sufficiently stable in DDM or did not survive the purification process. Furthermore, the generated retinal oxime could be used to determine the molar absorbance values of the various analogue pigments (details provided in the SI). This aided in the determination of functional expression levels, which were required to calculate molecular pumping rates for all pigments (details provided in the SI).
Normalization of Proton Pumping Activity
The proton pumping activities of the pigments were measured using four different illumination conditions, namely, white light (DLED9-T; range 400–850 nm), 617 nm LED (600–640 nm), 660 nm LED (620–680 nm), and 730 nm LED (690–760 nm). We used intact E. coli cells, which maintain uniform orientation of the proton pumps in the membrane. The cells were starved for an optimum duration of 4 days in a minimal buffer and further incubated in the presence of the K+ ionophore valinomycin. Under these conditions, proton pumping rates could be extracted as described previously.29 These probably do not yet reflect the maximally attainable rates, since the applied light intensities are still limiting. Hence, because of the variation in the photon flux of the illumination sources used (see the main text), the pumping rates within a set of light conditions were normalized to the highest pumping activity obtained in that set (Table 1). For instance, GR-FS:A1 has the highest pumping rate with white light (9.4 H+·s–1 per protein); hence, the white light pumping rates for all of the pigments were normalized to 9.4. For comparison among the different light regimes, we can further normalize the highest pumping rates obtained in each light regime to the highest pumping rate under white light illumination. For reference, these values are white light (GR-FS:A1, 100%), 617 nm (GR-FS:A1, 80% of white light), 660 nm (GR:A2, 15% of white light), and 730 nm (GR-FS:MMAR, 2% of white light).
Acknowledgments
We thank Hans den Dulk for technical advice and continuous support and Andrean Razumovski for his contribution to the cloning of GR-FS. This study was financially supported by the BioSolar Cells Consortium and Leiden University. The project was carried out in the research program of BioSolar Cells (BSC Core Project Grant C2.9 to W.J.d.G. and K.J.H.), cofinanced by the Dutch Ministry of Economic Affairs.
Supporting Information Available
The Supporting Information is available free of charge on the ACS Publications website at DOI: 10.1021/jacs.6b11366.
λmax and ε values of retinal analogues and pigments (Tables S1 and S2); absorbance spectra of retinal analogues (Figure S1); effect of pH on PR analogue pigments (Figure S2); binding pocket of PR/GR homology models (Figure S3); and a detailed description of materials and methods (PDF)
The authors declare no competing financial interest.
Supplementary Material
References
- Spudich J. L.; Jung K.-H. In Handbook of Photosensory Receptors; Briggs W. R., Spudich J. L., Eds.; Wiley-VCH: Weinheim: Germany, 2005; p 1. [Google Scholar]
- Kandori H. Front Mol. Biosci. 2015, 2, 52. 10.3389/fmolb.2015.00052. [DOI] [PMC free article] [PubMed] [Google Scholar]
- Inoue K.; Tsukamoto T.; Sudo Y. Biochim. Biophys. Acta, Bioenerg. 2014, 1837, 562. 10.1016/j.bbabio.2013.05.005. [DOI] [PubMed] [Google Scholar]
- Oesterhelt D.; Stoeckenius W. Nat. New Biol. 1971, 233, 149. 10.1038/newbio233149a0. [DOI] [PubMed] [Google Scholar]
- Lanyi J. K. Annu. Rev. Physiol. 2004, 66, 665. 10.1146/annurev.physiol.66.032102.150049. [DOI] [PubMed] [Google Scholar]
- Bamann C.; Bamberg E.; Wachtveitl J.; Glaubitz C. Biochim. Biophys. Acta, Bioenerg. 2014, 1837, 614. 10.1016/j.bbabio.2013.09.010. [DOI] [PubMed] [Google Scholar]
- Béjà O.; Aravind L.; Koonin E. V.; Suzuki M. T.; Hadd A.; Nguyen L. P.; Jovanovich S. B.; Gates C. M.; Feldman R. A.; Spudich J. L.; Spudich E. N.; DeLong E. F. Science 2000, 289, 1902. 10.1126/science.289.5486.1902. [DOI] [PubMed] [Google Scholar]
- Man-Aharonovich D.; Sabehi G.; Sineshchekov O. A.; Spudich E. N.; Spudich J. L.; Béjà O. Photochem. Photobiol. Sci. 2004, 3, 459. 10.1039/B316071H. [DOI] [PubMed] [Google Scholar]
- Nguyen D.; Maranger R.; Balague V.; Coll-Lladó M.; Lovejoy C.; Pedrós-Alió C. ISME J. 2015, 9, 1835. 10.1038/ismej.2015.1. [DOI] [PMC free article] [PubMed] [Google Scholar]
- McCarren J.; DeLong E. F. Environ. Microbiol. 2007, 9, 846. 10.1111/j.1462-2920.2006.01203.x. [DOI] [PubMed] [Google Scholar]
- Slamovits C. H.; Okamoto N.; Burri L.; James E. R.; Keeling P. J. Nat. Commun. 2011, 2, 183. 10.1038/ncomms1188. [DOI] [PubMed] [Google Scholar]
- Nakamura Y.; Kaneko T.; Sato S.; Mimuro M.; Miyashita H.; Tsuchiya T.; Sasamoti S.; Watanabe A.; Kawashima K.; Kishida Y.; Kiyokawa C.; Kohara M.; Matsumoto M.; Matsuno A.; Nakazaki N.; Simpo S.; Takeuchi C.; Yamada M.; Tabata S. DNA Res. 2003, 10, 137. 10.1093/dnares/10.4.137. [DOI] [PubMed] [Google Scholar]
- Dioumaev A. K.; Brown L. S.; Shih J.; Spudich E. N.; Spudich J. L.; Lanyi J. K. Biochemistry 2002, 41, 5348. 10.1021/bi025563x. [DOI] [PubMed] [Google Scholar]
- Gómez-Consarnau L.; González J. M.; Coll-Lladó M.; Gourdon P.; Pascher T.; Neutze R.; Pedrós-Alió C.; Pinhassi J. Nature 2007, 445, 210. 10.1038/nature05381. [DOI] [PubMed] [Google Scholar]
- Gómez-Consarnau L.; Akram N.; Lindell K.; Pedersen A.; Neutze R.; Milton D. L.; González J. M.; Pinhassi J. PLoS Biol. 2010, 8, e1000358. 10.1371/journal.pbio.1000358. [DOI] [PMC free article] [PubMed] [Google Scholar]
- Lee K. A.; Jung K.-H. J. Nanosci. Nanotechnol. 2011, 11, 4261. 10.1166/jnn.2011.3669. [DOI] [PubMed] [Google Scholar]
- Karnik S.; Doi T.; Molday R.; Khorana H. G. Proc. Natl. Acad. Sci. U. S. A. 1990, 87, 8955. 10.1073/pnas.87.22.8955. [DOI] [PMC free article] [PubMed] [Google Scholar]
- Walter J. M.; Greenfield D.; Bustamante C.; Liphardt J. Proc. Natl. Acad. Sci. U. S. A. 2007, 104, 2408. 10.1073/pnas.0611035104. [DOI] [PMC free article] [PubMed] [Google Scholar]
- Kim J. Y.; Jo B. H.; Jo Y.; Cha H. J. Microb. Cell Fact. 2012, 11, 2. 10.1186/1475-2859-11-2. [DOI] [PMC free article] [PubMed] [Google Scholar]
- Chen Q.; van der Steen J. B.; Dekker H. L.; Ganapathy S.; de Grip W. J.; Hellingwerf K. J. Metab. Eng. 2016, 35, 83. 10.1016/j.ymben.2016.02.001. [DOI] [PubMed] [Google Scholar]
- Claassens N. J.; Volpers M.; dos Santos V. A. P. M.; van der Oost J.; de Vos W. M. Trends Biotechnol. 2013, 31, 633. 10.1016/j.tibtech.2013.08.006. [DOI] [PubMed] [Google Scholar]
- Claassens N. J.; Sousa D. Z.; dos Santos V. A. P. M.; de Vos W. M.; van der Oost J. Nat. Rev. Microbiol. 2016, 14, 692. 10.1038/nrmicro.2016.130. [DOI] [PubMed] [Google Scholar]
- Blankenship R. E.; Tiede D. M.; Barber J.; Brudvig G. W.; Fleming G.; Ghirardi M.; Gunner M. R.; Junge W.; Kramer D. M.; Melis A.; Moore T. A.; Moser C. C.; Nocera D. G.; Nozik A. J.; Ort D. R.; Parson W. W.; Prince R. C.; Sayre R. T. Science 2011, 332, 805. 10.1126/science.1200165. [DOI] [PubMed] [Google Scholar]
- Knöpfel T.; Lin M. Z.; Levskaya A.; Tian L.; Lin J. Y.; Boyden E. S. J. Neurosci. 2010, 30, 14998. 10.1523/JNEUROSCI.4190-10.2010. [DOI] [PMC free article] [PubMed] [Google Scholar]
- Kushibiki T.; Okawa S.; Hirasawa T.; Ishihara M. Int. J. Photoenergy 2014, 2014, 1. 10.1155/2014/895039. [DOI] [Google Scholar]
- Zhang F.; Vierock J.; Yizhar O.; Fenno L. E.; Tsunoda S.; Kianianmomeni A.; Prigge M.; Berndt A.; Cushman J.; Polle J.; Magnuson J.; Hegemann P.; Deisseroth K. Cell 2011, 147, 1446. 10.1016/j.cell.2011.12.004. [DOI] [PMC free article] [PubMed] [Google Scholar]
- Kim S. Y.; Waschuk S. A.; Brown L. S.; Jung K. H. Biochim. Biophys. Acta, Bioenerg. 2008, 1777, 504. 10.1016/j.bbabio.2008.03.010. [DOI] [PubMed] [Google Scholar]
- Engqvist M. K.; McIsaac R. S.; Dollinger P.; Flytzanis N. C.; Abrams M.; Schor S.; Arnold F. H. J. Mol. Biol. 2015, 427, 205. 10.1016/j.jmb.2014.06.015. [DOI] [PubMed] [Google Scholar]
- Ganapathy S.; Bécheau O.; Venselaar H.; Frölich S.; van der Steen J. B.; Chen Q.; Radwan S.; Lugtenburg J.; Hellingwerf K. J.; de Groot H. J.; de Grip W. J. Biochem. J. 2015, 467, 333. 10.1042/BJ20141210. [DOI] [PubMed] [Google Scholar]
- Foster R. G.; Garcia-Fernandez J. M.; Provencio I.; DeGrip W. J. J. Comp. Physiol., A 1993, 172, 33. 10.1007/BF00214713. [DOI] [Google Scholar]
- Wald G. Nature 1968, 219, 800. 10.1038/219800a0. [DOI] [PubMed] [Google Scholar]
- Jokela-Määttä M.; Pahlberg J.; Lindström M.; Zak P. P.; Porter M.; Ostrovsky M. A.; Cronin T. W.; Donner K. J. Comp. Physiol., A 2005, 191, 1087. 10.1007/s00359-005-0039-8. [DOI] [PubMed] [Google Scholar]
- Tokunaga F.; Ebrey T. Biochemistry 1978, 17, 1915. 10.1021/bi00603a018. [DOI] [PubMed] [Google Scholar]
- Sineshchekov O. A.; Govorunova E. G.; Wang J.; Spudich J. L. Biochemistry 2012, 51, 4499. 10.1021/bi2018859. [DOI] [PMC free article] [PubMed] [Google Scholar]
- Imai H.; Hirano T.; Terakita A.; Shichida Y.; Muthyala R. S.; Chen R.; Colmenares L. U.; Liu R. S. H. Photochem. Photobiol. 1999, 70, 111. 10.1111/j.1751-1097.1999.tb01956.x. [DOI] [PubMed] [Google Scholar]
- AzimiHashemi N.; Erbguth K.; Vogt A.; Riemensperger T.; Rauch E.; Woodmansee D.; Nagpal J.; Brauner M.; Sheves M.; Fiala A.; Kattner L.; Trauner D.; Hegemann P.; Gottschalk A.; Liewald J. F. Nat. Commun. 2014, 5, 5810. 10.1038/ncomms6810. [DOI] [PubMed] [Google Scholar]
- Smolensky Koganov E.; Hirshfeld A.; Sheves M. Biochemistry 2013, 52, 1290. 10.1021/bi301318n. [DOI] [PubMed] [Google Scholar]
- Sheves M.; Friedman N.; Rosenbach V.; Ottolenghi M. FEBS Lett. 1984, 166, 245. 10.1016/0014-5793(84)80088-5. [DOI] [Google Scholar]
- Kralj J. M.; Hochbaum D. R.; Douglass A. D.; Cohen A. E. Science 2011, 333, 345. 10.1126/science.1204763. [DOI] [PubMed] [Google Scholar]
- Ernst O. P.; Lodowski D. T.; Elstner M.; Hegemann P.; Brown L. S.; Kandori H. Chem. Rev. 2014, 114, 126. 10.1021/cr4003769. [DOI] [PMC free article] [PubMed] [Google Scholar]
Associated Data
This section collects any data citations, data availability statements, or supplementary materials included in this article.


