
Figure 1. A. Ratios of FCGRT mRNA in cancerous (C) / non-cancerous (NC) in paired tissues from the NSCLC patients (n=80; P = 6.
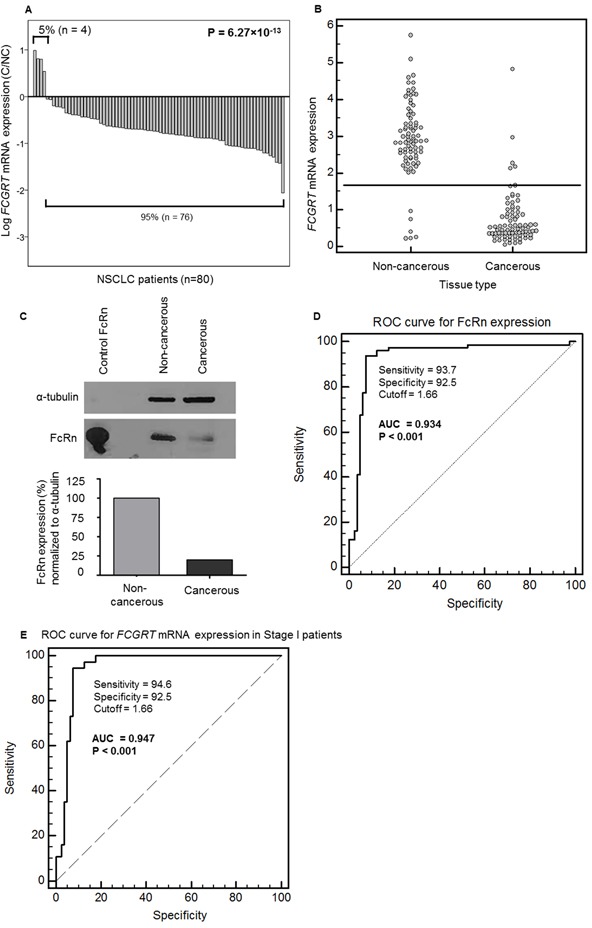
27×10−13, Wilcoxon Signed Ranks test). B. Distribution of FCGRT mRNA levels in non-cancerous and cancerous tissues (n=80; P = 2.54×10⁻²¹, Mann-Whitney test). C. Representative image of FcRn protein revealed by western blotting in a pool of 10 patients with matched cancerous and adjacent non-cancerous tissue. Recombinant human FcRn protein was loaded as a positive control. Signals were quantified with ImageJ and normalized to that for α-tubulin. D. ROC curve analysis for FCGRT mRNA level in cancerous and non-cancerous lung tissue samples. n= 80, AUC = 0.934, SE = 0.024, 95% CI = 0.884 – 0.967, P < 0.0001, calculations according to DeLong et al., 1988. Youden index J = 0.863 (95% CI = 0.775 – 0.925, BCa bootstrap interval, 1000 iterations). E. ROC curve analysis for FCGRT mRNA levels in stage I cancerous and in non-cancerous tissues (n=37; AUC = 0.947, 95% CI = 0.905 – 0.989, P < 0.001, calculations according to DeLong et al., 1988. Youden index J = 0.871 (95% CI = 0.771 – 0.938, BCa bootstrap interval, 1000 iterations).