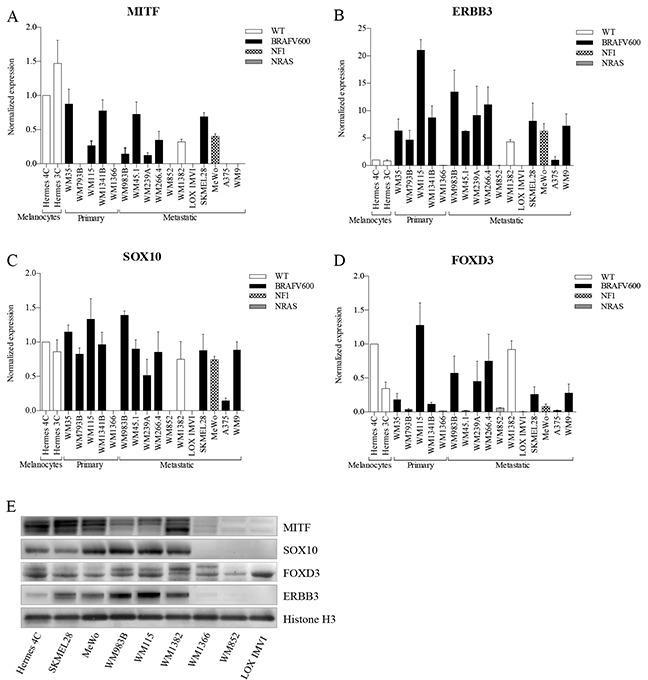
Figure 1. Basal expression levels of MITF, ERBB3, SOX10 and FOXD3 in various melanoma cell lines.

A-D. qRT-PCR was used to evaluate mRNA levels of MITF (A), ERBB3 (B), SOX10 (C), and FOXD3 (D) in melanoma cell lines by normalizing against immortalized cultured melanocytes (Hermes 4C). Bars represent mean ± SD of three separate experiments (E). Representative western blots of MITF, SOX10, FOXD3 and ERBB3 protein levels shown in 9 different cell lines representing various disease stage and genetic background. Histone H3 was used as loading control.
