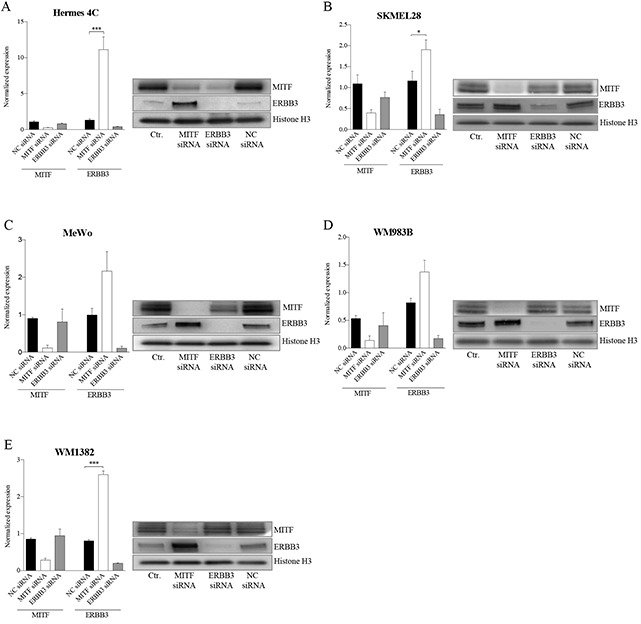
Figure 2. MITF suppresses ERBB3 expression at the transcriptional level in various cell lines after siRNA transfections.

Assessment of mRNA and protein levels of MITF and ERBB3 in a panel of cell lines 72h after siRNA-induced reduction of MITF and ERBB3. A. Hermes 4C (immortalized melanocytes). B. SKMEL28 (BRAFV600E) C. MeWo (NF1) D. WM983B (BRAFV600E) E. WM1382 (wild-type for BRAF and NRAS). Graphs represent qRT-PCR expression data from three separate experiments normalized to untreated control cells and plotted as mean ± SD. * =p < 0.05, *** =p <0.005 (t-test). A representative western blot of the corresponding treatments is shown to the right, with Histone H3 as loading control.
