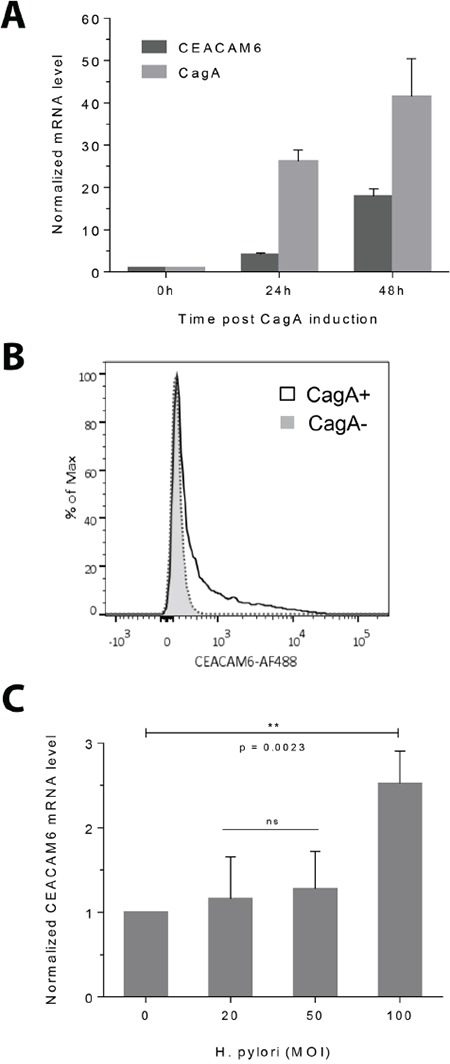
Figure 1. CEACAM6 expression is upregulated by CagA and H. pylori infection.

A. RT-PCR showing the time course of CEACAM6 transcript upregulation after CagA induction, in relation to CagA levels in the CagA inducible WT-A10 cell line. CT values are normalized to 18S RNA and shown relative to CEACAM6 or CagA levels before CagA induction to demonstrate fold change. Mean±SD, n=3. B. Flow cytometric histogram of CEACAM6 protein levels in CagA-negative (baseline) and CagA-positive (induced) cells, showing elevated CEACAM6 protein levels 48h after CagA induction. C. RT-PCR showing that H. pylori infection upregulates CEACAM6. MKN28 cells were infected with increasing MOI's of isogenic wild-type H. pylori and CEACAM6 transcripts were measured by RT-PCR 24h after infection. Mean±SD, n=3. Unpaired t test, ns = not significant.
