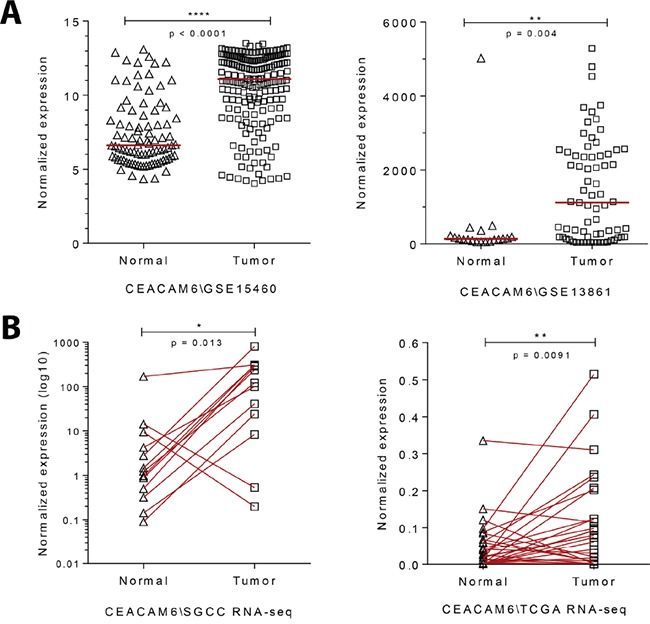
Figure 2. Gene expression analysis of gastric cancers show an enrichment for CEACAM6.

A. Dot plot of relative CEACAM6 transcript levels in gene expression arrays of gastric cancer in comparison to normal stomach tissue (GSE15460 (SGCC) – Normal=85, Tumor=185; GSE13861 - Normal=19, Tumor=65). Median, unpaired t test. B. Plot of relative CEACAM6 transcript levels using RNA-seq analysis of matched gastric cancers compared to normal adjacent tissue (SGCC n=15, TCGA n=29). Paired t test.
