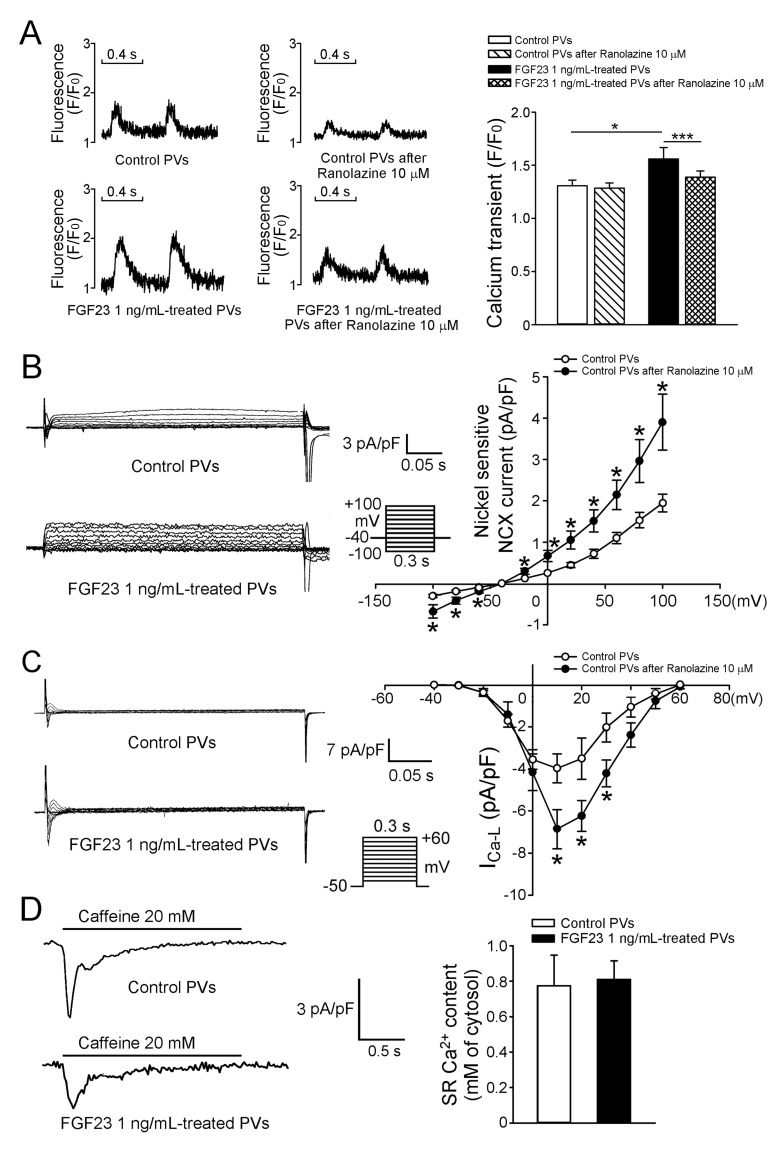
Figure 4. Intracellular calcium homeostasis and ionic currents in control and FGF23-treated PV cardiomyocytes.
A. Tracings and average data of calcium transients in control (n = 10) and FGF23 (1 ng/mL)-treated PV cardiomyocytes (n = 10) before and after ranolazine (10 μM) administration. B. Tracings and I-V relationship of the NCX from control (n = 10) and FGF23 (1 ng/mL)-treated PV cardiomyocytes (n = 10). C. Tracings and I-V relationship of the ICa-L from control (n = 10) and FGF23 (1 ng/mL)-treated PV cardiomyocytes (n = 10). The inset in the current trace shows the clamp protocol. D. Tracings and average data of caffeine-induced NCX and SR calcium contents from integrating NCX currents in control (n = 11) and FGF23 (1 ng/mL)-treated PV cardiomyocytes (n = 11). * p < 0.05, *** p < 0.005.

