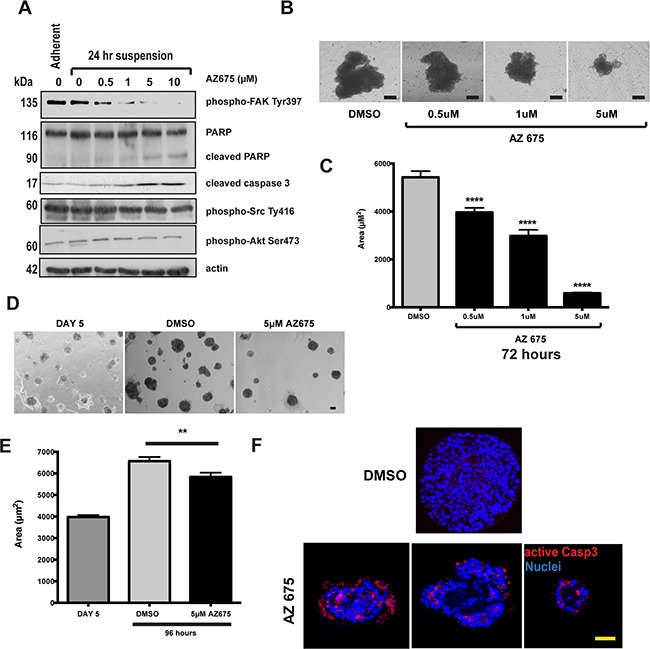
Figure 6. 4T1 breast cancer cells that show adhesion independent FAK signalling are sensitive to FAK inhibition.

A. 4T1 cells were grown either attached or in suspension for 72 hours, and then treated with the indicated concentrations of AZ675 for 24 hours. Cells were lysed in RIPA buffer and immunoblotted using the indicated antibodies. As in MCF10A cells, AZ675 did not inhibit Src or Akt phosphorylation. B. Equal numbers of 4T1 cells were grown in suspension in the presence of either DMSO or the indicated concentrations of AZ675 for 72 hours. Representative images of spheroids formed at the end of the time period are shown. Scale bar = 25 μm. C. Quantification of the area of 4T1 spheroids from the experiment in B. Data represent > 500 spheroids from three independent experiments. Error bas = SEM. Data were analysed by ANOVA. **** = p< 0.0001. D. 4T1 cells were plated as single cells in matrigel and cultured for 5 days. At day 5, cells were fed with fresh culture media containing either DMSO or 5 μM AZ675, and cultured for a further 96 hours. Representative images are shown at day 5, prior to treatment, and following treatment for 96 hours. Scale bar = 50 μm. E. Quantification of acinar area from panel D. Acinar size was measured using ImageJ, and represent the mean of > 250 acinar structures from three independent experiments. Error bars = SEM. Data were analysed by ANOVA. ** = p < 0.05. F. 4T1 cells in 3D-matrigel following 5-day pre-treatment and 96 hours in DMSO or 5 μM AZ675. Cells were immunostained for active caspase 3. Three representative images of AZ675 acini are shown, indicating that, unlike in MCF10A cells, apoptosis in 4T1 cells is not spatially restricted to the luminal cells. Scale bar = 50 μm.
