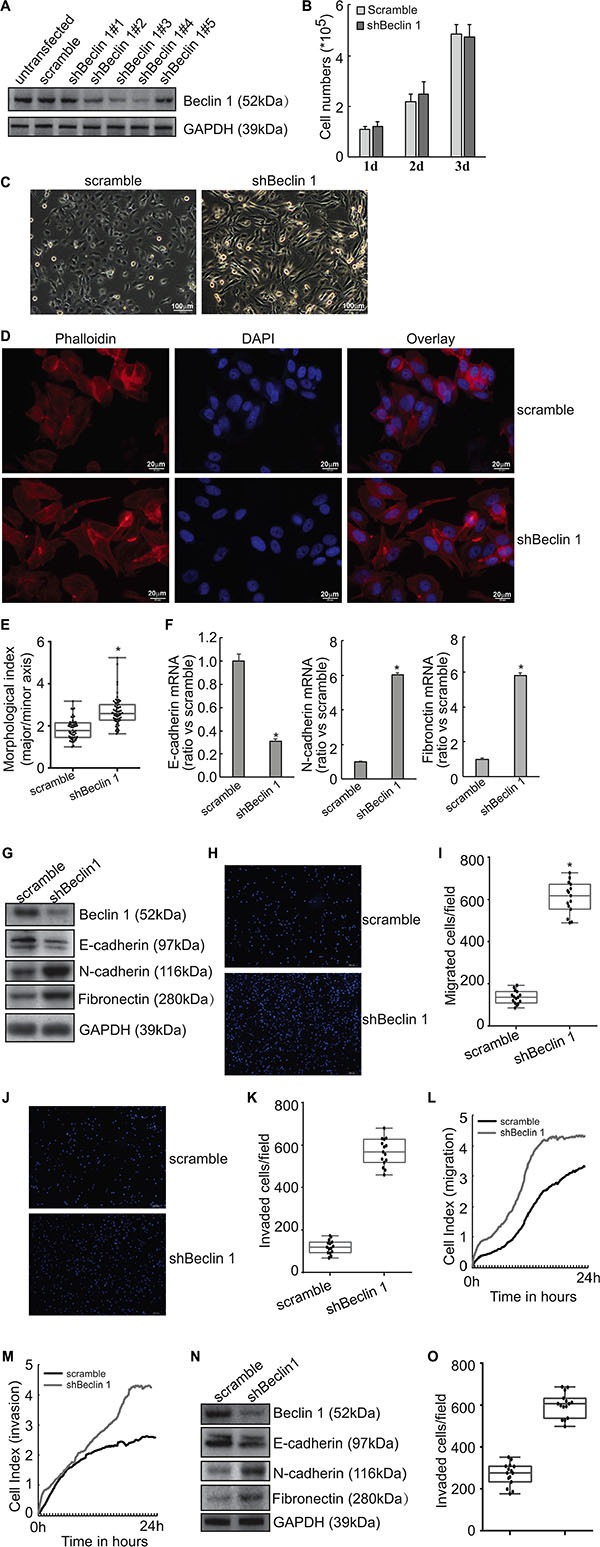
Figure 1. Induction of EMT by Beclin 1 knockdown in thyroid cancer cells.

(A) FRO cells were transfected with scramble or Beclin 1 shRNAs. Beclin 1 expression was measured using Western blot. (B) Stable subline cells were selected using G418 and cell number was counted. (C) Cell morphology was observed under phase contrast microscopy. (D) Cells were stained with phalloidin (red) and nucleus with DAPI (blue). (E) Quantitative analysis of the degree of elongated cell morphology or morphological index in D. Representative data shown are from a single experiment, for which n was at least 50 for each cell type. F, mRNA levels of EMT markers were analyzed using Quantitative PCR. (G) protein levels of EMT markers were measured using Western blot analysis. H-K, The migration (H–I) and invasion (J–K) of the indicated cells was evaluated by Transwell assays without and with Matrigel, respectively. Cells that have passed through membrane for 24 h were counted in five representative microscopic fields, and three independent experiments were performed. Presentative images was provided (H, J) and cell numbers for each count were plotted in the graph (I, K). (L–M) Cells were added in serum-free medium to the upper wells of the CIM plates separated by an 8-μm pore size membrane without (migration) or with (invasion) a layer of Matrigel matrix, and the migration (L) and invasion (M) were assessed for 24 h using the RTCA instrument. (N) KTC3 cells were transfected with scramble of shBeclin 1, Western blot was performed using the indicated antibodies. (O) The invasion of KTC3 cells transfected with scramble or shBeclin 1 was analyzed using Matrigel-coated Transwell assay, cell numbers passed through Matrigel were counted and plotted in the graph. Similar data was obtained from three independent cell preparations. N.S., not significant; *P < 0.01.
