Abstract
Overproduction of lactate is a hallmark of cancer yet a method to quantitatively measure lactate production by cancer cells is not straight-forward. CEST MRI can potentially be used to image lactate but the small difference in chemical shift of the lactate -OH proton and water proton resonances make it challenging. Like other spectroscopic methods, CEST MRI cannot discriminate intracellular lactate from extracellular lactate. Here, we demonstrate a relatively simple way to shift of the lactate -OH proton resonance far away from water by addition of the paramagnetic shift reagent, EuDO3A, while retaining the CEST properties of lactate itself. The potential of the method was demonstrated by imaging extracellular lactate excreted from lung cancer cells in tissue culture without interference from other components in the culture media and by imaging excess lactate excreted into the bladder of a mouse.
Graphical Abstract
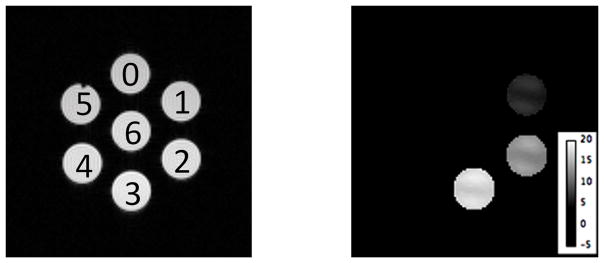
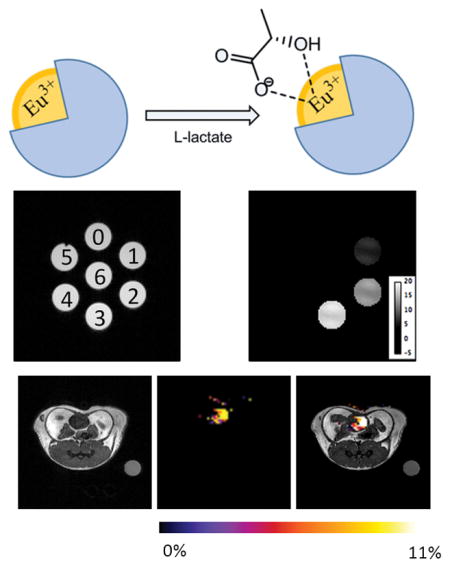
A simple CEST method is demonstrated for imaging lactate by using of a paramagnetic shift reagent (SR) to shift the lactate –OH CEST peak well downfield of water. This feature enables direct MR imaging of extracellular lactate produced by cancer cells in culture and the lactate•EuDO3A complex in vivo.
Contrast agents are often used in magnetic resonance imaging (MRI) studies to enhance contrast between poorly perfused and highly perfused tissues.[1] During the last decade, a new type of contrast mechanism based on chemical exchange saturation transfer (CEST) has been explored using a variety of diamagnetic and paramagnetic molecules. One advantage of CEST over typical T1 or T2 agents is that contrast can be turned “on” and “off” by use of frequency-selective activation pulses.[2] Based on this mechanism, many molecules have been proposed for measuring physiological parameters such as pH, temperature, metal ions and enzyme activities.[3–5] Many endogenous biomolecules contain exchangeable OH protons and several have been detected using CEST MRI, including glucose[6] and glycogen.[7] Lactate also has an exchangeable –OH proton that could potentially be detected by CEST, but the chemical shift of the lactate –OH proton is even closer to water than the –OH protons of glucose. This small difference makes it quite difficult to detect lactate by CEST, especially in vivo where many other OH resonances interfere. Even with this limitation, a recent report demonstrated that lactate can be detected in highly exercised skeletal muscle in vivo by CEST MRI.[8]
Lactate is overproduced by most tumors even in the presence of abundant oxygen (the Warburg effect) so a method that allows direct imaging of lactate production by tumors could provide new insights into cancer metabolism.[9] A variety of pulse sequences have been used to detect lactate in tissues by 1H NMR spectroscopy[10] even in the presence of abundant overlapping lipid signals. More recently, hyperpolarized 13C imaging has been used to detect lactate in human prostate cancer and the amplitude of the hyperpolarized lactate signal has been shown to reflect tumor aggressiveness.[11] However, both methods detect total tissue lactate and do not easily differentiate intracellular lactate from extracellular lactate. A method that allows this distinction could be important because transport of lactate and protons out of cancer cells into the extracellular space is thought to be a key factor in initiating tumor metastases.[12]
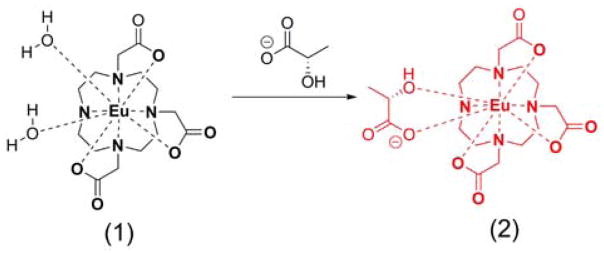
Lanthanide complexes capable of binding to lactate have been reported previously.[13] In 2002, Aime, et al., demonstrated that the amide CEST signals of Yb-MB-DO3AM change frequency upon formation of a ternary complex with lactate.[14] This illustrated for the first time that a shift reagent (SR) could potentially be designed to sense key metabolites as long as the SR meets the coordination requirements of the substrate of interest. This same group later measured binding constants between lactate and several GdDO3A derivatives by 1H and 19F NMR. In that study, they demonstrated that the lactate binding affinity can be altered by simple chemical modification of the DO3A chelate.[13] These observations stimulated us to explore the possibility of using a paramagnetic shift reagent to shift the lactate -OH resonance well away from the tissue water signal so that lactate can be detected by CEST without interference from other endogenous –OH containing metabolites. EuDO3A was initially chosen for this purpose because this complex has two inner-sphere water molecules that are easily displaced by bidentate lactate (Scheme 1).
Scheme 1.
Structure of EuDO3A (1) and the lactate•EuDO3A complex (2).
A recent report showed that a CEST signal from the single exchanging -OH proton of lactate can be detected ~0.4–0.5 ppm downfield of water and the rate of proton exchange between lactate and water at pH 7 and 25°C was reported to be ~350 ± 50 s−1.[8] This same proton exchange rate was measured here in a 50:50 mixture of H2O/D2O (to better resolve the CEST signal from water) at three different pH values (Table 1). Although the absolute rates measured here in H2O/D2O cannot be directly compared with those reported by DeBrosse et al. due to solvent differences, the results demonstrate that proton exchange is slowest at pH 7 and faster at both higher and lower pH values. Upon addition of one equivalent of EuDO3A to lactate, a new CEST signal appears near 47 ppm (Figure 1) that is not present in a CEST spectrum of EuDO3A alone. The amplitude of this new CEST signal increases in proportion to the amount of added lactate, showing that it reflects formation of new CEST active lactate•EuDO3A complex. The proton exchange rate for this new complex was measured using the Omega plot method[15] and also found to be pH dependent, with a minimum rate between pH 6–7 (Table 1). This indicates the proton exchange in both free lactate and in the lactate•EuDO3A complex is catalyzed by acid and by base.[16] A comparison of exchange rates for the two species shows that the proton in the lactate•EuDO3A complex exchanges about 10-fold faster than the proton in free lactate, as expected for an -OH group directly coordinated to a trivalent metal ion.
Table 1.
Proton exchange rates and association constants (KA) for formation of the major lactate•EuDO3A species at four pH values at 298K.
| pH | kex (s−1)47ppm[a] lactate•EuDO3A |
KA (M−1)[b] | kex (s−1)[d] lactate |
|---|---|---|---|
| 5 | 3610±360 | 95±4 | N/A[c] |
| 6 | 2469±250 | 45±3 | 336±33 |
| 7 | 2179±220 | 42±4 | 131±13 |
| 8 | 4082±400 | 151±8 | 790±79 |
Determined using the Omega method by varying B1 from 2.35~23.5 μT and a pre-saturation time of 10 s.
Determined by fitting CEST titrations collected using a B1 of 23.5 μT and a pre-saturation time of 10 s.
Fast proton at pH 5 precluded this measurement.
Determined using the Omega method and three saturation powers (0.67 μT, 1.01 μT and 1.35 μT) and a 10s pre-saturation period. Lactate was dissolved in D2O/H2O (1:1).
Figure 1.
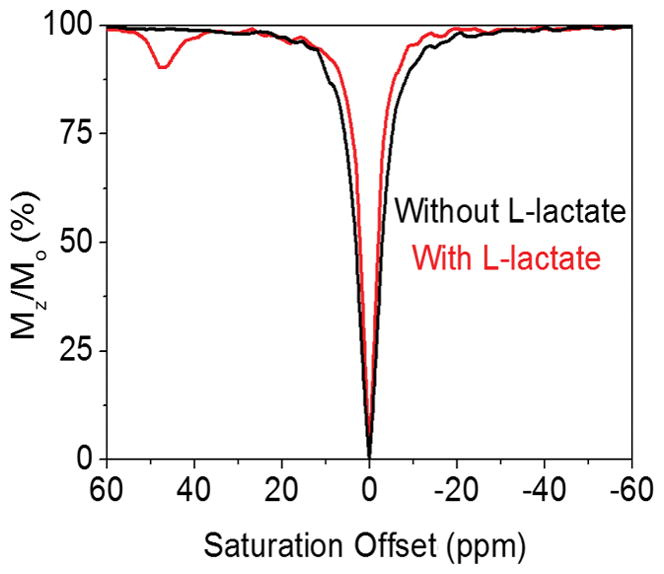
CEST spectra of 10 mM EuDO3A in the absence (black) and presence (red) of 10 mM lactate. Sample conditions: pH 8.2, 298 K, saturation power = 14.1 μT, saturation time = 7 s.
In samples containing much higher concentrations of EuDO3A and lactate (Figure S4), a second weaker CEST peak is also present in the spectra near 19 ppm, reflecting a second type of lactate•EuDO3A complex that forms only at higher concentrations. To gain more insights into the structures of these two lactate•EuDO3A complexes, we turned to high resolution 1H NMR spectroscopy. The spectrum of EuDO3A alone (Figure 2) shows four highly shifted resonances between 17–36 ppm characteristic of the four non-equivalent macrocyclic axial H4 protons in the square anti-prismatic (SAP) coordination isomer.[17] Upon addition of lactate, a new species appears in the spectrum with four different H4 proton resonances (red arrows). The frequency separation among the four H4 resonances in this new species is smaller (20–29 ppm), showing that newly formed lactate•EuDO3A complex has higher symmetry than EuDO3A alone. For the sample containing 50 mM EuDO3A and 50 mM lactate, resonances characteristic of both free EuDO3A and the lactate•EuDO3A complex were visible in the spectrum, indicating that a 1:1 complex is not fully formed under these concentrations. With further addition of lactate, the resonances of EuDO3A completely disappear and a second less intense group of four axial resonances become evident between 19–27 ppm (green arrows). A second minor species similar to this was also observed in the spectrum of [Yb(MBZDO3AM)]3+ after addition of lactate.[17] This minor species only appears at very high lactate concentrations and likely corresponds to the minor species detected by CEST at 19 ppm.
Figure 2.
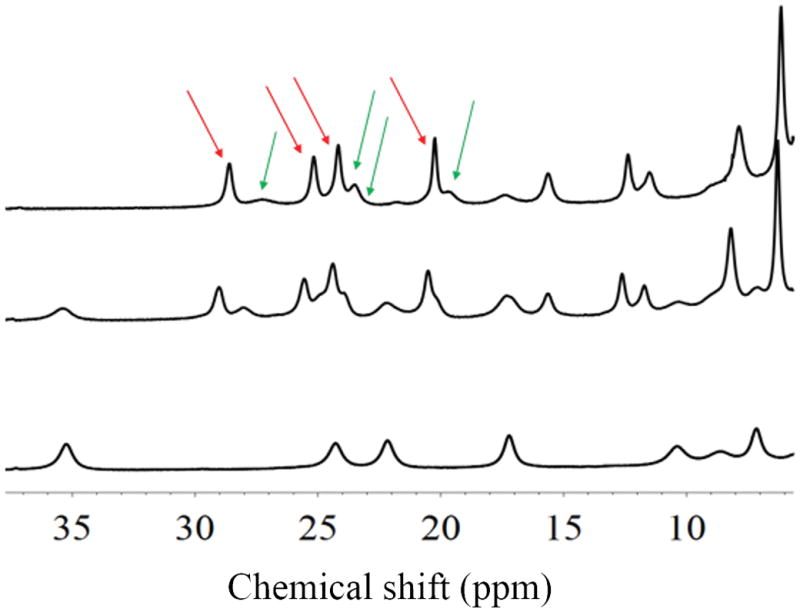
1H NMR spectra of an aqueous solution (pD=8.0, 277K) containing 50 mM EuDO3A (bottom), 50 mM EuDO3A plus 50 mM lactate (middle), and 50 mM EuDO3A plus 2 M lactate (top). The red and green arrows reflect the H4 resonances of two different lactate•EuDO3A species.
Given that the CEST peak in the major lactate•EuDO3A complex (47 ppm) has a chemical shift similar to the bound water molecule CEST peak in symmetric complexes such as EuDOTA-(gly)4,[18] the lactate –OH group in this major species must coordinate to the Eu3+ ion in an apical position similar to that of the single water molecule in the EuDOTA-tetraamide complexes. Closer inspection of the 47 ppm CEST peak in samples containing largely D2O reveals that this peak actually has two overlapping components of near equal amplitude (Figure S3). Since EuDO3A exists in solution as diastereoisomers (Δ and Λ) both capable of forming a complex with lactate, the near equally intense CEST peaks in the D2O sample near 45 ppm are logically assigned to these two diastereomeric lactate•EuDO3A complexes, both of which must have a lactate OH group positioned in an apical position near the top of the molecule. A molecular model is shown in Figure 3 (left). Given that lactate has an asymmetric carbon with a relatively bulky methyl group, lactate may have a slight preference for one diastereomer of EuDO3A over the other simply due to interactions between the bulky methyl group and the three acetate arms of DO3A. Also, this model supports the observation that the chemical shifts of two CEST peaks in the two diastereomer complexes are not magnetically equivalent even though the H4 protons in these two species cannot be resolved (red arrows in Figure 2).
Figure 3.
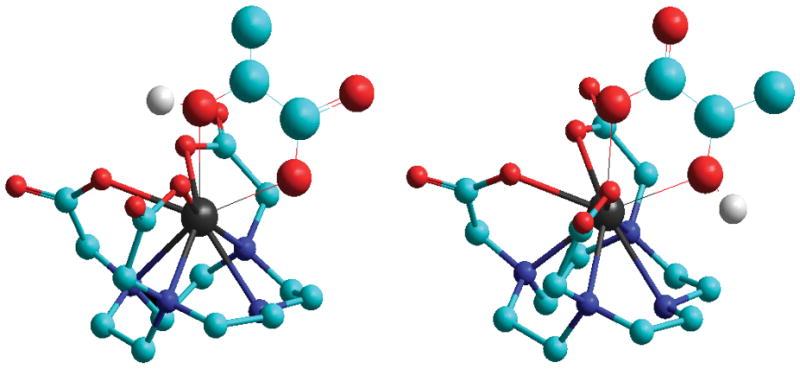
Schematic representation of the two binding modes proposed for lactate•EuDO3A. (Left): The favoured species (47 ppm) has the lactate OH group bound near the highest-fold symmetry axis of the chelate. (Right): The less favoured species (19 ppm) likely has the lactate carboxyl group bound near the highest-fold symmetry axis and the OH group in a more equatorial position. Both structures exist as diasteroisomers with the acetate arms twisted clockwise or counter-clockwise relative to the cyclen ring (Λ(δδδδ) and Δ(λλλλ)).
The species with a CEST OH peak near 19 ppm must then be assigned to the less abundant species detected in the 1H NMR spectrum (marked by the four green arrows in Figure 2). The chemical shifts of the four H4 protons in this minor species were only slightly upfield of the H4 proton resonances of the major species so any structural differences between the major and minor lactate•EuDO3A species must be relatively minor. However, the fact that the chemical shift of the OH proton in minor lactate•EuDO3A species (19 ppm) differs considerably from that of the major lactate•EuDO3A species indicates that the position of the coordinating lactate OH group must also be quite different. The most reasonable explanation is that the lactate is coordinated to EuDO3A, again in a bidentate configuration, but with the carboxyl group in the apical position and the OH group in a more equatorial position. Based on geometry alone, this would result in a dramatically smaller lanthanide induced shift in the OH proton even though the differences in chemical shifts of the H4 protons are relatively small.
To evaluate the binding constant of the major lactate•EuDO3A species, CEST titrations were performed at concentrations where the minor species is negligible. One such titration result for samples containing 10 mM EuDO3A plus variable amounts of added lactate at four different pH values is shown in Figure 4. The binding constants (KA) determined by fitting these data to a simple 1:1 binding model are summarized in Table 1. Nearly identical results were obtained by fitting other titration curves where the EuDO3A concentration was 50 mM (Figure S7). This indicates that the presence of a small amount of the minor lactate•EuDO3A species in the 50 mM solution did not have a substantial impact on this calculation. Interestingly, the binding constants (KA) were found to be comparable at pH 6 and 7 but were higher at both pH 5 and pH 8. The origin of these differences is not evident from these data but appears to be related to slight differences in the hydration state of EuDO3A at higher and lower pH values. Given that the rate of proton exchange from the coordinated –OH group in lactate•EuDO3A is also pH dependent, these differences in KA may reflect association of H+ or OH− ions with water molecules in the hydration spheres surrounding the EuDO3A that, in turn, influences the binding of lactate to some extent. Nevertheless, the KA value determined here at pH 8 (151 M−1) was identical to that reported previously for lactate binding to GdDO3A so this appears to be a general phenomenon.[13]
Figure 4. Amplitude of the 47 ppm CEST peak plotted as a function of lactate concentration.
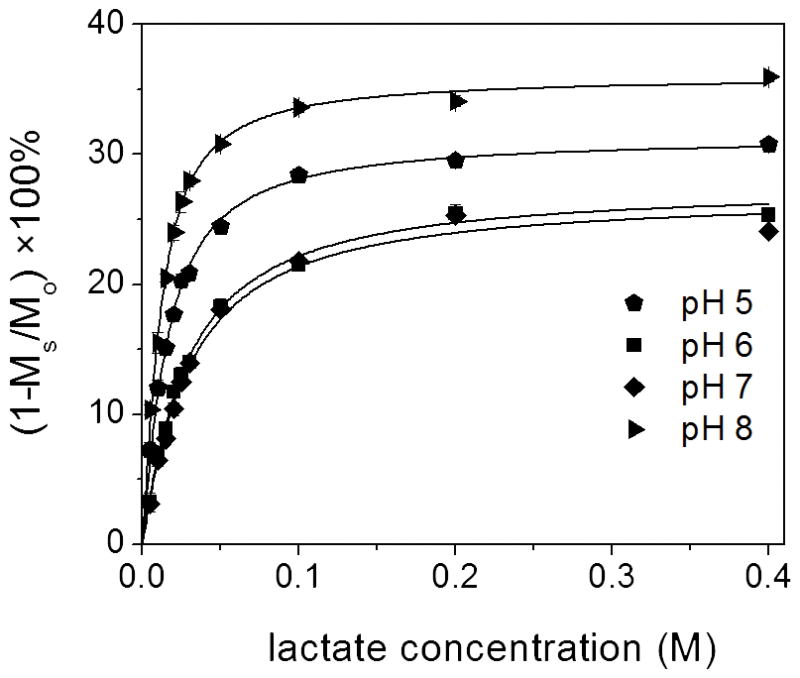
EuDO3A was held constant at 10 mM while lactate was varied from 5 to 400 mM at four different pH values. A pre-saturation pulse of 23.5 μT was applied for 10s at 25°C for each data point.
To determine potential binding interferences from other common biological molecules, additional in vitro experiments were performed using EuDO3A•lactate dissolved in 4% HSA and cell growth media containing glucose, bicarbonate, monosodium phosphate and citric acid. The CEST spectra of those samples surprisingly differed less than ~5%, showing that other biological anions that typically bind to metal ions do not compete with lactate for binding to EuDO3A (Figure S4). It has been reported that bicarbonate has a 10-fold lower affinity for some EuDO3A-amide complexes when compared to lactate.[19] This result encouraged us to perform imaging studies of lactate production in cells growing in culture media using this method. Images of cell media from A549 lung cancer cells grown in cell culture over a period of three days under normoxic conditions are shown in Figure 5. CEST images of seven phantom tubes containing samples of media collected each day for 3 days, fresh media, and water, each containing 10 mM EuDO3A, are also shown. In each case, the pH of each sample was adjusted to 5.5 immediately prior to imaging at 310K. CEST images acquired using a 16 μT pre-saturation pulse at ±43 ppm, the frequency of the major lactate•EuDO3A species at 310K showed a clear increase in CEST intensity from lactate produced by cells over days 1–3. The sample collected at day 3 containing 28 mM lactate as assayed by use of a commercial lactate dehydrogenase (LDH) kit[10,20] showed a CEST amplitude of 17.4%. Using a calibration curve established for a sample of 10mM EuDO3A and variable amounts of lactate, this CEST amplitude corresponded to a lactate concentration of 27.9 ± 3 mM. Thus, the CEST measurement of lactate closely matched that measured using a standard LDH enzymatic assay (Figure S8).
Figure 5.
Phantom images containing water (#6), fresh cell culture media (#0) and media samples collected after days (#1), (#2), and (#3). 10mM EuDO3A was added to each sample and the pH was adjusted to 5.5. Samples #4 contained only 10mM lactate (no SR) and #5 only cell culture medium (no SR). The T1-weighted proton image (left) shows the positions of each sample while the CEST images (right) show increasing accumulation of extracellular lactate over 3 days. The CEST images were collected by pre-saturation of the lactate peak at 43 ppm using a 16 μT pulse of 5 s duration (T= 310K).
Since our ultimate goal is to image lactate production in tumors in vivo, as a first step we also evaluated the potential of this method for detecting lactate in normal healthy mice after IV injection of the 1:1 mixture of EuDO3A and lactate. Although a CEST signal of lactate•EuDO3A was not detected in tissues, a strong CEST signal characteristic of the major species (43 ppm) was quite evident in the bladder of these animals at 45 minutes (Figure 6). There was no evidence of toxicity in these animals and further HPLC analyses of urine after imaging showed that EuDO3A was intact.
Figure 6.
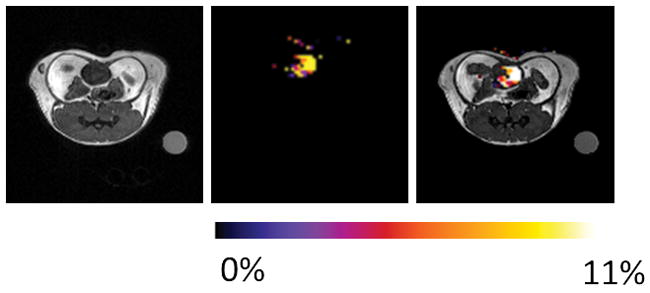
Axial proton MRI, CEST image, and overlay image of a mouse after IV injection of 0.105 mmol/kg EuDO3A and lactate. The CEST image of the bladder shows that the intact lactate•EuDO3A complex is present at 45 min after iv injection (n=3). The CEST image represents amplitude differences between images collected after a 14 μT pre-saturation pulse of 5 s duration at ±43 ppm.
We conclude that lactate can be detected by CEST using EuDO3A to shift the lactate OH CEST peak well downfield from its original position near bulk water. This sizeable shift allows for selective and direct detection of lactate without significant off-resonance saturation of water protons. The structural NMR studies showed that the two available positions normally occupied by two bound waters can be replaced by lactate, and the coordination chemistry of lactate•EuDO3A showed three different species all in a square anti-prism geometry, two diastereomeric complexes with the lactate OH group bound to the Eu3+ ion in an apical position and a minor one with the lactate carboxyl group occupying the apical position. The CEST spectrum in 98% D2O and 1H NMR were consistent with these assignments. The OH CEST signal from lactate is temperature and pH dependent, showing a maximum effect under slightly acidic or alkaline conditions. Such behavior correlates nicely with the increase in the KA and kex determined experimentally. These data demonstrate that paramagnetic shift reagents can be used to simplify detection of diaCEST molecules such as lactate by MRI. Considering that there has been great interest in discovering new diaCEST molecules with chemical exchange groups shifted well downfield of the water proton resonance frequency,[21] the approach described here may prove useful in the design of metabolite-specific shift reagents that magnify this chemical shift difference much more dramatically.
Finally, it is worth considering the potential applicability of this method for imaging lactate production by tumors in vivo. The amount of SR used in the in vivo experiments described here (0.105 mmol/kg) may limit detection of lactate in tumors but this limitation could potentially be overcome by delivering the SR in the form of a nanoparticle into the extracellular space of a tumor using the well-known enhanced permeability and retention (EPR) effect. This may allow delivery of sufficient SR into the extracellular space of tumors to allow monitoring of lactate production over a period of time sufficient to classify the metabolic phenotype of tumor. It has been reported that nanoparticles deliver 24-fold higher accumulation of therapeutic drugs using 100–200 nm sized nanoparticles[22]. Given the uncertainties about the role of the Warburg effect on tumor growth and regulation, an imaging biomarker that measures actual lactate production (as opposed to glucose uptake) could potentially provide new insights into cancer metabolism that are simply not available using standard clinical imaging modalities.
Supplementary Material
Acknowledgments
The authors thank the NIH (CA115531 and EB015908) and the Robert A. Welch Foundation (AT-584) for financial support.
Contributor Information
Lei Zhang, Department of Chemistry and biochemistry, University of Texas at Dallas, 800 West Campbell Road, Richardson, TX 75080 (USA).
Dr. André Martins, Department of Chemistry and biochemistry, University of Texas at Dallas, 800 West Campbell Road, Richardson, TX 75080 (USA).
Yuyan Mai, Department of Chemistry and biochemistry, University of Texas at Dallas, 800 West Campbell Road, Richardson, TX 75080 (USA).
Dr. Piyu Zhao, Department of Chemistry and biochemistry, University of Texas at Dallas, 800 West Campbell Road, Richardson, TX 75080 (USA)
Dr. Alexander Funk, Advanced Imaging Research Center, UT Southwestern Medical Center, 5323 Harry Hines Blvd, Dallas, TX 75390 (USA)
Dr. M. Veronica Clavijo Jordan, Advanced Imaging Research Center, UT Southwestern Medical Center, 5323 Harry Hines Blvd, Dallas, TX 75390 (USA)
Dr. Shanrong Zhang, Advanced Imaging Research Center, UT Southwestern Medical Center, 5323 Harry Hines Blvd, Dallas, TX 75390 (USA)
Dr. Wei Chen, Advanced Imaging Research Center, UT Southwestern Medical Center, 5323 Harry Hines Blvd, Dallas, TX 75390 (USA)
Dr. Yunkou Wu, Advanced Imaging Research Center, UT Southwestern Medical Center, 5323 Harry Hines Blvd, Dallas, TX 75390 (USA)
Prof. A. Dean Sherry, Department of Chemistry and biochemistry, University of Texas at Dallas, 800 West Campbell Road, Richardson, TX 75080 (USA). Advanced Imaging Research Center, UT Southwestern Medical Center, 5323 Harry Hines Blvd, Dallas, TX 75390 (USA)
References
- 1.Merbach AS, Helm L, Tóth E. The Chemistry of Contrast Agents in Medical Magnetic Resonance Imaging. Wiley; 2013. [Google Scholar]
- 2.Woods M, Woessner DE, Sherry AD. Chem Soc Rev. 2006;35:500–511. doi: 10.1039/b509907m. [DOI] [PMC free article] [PubMed] [Google Scholar]
- 3.Zhang S, Malloy CR, Sherry AD. J Am Chem Soc. 2005;127:17572–17573. doi: 10.1021/ja053799t. [DOI] [PMC free article] [PubMed] [Google Scholar]
- 4.Aime S, Delli Castelli D, Terreno E. Angew Chem Int Ed. 2002;41:4334–4336. doi: 10.1002/1521-3773(20021115)41:22<4334::AID-ANIE4334>3.0.CO;2-1. [DOI] [PubMed] [Google Scholar]
- 5.Yoo B, Pagel MD. J Am Chem Soc. 2006;128:14032–14033. doi: 10.1021/ja063874f. [DOI] [PubMed] [Google Scholar]
- 6.Zhang S, Trokowski R, Sherry AD. J Am Chem Soc. 2003;125:15288–15289. doi: 10.1021/ja038345f. [DOI] [PubMed] [Google Scholar]
- 7.van Zijl PCM, Jones CK, Ren J, Malloy CR, Sherry AD. Proc Natl Acad Sci. 2007;104:4359–4364. doi: 10.1073/pnas.0700281104. [DOI] [PMC free article] [PubMed] [Google Scholar]
- 8.DeBrosse C, Nanga RPR, Bagga P, Nath K, Haris M, Marincola F, Schnall MD, Hariharan H, Reddy R. Sci Rep. 2016;6:19517. doi: 10.1038/srep19517. [DOI] [PMC free article] [PubMed] [Google Scholar]
- 9.Heiden MGV, Cantley LC, Thompson CB. Science. 2009;324:1029–1033. doi: 10.1126/science.1160809. [DOI] [PMC free article] [PubMed] [Google Scholar]
- 10.José da Rocha A, Túlio Braga F, Carlos Martins Maia A, Júnior, Jorge da Silva C, Toyama C, Pereira Pinto Gama H, Kok F, Rodrigues Gomes H. J Neuroimaging. 2008;18:1–8. doi: 10.1111/j.1552-6569.2007.00205.x. [DOI] [PubMed] [Google Scholar]
- 11.Albers MJ, Bok R, Chen AP, Cunningham CH, Zierhut ML, Zhang VY, Kohler SJ, Tropp J, Hurd RE, Yen YF, et al. Cancer Res. 2008;68:8607–8615. doi: 10.1158/0008-5472.CAN-08-0749. [DOI] [PMC free article] [PubMed] [Google Scholar]
- 12.Gatenby RA, Gillies RJ. Nat Rev Cancer. 2004;4:891–899. doi: 10.1038/nrc1478. [DOI] [PubMed] [Google Scholar]
- 13.Terreno E, Botta M, Boniforte P, Bracco C, Milone L, Mondino B, Uggeri F, Aime S. Chem – Eur J. 2005;11:5531–5537. doi: 10.1002/chem.200500129. [DOI] [PubMed] [Google Scholar]
- 14.Aime S, Delli Castelli D, Fedeli F, Terreno E. J Am Chem Soc. 2002;124:9364–9365. doi: 10.1021/ja0264044. [DOI] [PubMed] [Google Scholar]
- 15.Dixon WT, Ren J, Lubag AJM, Ratnakar J, Vinogradov E, Hancu I, Lenkinski RE, Sherry AD. Magn Reson Med. 2010;63:625–632. doi: 10.1002/mrm.22242. [DOI] [PMC free article] [PubMed] [Google Scholar]
- 16.Aime S, Botta M, Fasano M, Terreno E. Acc Chem Res. 1999;32:941–949. [Google Scholar]
- 17.Terreno E, Botta M, Fedeli F, Mondino B, Milone L, Aime S. Inorg Chem. 2003;42:4891–4897. doi: 10.1021/ic034321y. [DOI] [PubMed] [Google Scholar]
- 18.Zhang S, Winter P, Wu K, Sherry AD. J Am Chem Soc. 2001;123:1517–1518. doi: 10.1021/ja005820q. [DOI] [PubMed] [Google Scholar]
- 19.Bruce JI, Dickins RS, Govenlock LJ, Gunnlaugsson T, Lopinski S, Lowe MP, Parker D, Peacock RD, Perry JJB, Aime S, et al. J Am Chem Soc. 2000;122:9674–9684. [Google Scholar]
- 20.Al-Saffar NMS, Marshall LV, Jackson LE, Balarajah G, Eykyn TR, Agliano A, Clarke PA, Jones C, Workman P, Pearson ADJ, et al. PLoS ONE. 2014;9:e103835. doi: 10.1371/journal.pone.0103835. [DOI] [PMC free article] [PubMed] [Google Scholar]
- 21.Yang X, Song X, Li Y, Liu G, Ray Banerjee S, Pomper MG, McMahon MT. Angew Chem Int Ed. 2013;52:8116–8119. doi: 10.1002/anie.201302764. [DOI] [PMC free article] [PubMed] [Google Scholar]
- 22.Sano K, Nakajima T, Choyke PL, Kobayashi H. ACS Nano. 2013;7:717–724. doi: 10.1021/nn305011p. [DOI] [PMC free article] [PubMed] [Google Scholar]
Associated Data
This section collects any data citations, data availability statements, or supplementary materials included in this article.


