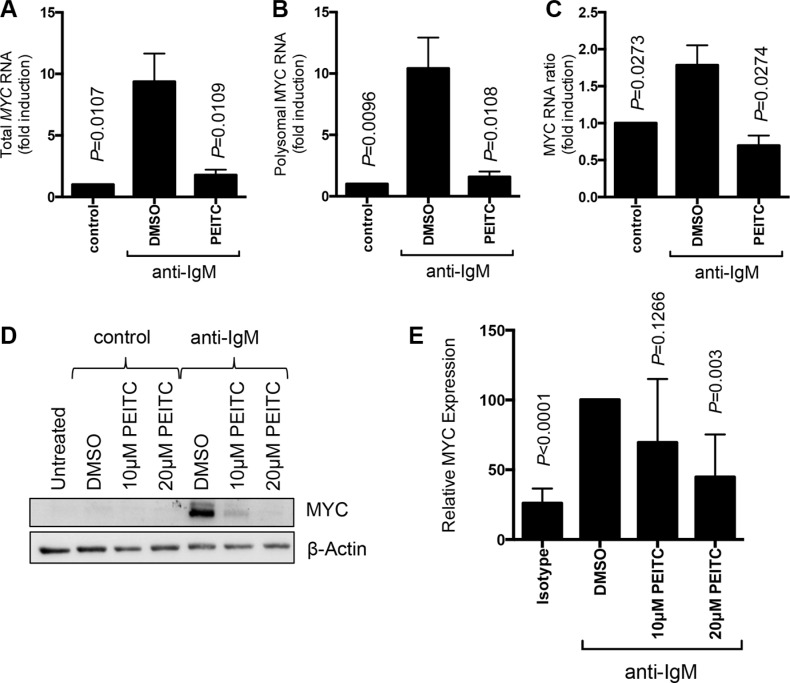
Figure 5. Effect of PEITC on MYC regulation.
CLL cells (n = 7) were stimulated with anti-IgM or control antibody. After 17 hours, cells were treated with PEITC (10 μM) or DMSO as a solvent control for an additional 5 hours. (A–C) Analysis of monosome/polysome associated MYC mRNA using Q-PCR. Graphs show quantitation of (A) total MYC mRNA (monosomal plus polysomal); (B) polysome-associated MYC mRNA; and (C) polysome/monosome ratio for MYC mRNA. Graphs show means (± SEM) with values with control antibody treated cells set to 1.0. Statistical significance of differences between indicated groups are shown (Student's t-test). (D) Analysis of MYC protein expression by immunoblotting and (E) quantification.

