
Figure 2. Proteomic analysis of exosomes isolated from 67NR and 4T1 exosomes.
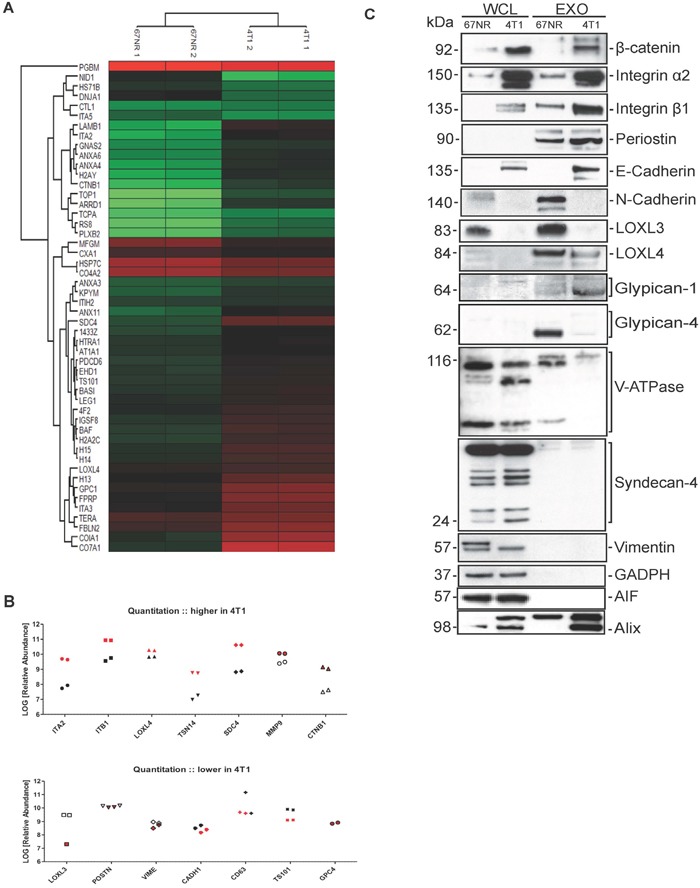
A. Heat map of hierarchical clustering of 50 proteins that were identified with the highest number of peptides, in 67NR and 4T1 exosomes. Red color is corresponding to relatively high abundance of proteins, green relatively low and black color represents equal expression of proteins. B. Quantification of proteins that were enriched in 4T1 exosomes (upper graph) and enriched in 67NR but found in low levels in 4T1 exosomes (lower graph). C. Validation of proteomics for 67NR and 4T1 exosomes: western blot analysis for 67NR and 4T1 cells and exosomes probed for the indicated proteins. GADPH used as loading control for the cells and AIF as a quality control for the exosome isolation. Equal amount of proteins (10-15μg) was loaded in each Western (n=2).