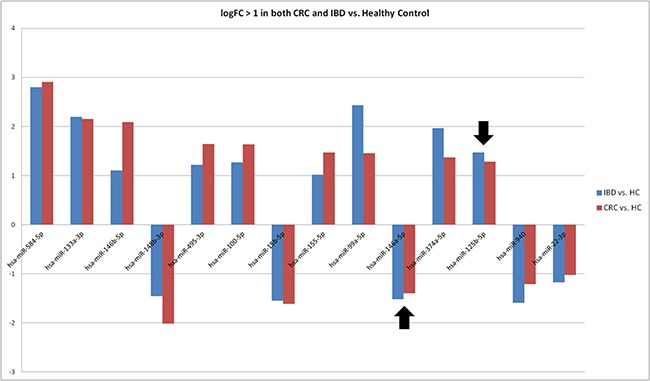
Figure 4. Consistent differential expression of 14 miRNAs in EV-Enriched sera fractions of both CRC and IBD.

This figure demonstrates consistent overexpression of nine miRNAs and low expression of five miRNAs revealed in nuclease pre-treated, EV-enriched serum pools of CRC and IBD compared to a healthy control pool. The black arrows point to the elevated expression of miR-125b-5p and reduced expression of miR-146a.
