To the Editor
The Composite Asthma Severity Index (CASI) is a comprehensive severity scale combining multiple facets of asthma severity: impairment, risk, and treatment 1 The CASI score, which was developed as a research tool for intervention studies, ranges from 0 to 20 points, with higher scores indicating higher levels of severity, and includes 5 domains: day symptoms and albuterol use, night symptoms and albuterol use, controller treatment, lung function measures, and exacerbations. This report expands upon the introduction of the CASI score in Wildfire et al by determining risk levels, the minimally important difference (MID), and the suggested effect size for the score. Information about CASI, including study forms and an online calculator, is available at www.asthmaseverity.org.
This report utilizes data from the Asthma Phenotypes in the Inner City (APIC) study to describe the relationship between CASI and the global clinician assessment of severity, establish cut-points of the CASI score discriminating low versus medium or high asthma severity, and to provide preliminary estimates of the minimal important difference (MID) and a treatment effect for the CASI. Data from the Inner City Anti-IgE Therapy for Asthma Study (ICATA), a double blind randomized clinical trial evaluating the impact of the addition of omalizumab to guidelines-based therapy, are used to evaluate the MID and effect size developed.2
The minimal important difference (MID),3,4 which is defined as the smallest difference in a measure that is considered clinically meaningful, can vary depending on the context. The MID presented in this report refers to an individual's change over time. In addition, we present the difference between two populations as the minimal important effect size, which serves as a benchmark for a treatment effect in a study.
The APIC study5-7 was an observational study designed to identify determinants of asthma severity. During the APIC study, children ages 6 to 17 years, with a wide range of asthma severity, received standardized guidelines-directed asthma treatment for one year. At screening and the final visit, the CASI score was calculated and the children were assigned numeric (0-100) and categorical (“low”, “medium” or “high”) global severity assessments by study clinicians.
We examined the relationships between CASI and the numeric (0-100) clinician assessment at screening to establish CASI risk levels and an MID for CASI. Traditional measures of risk and impairment, such as clinical and lung function measures, were not appropriate “gold standards” for the CASI, as it contains elements of both.
The mean CASI score at screening was 4.8 (SD 3.22); the maximum possible CASI score is 20. There was a strong relationship between CASI and the numeric (0-100) clinician assessment of severity (ρ=0.65, 95% CI=[0.60, 0.69]) indicating that any increase in CASI translates to an increase in clinician estimate of asthma severity. The categorical clinician assessment rated 294 participants (41%) as ‘low’ severity, 309 (43%) as ‘medium’ severity and 113 (16%) as ‘high’ severity at the screening visit.
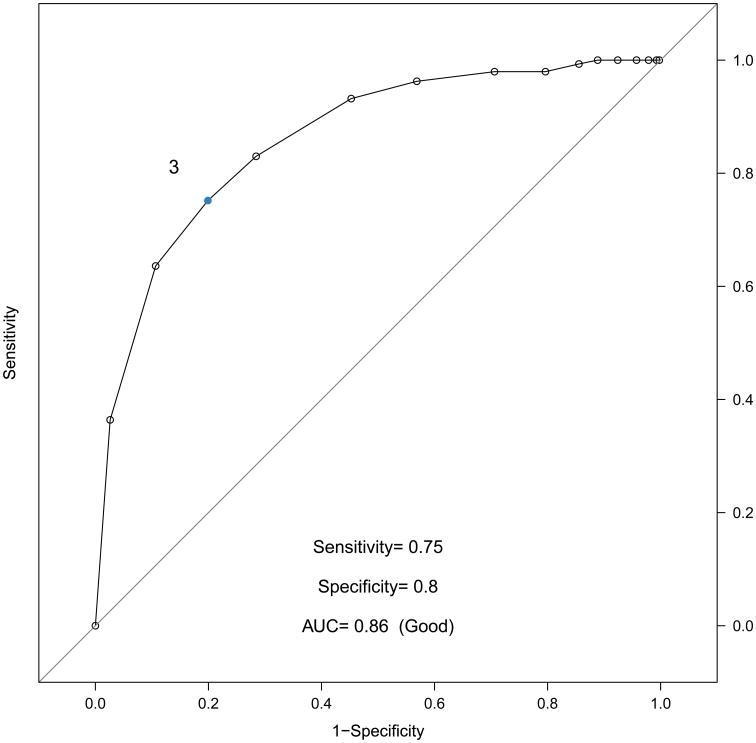
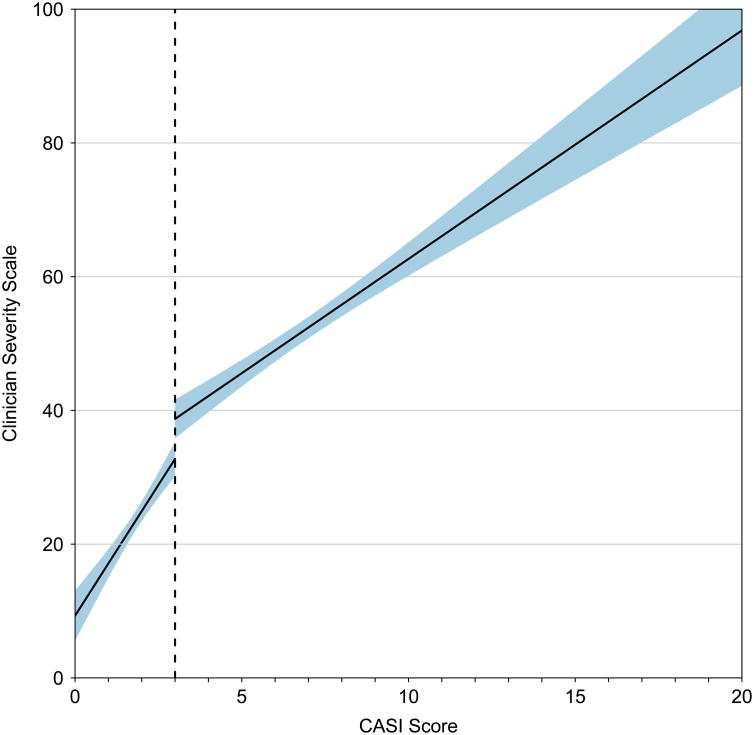
To establish CASI risk levels, we examined the relationship between CASI and the clinician categorical assessment of severity using receiver operator curve (ROC) analysis. Of the 294 low severity participants, 75% had CASI scores of 3 or lower, and a CASI score of 3 was found to be optimal to discriminate a low severity rating from medium or high (AUC=0.86, Figure 1, Panel A). The same optimal cut point of 3 was identified using data available for 557 participants from the final visit (data not shown). Similar ROC curves were created to discriminate between participants with medium and high categorical clinician assessments, but based on AUC, no recommended cut point was identified. Additionally, as a continuous score, the CASI is shown to have a high correlation with asthma severity, and increases in CASI values both above and below the established cut point of 3 are associated with significant increases in severity (Correlation with Clinician Assessment for CASI 0-3 = 0.37 [0.27, 0.46], CASI from 3-20, 0.47 [0.40,0.54], Figure 1 Panel B).
Figure 1.
Risk level for discriminating a low CASI score from medium or high CASI.
Panel A, Receiver operating curve for CASI vs. Clinician Assessment of Severity (dichotomized as low and medium/high). Optimal cut point of 3 (corresponding to low severity) is annotated. Panel B, Continuous relationship between CASI score and continuous Clinician Assessment of Asthma Severity. Optimal cut point is illustrated by dotted line. Linear relationship estimated separately for a CASI score of 0 to 3 and for a CASI of 3 to 20. Shaded interval represents a 95% confidence band.
The MID for CASI is informed by its design. CASI scores in each of the 5 domains were aligned with the NAEPP EPR3 Asthma Guidelines.8 As a result, a one-point change in CASI corresponds to either a one-point increase in the participant's asthma control level (for day symptoms/albuterol use, night symptoms/albuterol use, and lung function measure) or a change in medication (inhaled corticosteroids for the controller treatment domain, and prednisone for the Exacerbation domain). Therefore, a one-point difference in any domain constitutes a change that could be considered clinically significant, serving as a lower bound for the MID. To further define the MID, anchor-based analysis, a methodology for estimating the MID based on a clinical reference measure, was performed by categorizing the numeric clinician rating of severity into 10-point intervals [Table I]. Mean differences in CASI scores were calculated between adjacent anchor categories and yielded a MID of 0.9 with Hedges g-statistic of 0.36 (0.2 = small effect, 0.5 = medium effect, and 0.8 = large effect). The validity of 0.9 change was evaluated using data from the ICATA study, where 52% (98/189) of the participants in the treatment arm demonstrated a CASI decrease of 0.9 points between randomization and the end of the study, compared to only 40% (69/172) of participants in the placebo arm (Chi-sq p= 0.03). Because changes in CASI occur in no less than a one-point increment, we rounded this value to propose a MID of one CASI point.
Table I. Anchor-based approach to determining the MID for the CASI.
| Baseline Clinician Severity (Numeric rating) – 10 Cats | Absolute difference [95% CI] | Effect Size* [95% CI] |
|---|---|---|
| [0,10] vs [11,20] | 0.48 [0.00, 0.98] | 0.26 [0.01, 0.53] |
| [11,20] vs [21,30] | 1.19 [0.64, 1.75] | 0.57 [0.29, 0.85] |
| [21,30] vs [31, 40] | 1.13 [0.40, 1.83] | 0.49 [0.18, 0.80] |
| [31,40] vs [41,50] | 0.66 [-0.03, 1.37] | 0.25 [0.05, 0.56] |
| [41,50] vs [51,60] | 0.60 [-0.18, 1.42] | 0.22 [0.08, 0.53] |
| [51,60] vs [61,70] | 0.85 [-0.25, 1.94] | 0.31 [0.10, 0.72] |
| [61,70] vs [71,80] | 0.87 [-0.36, 2.01] | 0.27 [0.12, 0.67] |
| [71,80] vs [81,90] | 1.88 [0.02, 3.57] | 0.57 [0.01, 1.13] |
| [81,90] vs [91,100] | 1.65 [-1.20, 4.11] | 0.51 [0.64, 1.65] |
| 10 cats: Weighted Average | 0.90 | 0.36 |
Effect sizes were computed by using the Hedges g-statistic: 0.2 = small effect, 0.5 = medium effect, and 0.8 = large effect.
In order to determine the minimal important effect size, which is not limited to whole numbers as it represents the average of a population of individuals, a statistical simulation was performed using APIC data by creating a simulated placebo and active treatment group (n=250 for each). The simulation yielded a mean difference of 0.49 CASI points between 2 treatment arms (95% confidence interval [0.01,0.99]). In the ICATA study, participants in the treatment arm showed a significant improvement in CASI over participants in the placebo arm (0.67 points improvement, p<0.001). Additional details regarding this result, including methodology and estimates based on several population sizes, are available as an online supplement at https://github.com/RhoInc/CASI_MID.
More research in high-risk populations, to include larger numbers of participants, is needed to discriminate between the medium and high risk levels of asthma severity using the CASI score. Additionally, further research is needed to determine whether CASI and its associated risk levels differ in suburban or adult populations. Finally, APIC's observational design presents a limitation to the analysis; validation of the results using a true case-control population would be valuable.
Wildfire et al.1 demonstrated that the CASI was a better discriminator of treatment response than a symptoms-based outcome. The information provided in this report extends the utility of the CASI. A change in CASI score of one point or greater suggests a change in the individual's asthma severity. For defining asthma risk levels, a CASI score of 3 or less identifies an individual with mild asthma; however, this may oversimplify asthma severity since an increase in CASI represents increased severity both above and below the cut point. When using CASI in clinical studies a difference of 0.49 represents a minimally important effect size (difference between the two groups). CASI is free to use and sample forms and other resources are publicly available at www.asthmaseverity.org.
Acknowledgments
This project has been funded in whole or in part with Federal funds from the National Institute of Allergy and Infectious Diseases, National Institutes of Health, Department of Health and Human Services, under contract numbers HHSN272200900052C, HHSN272201000052I and 1UM1AI114271-01. Additional support was provided by the National Center for Research Resources, and National Center for Advancing Translational Sciences, National Institutes of Health, under grants NCRR/NIH UL1TR000451, UL1RR025780, UL1TR000075, UL1TR000154, UL1TR001082, UL1TR000077-04, UL1TR000040, UL1TR000150 and UL1TR001105. Glaxo SmithKline (GSK) provided Ventolin, Flovent, Advair and Flonase under a clinical trial agreement with NIH NIAID; GSK did not have a role in the development or approval of the protocol, conduct of the trial, data analysis, manuscript preparation, or the decision to submit for publication.
Footnotes
Publisher's Disclaimer: This is a PDF file of an unedited manuscript that has been accepted for publication. As a service to our customers we are providing this early version of the manuscript. The manuscript will undergo copyediting, typesetting, and review of the resulting proof before it is published in its final citable form. Please note that during the production process errors may be discovered which could affect the content, and all legal disclaimers that apply to the journal pertain.
References
- 1.Wildfire JJ, Gergen PJ, Sorkness CA, et al. Development and validation of the Composite Asthma Severity Index--an outcome measure for use in children and adolescents. J Allergy Clin Immunol. 2012;129:694–701. doi: 10.1016/j.jaci.2011.12.962. [DOI] [PMC free article] [PubMed] [Google Scholar]
- 2.Busse WW, Morgan WJ, Gergen PJ, et al. Randomized trial of omalizumab (anti-IgE) for asthma in inner-city children. N Engl J Med. 2011;364:1005–15. doi: 10.1056/NEJMoa1009705. [DOI] [PMC free article] [PubMed] [Google Scholar]
- 3.McGlothlin AE, Lewis RJ. Minimal clinically important difference: defining what really matters to patients. JAMA. 2014;312:1342–3. doi: 10.1001/jama.2014.13128. [DOI] [PubMed] [Google Scholar]
- 4.Schatz M, Kosinski M, Yarlas AS, Hanlon J, Watson ME, Jhingran P. The minimally important difference of the Asthma Control Test. J Allergy Clin Immunol. 2009;124:719–23 e1. doi: 10.1016/j.jaci.2009.06.053. [DOI] [PubMed] [Google Scholar]
- 5.Liu AH, Babineau DC, Krouse RZ, et al. Pathways through which asthma risk factors contribute to asthma severity in inner-city children. J Allergy Clin Immunol. 2016 Oct;138(4):1042–1050. doi: 10.1016/j.jaci.2016.06.060. [DOI] [PMC free article] [PubMed] [Google Scholar]
- 6.Pongracic JA, Krouse RZ, Babineau DC, et al. Distinguishing characteristics of Difficult-to-control asthma in inner-city children and adolescents. J Allergy Clin Immunol. 2016 Oct;138(4):1030–1041. doi: 10.1016/j.jaci.2016.06.059. [DOI] [PMC free article] [PubMed] [Google Scholar]
- 7.Zoratti EM, Krouse RZ, Babineau DC, et al. Asthma phenotypes in inner-city children. J Allergy Clin Immunol. 2016 Oct;138(4):1016–1029. doi: 10.1016/j.jaci.2016.06.061. [DOI] [PMC free article] [PubMed] [Google Scholar]
- 8.National Asthma E, Prevention P. Expert Panel Report 3 (EPR-3): Guidelines for the Diagnosis and Management of Asthma-Summary Report 2007. J Aller Clin Immunol. 2007;120:S94–138. doi: 10.1016/j.jaci.2007.09.043. [DOI] [PubMed] [Google Scholar]


