Abstract
Enzyme-free electrochemical sensors enable rapid, high sensitivity measurements without the limitations associated with enzyme reporters. However, the performance of non-enzymatic electrochemical sensors tends to suffer from slow electrode kinetics and poor signal stability. We report a new enzyme-free electrochemical immunosensor based on a unique competitive detection scheme using methylene blue (MB), hydrazine and platinum nanoparticles (Pt NPs). This scheme is coupled with a robust immunosandwich format employing a MB-labelled detection antibody as a non-enzymatic reporter. In the presence of the target antigen, surface-immobilized MB consumes interfacial hydrazine thereby diminishing the electro-oxidation of hydrazine on Pt NPs. Thus, the concentration of the antigen is directly proportional to the reduction in the electrochemical signal. For proof-of-concept, this sensor was used to detect Plasmodium falciparum histidine-rich protein 2 (PfHRP2), an important malaria biomarker, in unadulterated human saliva samples. Chronocoulometric measurements showed that this platform exhibits pM-range sensitivity, high specificity and good reproducibility, making it well suited for many biosensing applications including noninvasive diagnostic testing.
Keywords: Enzyme-free, electrochemical, immunosensor, methylene blue, hydrazine, Pt nanoparticles
Graphical abstract
1. Introduction
Recently, there has been growing interest in the development of enzyme-free electrochemical sensors due to their potential for enhanced stability and reproducibility compared with enzymatic electrochemical sensors. Much effort in this area has focused on the detection of hydrogen peroxide (H2O2), glucose and uric acid due to the clinical relevance of these analytes (Chen et al. 2014; Chen et al. 2013; Chen et al. 2013). Research has also been carried out to develop enzyme-free electrochemical immunosensors for the detection of protein biomarkers (Tang et al. 2015). While current enzyme-free sensors can offer high sensitivity measurements, many are based on electrochemical reactions that tend to suffer from sluggish electrode kinetics or poor signal stability (Wang et al. 2013; Si et al. 2013).
The electro-oxidation of hydrazine is a well-studied reaction that has been utilized for various applications including fuel cells and biosensors (Sanabria-Chinchilla et al. 2011; Finkelstein et al. 2016; Rahmana et al. 2005). The electroactivity of hydrazine oxidation can be enhanced through the addition of electrocatalysts such as gold, silver or platinum (Dudin et al. 2011; Ojani et al. 2015; Koçak et al. 2016). Of these metals, platinum (Pt) offers excellent stability and fast reaction kinetics (Tiwari et al. 2013). The oxidation of hydrazine on Pt is a faradaic reaction which generates an electrochemical current:
| (1) |
In the presence of oxygen, a non-faradaic (no current generation) side reaction takes place between hydrazine and aerial oxygen on the Pt surface resulting in the decomposition of hydrazine into N2 and H2O (Chen et al. 2015):
| (2) |
As the interfacial hydrazine is consumed, the oxidation current decreases accordingly. Aldous et al. further reported that platinum oxide (PtO2) plays an important role in hydrazine electro-oxidation where the reaction of hydrazine with PtO2 occurs layer-by-layer and results in a time-dependent deactivation of Pt (Aldous et al. 2011).
The fast electro-oxidation of hydrazine on Pt makes it an excellent candidate for electrochemical biosensors requiring a rapid response. Several groups have demonstrated electrochemical DNA sensors using hydrazine as a catalyst and Pt NPs as a label (Shiddiky et al. 2007; Kwon et al. 2012). While capable of rapid measurements, these sensors require complicated detection protocols or lack the sensitivity needed for detection in raw biological samples. Others have developed enzyme-free DNA sensors using methylene blue (MB) as a redox indicator and hydrazine as a substrate (Zhua et al. 2006; Yu et al. 2013; Aligrant et al. 2015). However, these methods exhibit lower signal-to-background ratios and longer detection times compared with biosensors utilizing only hydrazine and Pt. While the reduction of MB using various transition metals has been reported (Jana et al. 2000; Ganapuram et al. 2015), the effects of MB reduction on the electro-oxidation of hydrazine in the presence of Pt has yet to be studied or utilized for biosensing purposes.
In this work, a new enzyme-free immunosensor was developed based on a unique, competitive electrochemical scheme between MB, hydrazine and Pt nanoparticles (NPs). We are the first to apply this unique scheme for high sensitivity analytical measurements of protein biomarkers. This biosensor employs a robust immunosandwich format where the capture antibody is immobilized on an ITO electrode and the detection antibody is labelled with MB. In the absence of the target antigen, hydrazine is rapidly electro-oxidized on Pt NPs generating a high electrochemical signal. In the event of antigen-antibody binding, interfacial hydrazine is consumed by surface-immobilized MB in a non-faradaic side reaction which decreases the electrochemical current. This detection scheme offers several advantages including rapid electrokinetics, high sensitivity, and good reproducibility. Furthermore, this sensor offers excellent detection performance even in raw biofluid samples with minimal interference effects.
2. Experimental
2.1. Biochemicals and Reagents
(3-Aminopropyl) triethoxysilane (APTES), glutaraldehyde, ethanolamine, bovine serum albumin (BSA), hydrazine monohydrate, chloroplatinic acid, ammonium hydroxide (NH4OH), hydrogen peroxide (H2O2), sodium citrate tribasic dihydrate, ascorbic acid, phosphate-buffered saline (PBS, pH 7.4) and all reagents for buffer solutions were obtained from Sigma-Aldrich (St. Louis, MO). All buffer solutions were prepared using (deionized) DI water (18.3 MΩ-cm−1) generated using a Thermo Fischer Scientific Smart2Pure water purification system. A PBS-BSA solution was prepared by dissolving BSA 1% (w/v) in PBS. Mouse monoclonal anti-PfHRP2 IgM (capture antibody) and mouse monoclonal anti-PfHRP2 IgG (detection antibody) were purchased from ICL, Inc. (Portland, OR). Recombinant PfHRP2 antigen and recombinant PfLDH antigen were purchased from CTK Biotech. (San Diego, CA). Methylene blue (MB) succinimidyl ester was purchased from Biosearch Technologies Inc. (Petaluma, CA). MB-conjugated anti-PfHRP2 IgG was prepared by coupling the amine groups of IgG and active ester group of MB (see Supporting Information) and stored at 4°C for short-term (≤ 4 weeks) storage and −20°C for long-term (>1 month) storage.
2.2. Preparation and Characterization of Pt NPs
Citrate-stabilized Pt NPs were prepared by ascorbic acid reduction as previously reported (Huang et al. 2005) with minor modifications. Briefly, 1.3 mL of 5% H2PtCl6-aged solution was added to 68 mL of DI water and stirred at 80°C. 20 mL of 1% aqueous sodium citrate solution (fresh stock) was slowly dripped into the H2PtCl6 solution, and the mixture was stirred for 10 min. 10.7 mL of the 0.1 M ascorbic acid solution was added to the final mixture and stirred for 20 min at 80°C. Transmission electron microscopy (TEM) images of synthesized Pt NPs were obtained using a JEOL JEM-2200FS electron microscope (Peabody, MA) operated at 200 kV. Dynamic light scattering (DLS) measurements of Pt NPs in DI water (0.5% w/v) were carried out using a Zetasizer Nano (Malvern Instruments, UK).
2.3. Sensor Preparation
Electrodes were fabricated using low electrocatalytic indium tin oxide (ITO) on glass and prepared as previously reported (Wang et al. 2013; Chua et al. 2009; Aziz et al. 2008) with minor modifications. Briefly, ITO-coated glass was cut into 1 cm × 2 cm pieces and immersed in a solution of 1:1:5 H2O2 (30%), NH4OH (30%) and H2O (v/v/v) at 70°C for 90 min to form surface hydroxyl groups, and dried under a stream of purified N2 gas. Hydroxylated electrodes were then immersed in 2% (v/v) APTES in anhydrous toluene for 1 hr at room temperature (RT) to form a silane monolayer, followed by subsequent rinsing in anhydrous toluene, methanol, and DI water. Amine-functionalized electrodes were then incubated in a 10% aqueous glutaraldehyde solution for 30 min at RT, rinsed in DI water, dried using N2 gas and stored in a desiccator (30% relative humidity) prior to protein immobilization.
2.4. Protein Immobilization
70 μL of PBS (pH 7.4) containing 100 μg/mL of anti-PfHRP2 IgM was dispensed onto APTES-glutaraldehyde modified electrodes for 1 hr at RT followed by thoroughly rinsing with DI water and drying with N2 gas. A 10 mM ethanolamine-hydrochloric acid (HCl) solution (pH 8.8) was incubated on the surface for 30 min at RT to deactivate and block the electrode surface from nonspecific binding. The electrodes were then washed twice with PBS and stored at 4°C for up to 2 weeks prior to experiments. To characterize the electrode surface after protein immobilization, atomic force microscopy (AFM) was performed on the electrode to observe the changes in surface morphology as a result of protein binding (Fig. S2). AFM scans were performed under tapping mode in air using a Cypher S atomic force microscope (Asylum Research, Santa Barbara, CA). Samples were imaged at a constant force of 0.5 N/m, scan rate of 1 Hz and scan size of 2 μm × 2 μm. The images were processed and analyzed using Igor Pro software.
2.5. Experimental Setup
Cyclic voltammetry and chronocoulometry were performed in a Teflon electrochemical cell at RT using a 620A potentiostat (CH Instruments, Austin, TX). The cell was comprised of the ITO working electrode, an Ag/AgCl (3 M KCl) reference electrode (CH Instruments), and a Pt counter electrode (CH Instruments). Hydrazine/Pt NP substrates were prepared by combining 100 μL of PBS with 50 mM of hydrazine and 2 μL of DI water containing 0.5% (w/v) Pt NPs. The final concentrations of hydrazine and Pt NPs were 5 mM and 0.001% (w/v) respectively. All substrate solutions were freshly prepared and used immediately for measurements.
2.6. Electrochemical Measurements
Samples were prepared by serially diluting PfHRP2 antigen in PBS or unadulterated human saliva. Saliva was collected from healthy volunteers using a passive drool method and used without further purification. 70 μL of spiked PBS or saliva was dispensed onto the ITO electrode and incubated for 30 min at RT followed by washing in PBS. Next, 70 μL of PBS containing 10 μg/mL of MB-labelled anti-PfHRP2 IgG was dispensed onto the electrode, incubated for 30 min at RT and washed twice with PBS. The working electrode was inserted into the electrochemical cell, 1 mL of substrate was injected and incubated for 5 min followed by the application of a 0.05 V bias potential (vs Ag/AgCl).
3. Results and Discussion
3.1 Characterization of Pt NPs
Studies were performed to briefly characterize the Pt NPs. TEM images (Fig. 1a) were obtained to observe the morphology of the synthesized NPs which show that they are uniform in size and exhibit negligible aggregation in DI water. DLS measurements of the NP solution were performed to obtain a size distribution profile (Fig. 1b) of the NPs which range from 15 – 100 nm in diameter (polydispersity index of 0.217) with an average value of 31.2 nm.
Fig. 1.
(a) TEM image of synthesized Pt NPs. Scale bar, 50 nm. Inset shows magnified view of a single Pt NP. Scale bar, 5 nm. (b) Size distribution profile of Pt NPs in DI water (0.5% w/v) obtained from dynamic light scattering measurements.
3.2. Description of the Detection Scheme
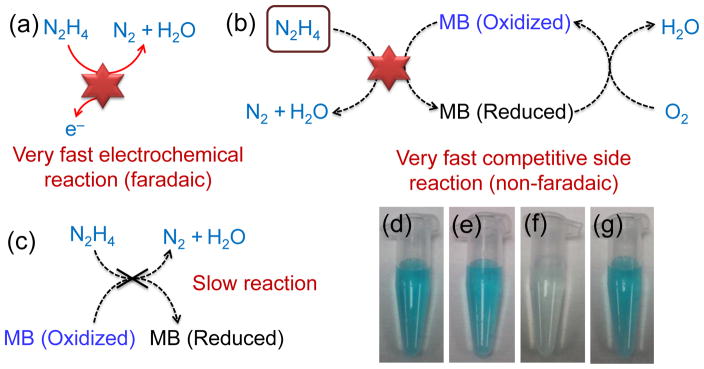
Illustrations of the electrochemical reactions involved in this detection scheme are shown in Fig. 2. The electro-oxidation of hydrazine on Pt NPs generates a large electrochemical current which is directly proportional to the hydrazine concentration (Fig. 2a). In the presence of MB, a non-faradaic, competitive side reaction takes place where MB is reduced and hydrazine decomposes into N2 and H2O (Fig. 2b). This side reaction is very fast (~msec) and consumes interfacial hydrazine which decreases the overall amount available for the faradaic reaction between hydrazine and Pt. As a result, the electrochemical signal due to electro-oxidation of hydrazine is diminished. The reduction of MB in hydrazine only occurs in the presence of Pt; in the absence of Pt, the substrate exhibits a slow reaction (Fig. 2c). The fast reaction between MB, hydrazine and Pt NPs can be readily visualized where the reduction of MB results in an observable color change from blue (Fig. 2e) to clear (Fig. 2f) within a fraction of a second. Overtime, O2 dissolved in the solution, as well as residual oxides or chemisorbed O2 on the Pt NPs, re-oxidizes the MB causing the color of solution to change back to blue (Fig. 2g). The re-oxidation of MB occurs gradually (~15 min) which ensures that the measured electrochemical signal is strictly due to MB-induced oxidation of interfacial hydrazine and not the oxidation of reduced MB. In contrast, the substrate containing only MB and hydrazine remains blue (Fig. 2d).
Fig. 2.
Schematic illustrations of relevant electrochemical reactions: (a) electrocatalytic reaction of hydrazine on Pt NPs, (b) a very fast competitive side reaction between MB and hydrazine on Pt NPs, and (c) slow reaction between hydrazine and MB. Photographs of solutions containing (d) 10 μM MB and 5 mM hydrazine in 1 mL of PBS, (e) 10 μM MB and 0.001% (w/v) Pt NPs in 1 mL of PBS, (f) 10 μM MB, 0.001% (w/v) Pt NPs, and 5 mM hydrazine in 1 mL of PBS, and (g) 10 μM MB, 0.001% (w/v) Pt NPs, and 5 mM hydrazine in 1 mL of PBS after 15 min in air.
3.3. Electrochemical Study of the Detection Scheme
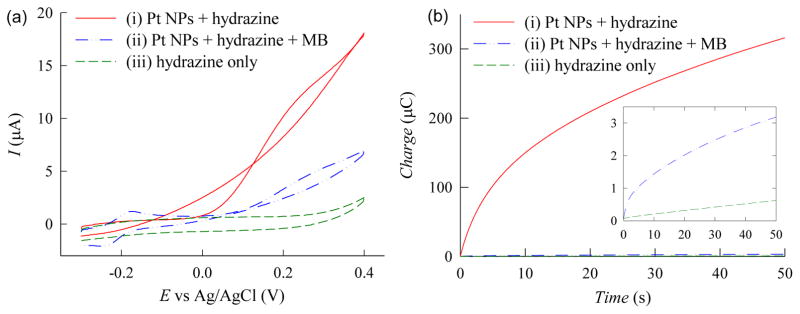
Experiments were performed to briefly investigate the electrokinetics of this detection scheme. For these studies, cyclic voltammograms of hydrazine solutions containing Pt NPs or Pt NPs and MB were obtained using unmodified ITO electrodes to ensure there were no effects due to any other biochemicals (e.g. electrode modifying agents or antibodies). As shown in curve iii of Fig. 3a, the electro-oxidation of hydrazine generated a very low voltammetric current due to its slow inner sphere reaction in the absence of an electrocatalyst. In contrast, the hydrazine solution containing Pt NPs (0.001% w/v) generated a substantial voltammetric current (curve i of Fig. 3a), resulting from the catalytic effect of the Pt NPs. When MB was included in the hydrazine/Pt NP solution, the resulting voltammetric current was dramatically decreased (curve ii of Fig. 3a) due to the non-faradaic reaction between MB and hydrazine. These results further support the notion that hydrazine is consumed in the side reaction which was demonstrated via color change (Fig. 2e, f).
Fig. 3.
(a) Cyclic voltammograms of PBS solutions containing (i) 5 mM hydrazine and 0.001% (w/v) Pt NPs, (ii) 5 mM hydrazine, 0.001% (w/v) Pt NPs, and 10 μM MB, and (iii) 5 mM hydrazine only. Voltammograms are recorded at a scan rate of 50 mV/s using unmodified ITO electrodes. (b) Chronocoulograms of PBS solutions containing (i) 5 mM hydrazine and 0.001% (w/v) Pt NPs, (ii) 5 mM hydrazine, 0.001% (w/v) Pt NPs, and 10 μM MB, and (iii) 5 mM hydrazine only. Inset shows magnified view of the chronocoulograms for curves ii and iii. Chronocoulograms are recorded at 0.05 V using unmodified ITO electrodes.
To further validate these findings, experiments were repeated using these substrates to monitor the oxidation current via chronocoulometry (Fig. 3b). As shown in curve iii of Fig. 3b, a negligible chronocoulometric signal was generated for the solution containing only hydrazine. In contrast, the hydrazine solution containing Pt NPs generated a significantly (525×) larger chronocoulometric signal confirming the rapid inner sphere reaction of hydrazine on the Pt NPs (curve i of Fig. 3b). When MB was included in the hydrazine/Pt NP solution, the chronocoulometric response was significantly diminished (curve ii of Fig. 3b), reconfirming the rapid consumption of interfacial hydrazine by MB via a non-faradaic side reaction.
3.4. Assay Optimization
Studies were carried out to optimize several important assay parameters. We first investigated the composition of the substrate solution since the concentrations of hydrazine and Pt NPs have a significant influence on the rate and magnitude of the catalytic reaction. Specifically, the concentrations of both species were optimized so that a significant electrochemical signal was generated while minimizing the background level. Chronocoulometric measurements were performed using solutions containing varying concentrations of hydrazine and Pt NPs with and without MB. The chronocoulometric charges (taken at 50 sec from chronocoulograms) are plotted in Fig. S3. These results indicate that the highest background-to-signal ratios (BSRs) are obtained with solutions containing 5 mM of hydrazine and 0.001% (w/v) of Pt NPs, respectively. Next, we optimized the applied bias potential by performing chronocoulometric measurements of hydrazine and Pt NP solutions with and without MB at varying potentials (Fig. S4a). For the hydrazine/Pt NP solution, increasing the potential resulted in the chronocoulometric charge to steadily increase whereas the solution with only MB generated significant signals at potentials ≥ 0.1 V. Based on these findings, 0.05 V resulted in the optimal BSR while offering a low voltage to minimize any interference effects in biofluid samples. The last parameter that was optimized was the substrate incubation time. Fig. S4b shows chronocoulometric charges for hydrazine/Pt NP solutions with and without MB at varying incubation times. The chronocoulometric signal for the MB-containing solution dramatically decreased when the substrate was incubated for a few min; however, there was not much enhancement in the BSR with incubation periods ≥ 10 min. Therefore, a 5 min incubation period was selected since it offered the highest BSR and shortest measurement duration.
3.5. PfHRP2 Measurements in PBS
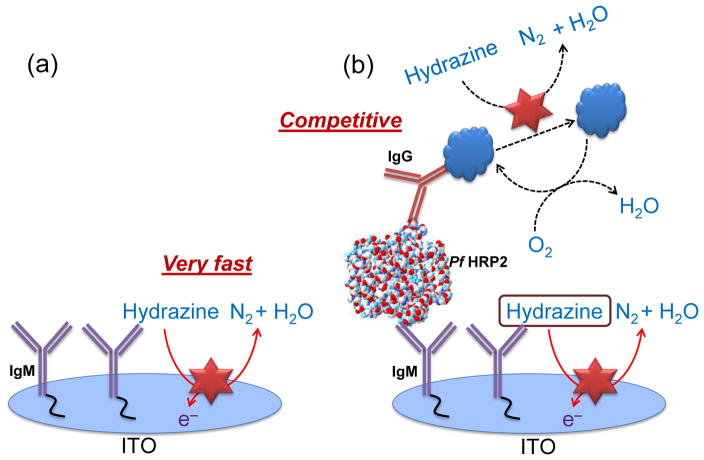
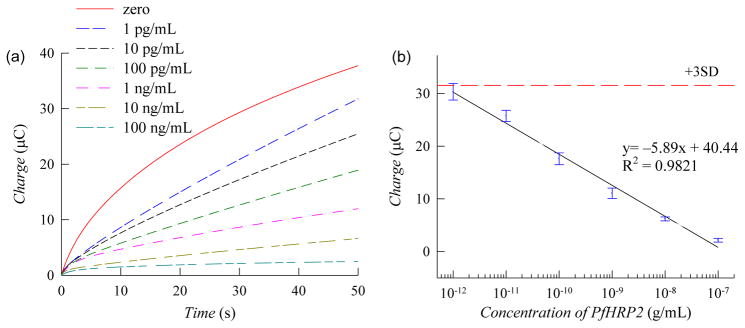
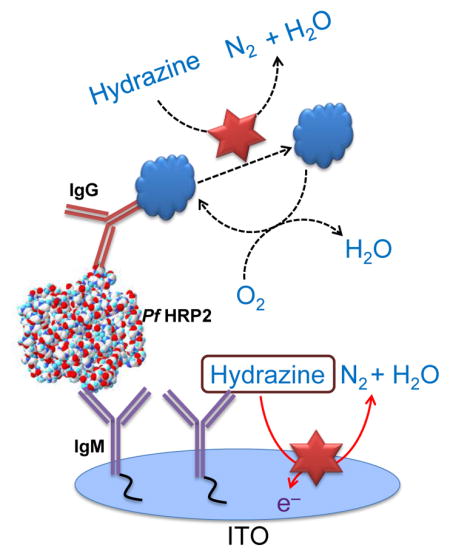
An illustration of the detection scheme incorporating the immunoassay for PfHRP2 detection is shown in Scheme 1. In the absence of the target antigen, hydrazine is rapidly electro-oxidized on the Pt NPs generating a significant electrochemical signal (Scheme 1a). In the presence of PfHRP2 antigen, surface-immobilized MB generates a competitive side reaction which consumes the interfacial hydrazine, thereby decreasing the electrochemical signal (Scheme 1b). To validate this sensor for protein detection, measurements were first performed to detect PfHRP2 in PBS. Chronocoulometric response profiles from 1 pg/mL to 100 ng/mL are shown in Fig. 4a. A calibration plot of the chronocoulometric charge at 50 sec is shown in Fig. 4b where each data point represents three separate measurements using new ITO electrodes. Based on these results, this assay exhibits a highly linear response from 1 pg/mL to 100 ng/mL (R2 = 0.9821) and a lower limit of detection of 1 pg/mL which is 15× lower than previously reported enzyme-free immunosensors (Wu et al. 2013). Additionally, the low standard deviations (SDs) (< 8%) of each data point demonstrates the high accuracy and reproducibility of this biosensor.
Scheme 1.
Schematic representation of the electrochemical immunosensor in the absence (a) and presence (b) of the target antigen with the MB-labelled detection antibody.
Fig. 4.
(a) Chronocoulograms of PBS spiked with PfHRP2 recorded at 0.05 V (vs Ag/AgCl). (b) Calibration plot based on chronocoulometric charges at 50 sec from the response profile in panel a. Each data point represents the mean ± SD of three separate measurements using new electrodes. The dashed line corresponds to 3× the charge SD at zero concentration.
3.6. PfHRP2 Measurements in Saliva
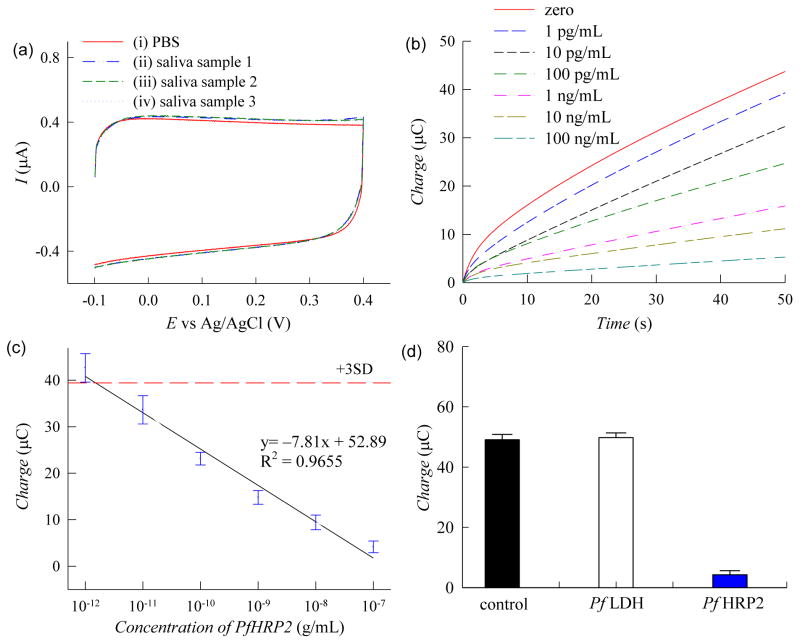
Experiments were also performed to detect PfHRP2 in unadulterated human saliva samples to evaluate the clinical utility of this assay for noninvasive diagnostic testing. Studies were first carried out to investigate the electroactivity of human saliva. Cyclic voltammetry was performed on unmodified ITO electrodes using PBS or unadulterated saliva. As shown in Fig. 5a, cyclic voltammograms generated from the saliva samples (curves ii-iv) exhibited a similar response profile as that generated from PBS (curve i) with a slightly higher oxidation current. The marginal difference in the electrochemical signal in saliva is likely due to the electro-oxidation of chemical constituents in saliva (e.g. ascorbic acid, urea, glucose) which is consistent with previous reports on the electroactivity of biofluids (Dutta et al. 2014; Dutta et al. 2015; Wang 2001). These results also show that the voltammograms of saliva from three volunteers are nearly identical suggesting that differences in the detection signal due to person-to-person variations are negligible. Next, chronocoulometric measurements were performed using saliva samples spiked with PfHRP2 from 1 pg/mL to 100 ng/mL (Fig. 5b). The chronocoulometric signals in saliva were ~15% higher than in PBS due to the chemical constituents in saliva, which is consistent with the cyclic voltommetry measurements (Fig. 5a). However, this effect was minimized by using a very low applied potential (0.05 V vs Ag/AgCl). A calibration plot of the chronocoulometric charge at 50 sec is shown in Fig. 5c which shows that this saliva-based assay exhibits a linear response from 1 pg/mL to 100 ng/mL (R2 = 0.9655). Similar to PBS, this PfHRP2 assay exhibits a very low limit of detection of 2.2 pg/mL in unadulterated saliva, which is 30× lower than previously reported electrochemical measurements of protein biomarker in raw saliva (Torrente-Rodríguez et al. 2016). Furthermore, the detection range of this sensor is within the clinical concentrations found in patients with P. falciparum infection (Wilson et al. 2008; Fung et al. 2012). This assay also exhibits highly accurate and reproducible measurements with SDs of each data point < 12%. The PfHRP2 concentration in an unknown saliva sample could be obtained by comparing the electrochemical measurements with the calibration plot in Fig. 5c since there is negligible variation in saliva among different individuals.
Fig. 5.
(a) Cyclic voltammograms of (i) PBS with 0.001% (w/v) Pt NPs, and (ii-iv) unadulterated saliva samples from three volunteers with 0.001% (w/v) Pt NPs. Measurements were recorded at a scan rate of 50 mV/s using unmodified electrodes. (b) Chronocoulograms of human saliva spiked with PfHRP2 recorded at 0.05 V (vs Ag/AgCl). (c) Calibration plot based on chronocoulometric charges at 50 sec from the response profile in panel b. Each data point represents the mean ± SD of three separate measurements using new electrodes. The dashed line corresponds to 3× the charge SD at zero concentration. (d) Chronocoulometric charges of PfHRP2 (100 ng/mL) and PfLDH (100 ng/mL) in saliva and non-spiked saliva (control). Signals were taken at 50 sec from chronocoulograms obtained at 0.05 V. Each bar represents the mean ± SD of three separate measurements using new electrodes.
We briefly studied the specificity of our electrochemical assay by performing chronocoulometric measurements of saliva samples spiked with Plasmodium falciparum lactate dehydrogenase (PfLDH), another common biomarker of P. falciparum infection. As shown in Fig. 5d, the detection signal of PfLDH was similar to that of the non-spiked saliva sample indicating that the PfLDH antigen does not bind to the PfHRP2 antibodies used in this assay. In contrast, the detection signal for PfHRP2 was significantly lower and consistent with our prior PfHRP2 data. These results suggest that our assay is highly specific toward PfHRP2 and will not interfere with other protein biomarkers that may be present in clinical saliva specimens.
4. Conclusions
We report a new enzyme-free electrochemical immunosensor based on a unique detection scheme utilizing MB as a non-enzymatic reporter and a hydrazine/Pt NP substrate. Experiments to study the electrokinetics of this scheme for electrochemical measurements revealed that MB significantly diminishes the electro-oxidation of hydrazine on Pt NPs through the consumption of interfacial hydrazine in a competitive, non-faradaic side reaction. Further studies were performed to optimize several key assay parameters including the composition of the substrate solution, applied bias potential and substrate incubation time. Based on these results, a bias potential of 0.05 V and incubation time of 5 min resulted in the highest background-to-signal ratio while minimizing interference effects. Proof-of-concept was carried out by using this biosensor for quantitative measurements of PfHRP2 in PBS and human saliva samples, which could be detected at concentrations down to 1 pg/mL and 2.2 pg/mL, respectively. The capacity for high sensitivity protein measurements in unadulterated saliva samples makes this biosensor very promising for noninvasive diagnostic testing. Furthermore, this assay can be adapted to detect other protein biomarkers enhancing its utility for the diagnosis of other important diseases.
Supplementary Material
Highlights.
A new enzyme-free biosensor for rapid protein quantification was developed.
A unique detection scheme using methylene blue, hydrazine and Pt NPs was validated.
This assay exhibits pM-range sensitivity, and high specificity and reproducibility.
A lower limit of detection of 2.2 pg/mL was obtained in unadulterated human saliva.
Acknowledgments
This work was funded by the National Institutes of Health (R01 AI113257 and R01 GM100908). We thank Shatadru Chakravarty for his assistance with DLS measurements and Xudong Fan for his assistance with TEM measurements.
Footnotes
Publisher's Disclaimer: This is a PDF file of an unedited manuscript that has been accepted for publication. As a service to our customers we are providing this early version of the manuscript. The manuscript will undergo copyediting, typesetting, and review of the resulting proof before it is published in its final citable form. Please note that during the production process errors may be discovered which could affect the content, and all legal disclaimers that apply to the journal pertain.
References
- Aldous L, Compton RG. Phys Chem Chem Phys. 2011;13:5279–5287. doi: 10.1039/c0cp02261f. [DOI] [PubMed] [Google Scholar]
- Alligrant TM, Dasari R, Stevenson KJ, Crooks RM. Langmuir. 2015;31:11724–11733. doi: 10.1021/acs.langmuir.5b02620. [DOI] [PubMed] [Google Scholar]
- Aziz MA, Patra S, Yang H. Chem Commun. 2008:4607–4609. doi: 10.1039/b808026g. [DOI] [PubMed] [Google Scholar]
- Chen C, Xie Q, Yang D, Xiao H, Fu Y, Tan Y, Yao S. RSC Adv. 2013;3:4473–4491. [Google Scholar]
- Chen CH, Jacobse L, McKelvey K, Lai SCS, Koper MTM, Unwin PR. Anal Chem. 2015;87:5782–5789. doi: 10.1021/acs.analchem.5b00988. [DOI] [PubMed] [Google Scholar]
- Chen S, Yuan R, Chai Y, Hu F. Microchim Acta. 2013;180:15–32. [Google Scholar]
- Chen X, Wu G, Cai Z, Oyama M, Chen X. Microchim Acta. 2014;181:689–705. [Google Scholar]
- Chua JH, Chee RE, Agarwal A, Wong SM, Zhang GJ. Anal Chem. 2009;81:6266–6271. doi: 10.1021/ac901157x. [DOI] [PubMed] [Google Scholar]
- Dudin PV, Unwin PR, Macpherson JV. Phys Chem Chem Phys. 2011;13:17146–17152. doi: 10.1039/c1cp21937e. [DOI] [PubMed] [Google Scholar]
- Dutta G, Kim S, Park S, Yang H. Anal Chem. 2014;86:4589–4595. doi: 10.1021/ac5006487. [DOI] [PubMed] [Google Scholar]
- Dutta G, Park S, Singh A, Seo J, Kim S, Yang H. Anal Chem. 2015;87:3574–3578. doi: 10.1021/ac504485a. [DOI] [PubMed] [Google Scholar]
- Finkelstein DA, Imbeault R, Garbarino S, Roué L, Guay D. J Phys Chem C. 2016;120:4717–4738. [Google Scholar]
- Fung AO, Damoiseaux R, Grundeen S, Panes JL, Horton DH, Judy JW, Moore TB. Malaria Journal. 2012;11:175. doi: 10.1186/1475-2875-11-175. [DOI] [PMC free article] [PubMed] [Google Scholar]
- Ganapuram BR, Alle M, Dadigala R, Dasari A, Maragoni V, Guttena V. Int Nano Lett. 2015;5:215–222. [Google Scholar]
- Huang M, Shao Y, Sun X, Chen H, Liu B, Dong S. Langmuir. 2005;21:323–329. doi: 10.1021/la048337s. [DOI] [PubMed] [Google Scholar]
- Jana NR, Wang ZL, Pal T. Langmuir. 2000;16:2457–2463. [Google Scholar]
- Koçak S, Aslişen B, Koçak CC. Analytical Letters. 2016;49:990–1003. [Google Scholar]
- Kwon SJ, Bard AJ. J Am Chem Soc. 2012;134:10777–10779. doi: 10.1021/ja304074f. [DOI] [PubMed] [Google Scholar]
- Ojani R, Alinezhad A, Aghajani MJ, Safshekan S. J Solid State Electrochem. 2015;19:2235–2244. [Google Scholar]
- Rahmana MA, Won MS, Shim YB. Biosens Bioelectron. 2005;21:257–265. doi: 10.1016/j.bios.2004.09.036. [DOI] [PubMed] [Google Scholar]
- Sanabria-Chinchilla J, Asazawa K, Sakamoto T, Yamada K, Tanaka H, Strasser P. J Am Chem Soc. 2011;133:5425–5431. doi: 10.1021/ja111160r. [DOI] [PubMed] [Google Scholar]
- Shiddiky MJA, Rahman MA, Shim YB. Anal Chem. 2007;79:6886–6890. doi: 10.1021/ac0710127. [DOI] [PubMed] [Google Scholar]
- Si P, Huang Y, Wang T, Ma J. RSC Adv. 2013;3:3487–3502. [Google Scholar]
- Tang J, Tang D. Microchim Acta. 2015;182:2077–2089. [Google Scholar]
- Torrente-Rodríguez RM, Campuzano S, Montiel VRV, Gamella M, Pingarrón JM. Biosens Bioelectron. 2016;77:543–548. doi: 10.1016/j.bios.2015.10.016. [DOI] [PubMed] [Google Scholar]
- Tiwari JN, Nath K, Kumar S, Tiwari RN, Kemp KC, Le NH, Youn DH, Lee JS, Kim KS. Nat Commun. 2013;4:2221–2227. doi: 10.1038/ncomms3221. [DOI] [PMC free article] [PubMed] [Google Scholar]
- Wang G, He X, Wang L, Gu A, Huang Y, Fang B, Geng B, Zhang X. Microchim Acta. 2013;180:161–186. [Google Scholar]
- Wang J. Electroanalysis. 2001;13:983–988. [Google Scholar]
- Wang W, Wang Y, Tu L, Klein T, Feng Y, Wang JP. IEEE Transactions on Magnetics. 2013;49:296–299. [Google Scholar]
- Wilson NO, Adjei AA, Anderson W, Baidoo S, Stiles JK. Am J Trop Med Hyg. 2008;78:733–735. [PMC free article] [PubMed] [Google Scholar]
- Wu D, Fan H, Li Y, Zhang Y, Liang H, Wei Q. Biosens Bioelectron. 2013;46:91–96. doi: 10.1016/j.bios.2013.02.014. [DOI] [PubMed] [Google Scholar]
- Yu ZG, Lai RY. Anal Chem. 2013;85:3340–3346. doi: 10.1021/ac3037987. [DOI] [PubMed] [Google Scholar]
- Zhua N, Chang Z, Heb P, Fang Y. Electrochimica Acta. 2006;51:3758–3762. [Google Scholar]
Associated Data
This section collects any data citations, data availability statements, or supplementary materials included in this article.


