

Capsule Summary
RNA-seq and denaturation studies demonstrated that allergens are among the most highly expressed and stable proteins from Dermatophagoides pteronyssinus. The combination of high levels of transcription and stability for the major allergens Der p 1, Der p 2, and Der p 23 is rare.
Keywords: House Dust Mite, Dermatophagoides pteronyssinus, allergens, stability, denaturation, RNA-seq
To the Editor
Understanding the characteristics that differentiate allergens from non-allergens remains a perplexing question in allergy research. General features such as protein stability and abundance from source are frequently cited as likely determinative factors. However, rigorous statistical comparisons of allergens versus non-allergens on genomic and proteomic scales are lacking. In this study the house dust mite Dermatophagoides pteronyssinus (DP) proteome was evaluated using RNA-seq methods as a proxy to assess the abundance of all proteins in this source. In addition, the thermodynamic stabilities of 656 non-allergens and 19 allergens were evaluated using a combined chemical denaturation and mass spectrometry approach. The results showed that when expression and stability are considered in combination, the allergens are a statistically different population from other DP proteins. The allergens are more stable and more highly expressed. The combination of high levels of transcription and stability for the major allergens Der p 1, Der p 2, and Der p 23 is rare (<2% of all DP proteins) but not unique.
While it has been hypothesized that allergens are the abundant and/or stable proteins from an allergens’ source, experimental evidence to support or refute such hypotheses is lacking. To address the question of allergen abundance, the transcriptome of the house dust mite Dermatophagoides pteronyssinus (DP) was analyzed with RNA-seq technologies (See Online Repository). All 19 DP allergens in the official Allergen Nomenclature database of the World Health Organization and International Union of Immunological Societies (WHO/IUIS) (www.allergen.org) were identified in the transcriptome. Figure 1 shows the relative abundance (fragments per kilobase per million reads, FPKM) of the DP allergen transcripts compared to DP as a whole. Clearly the allergens as a group are more highly expressed than the norm. In fact, many are outliers in the quartile analysis of the DP transcriptome. However, there are still hundreds of other transcripts with similar abundance. There is a positive correlation of 0.4 for protein abundance versus RNA transcription levels in a well-studied murine system.1 This correlation indicates that using RNA-seq to infer protein levels is not rigorously accurate, but the general conclusions for the levels of allergens and non-allergens are likely valid. Relative transcription levels for the allergens were similar to homologues in D. farinae (r=0.59).2
Figure 1.

Analysis of DP proteome and protein stability measurements. Histograms and box plots of relative expression (fragments per kilobase per million reads, FPKM) of all DP transcripts (A), DP proteins studied for stability (B), and DP allergens (C). Panels (D) and (E) show histograms of the stability data for non-allergens and allergens respectively, overlayed with Gaussian fits to the distribution. Panel (F) compares the Gaussian fit of stability data for the non-allergens (blue) with the allergens (red).
The stability of allergens is frequently addressed in the context of food allergens and generally refers to resistance to low pH and digestive enzymes. Recent studies have suggested that the stability of Bet v 1 to endolysosomal digestion in dendritic cells is important for sensitization.3 Here, a mass spectrometry-based proteomics technique was used to evaluate the chemical denaturant-induced equilibrium unfolding properties of 656 DP proteins, and the 19 DP allergens all derived from mite extract, except for a recombinant Der p 23.4 Connecting the protein identifications with RNA-seq data shows that the non-allergen proteins span a wide range of RNA expression values, and trend toward the more highly expressed proteins (Figure 1A-C). The stabilities of the DP proteins are reported as the concentration of guanidinium chloride at the transition midpoint of the chemical denaturation curve (GND½), which is directly related to thermodynamic stability (Figure 1D and E). More stable proteins have higher GND½ values. Based on testing with purified Der p 1, the GND½ values of the protease allergens (groups 1, 3, 6, and 9) were adjusted lower by 0.4 to account for additional stability from added protease inhibitors (see Online Repository). A comparison of the set of allergens (GND½=1.8±0.7) to the non-allergens (GND½=1.5±0.5) shows that the allergens trend toward greater stability. These distributions exhibit significant overlap but a t-test reveals they are statistically different, p=0.026, Figure 1F.
The two-dimensional histogram in Figure 2A shows that there is a Gaussian-like distribution of abundance and stability for the 656 DP proteins. Figure 2B shows the same data as a contour plot and adds the abundance and stability data for the set of allergens for comparison. The allergens cluster primarily in the quadrant corresponding to high stability and high abundance. Hotelling’s T2 statisticwas used to test whether the allergen group differed from the non-allergen group with respect to GND½ and log(FPKM) simultaneously.5 The difference is significant, p < 0.0001, where the value of T2 is 34.8, which is equivalent to an F-statistic of 17.7 with 2 and 672 degrees of freedom.
Figure 2.
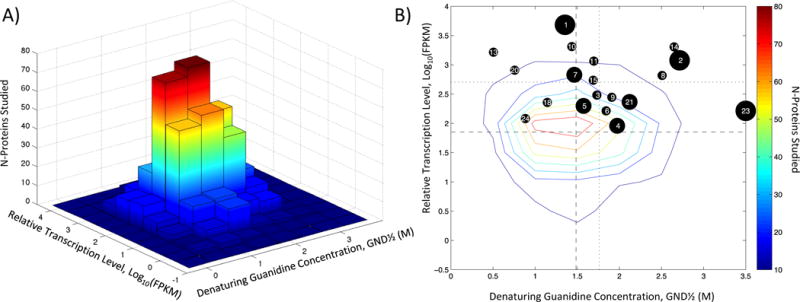
2D Histograms of Stability and Relative Expression for DP. Data is presented as a bar chart (A) or a contour plot (B). Numerical labels indicate allergen groups. Three black circle sizes (large, medium, and small) correspond to the allergen importance rankings of major, mid-tier, and minor/’needs further study’, respectively.11 Dashed and dotted lines are the means for the non-allergen and allergen groups, respectively.
Considering the major allergens, Der p 1, Der p 2, and Der p 23, the stability of Der p 1 is slightly less than the mean for DP proteins, but it is exceptionally highly transcribed. In contrast Der p 23 is not as highly expressed but extremely stable, while the measurements on Der p 2 appear in between the other two. The major allergens were analyzed to see if they were substantially different from the rest of the allergens. They are all reasonably close to the group of allergens, falling within the 85th percentile of the distribution of allergens. However, they are significantly distinct from the group of non-allergens. The probability of obtaining the Der p 1 GND½ and log(FPKM) values for proteins in the non-allergen population is 0.015; for Der p 2, the probability is 0.0002; and for Der p 23, the probability is < 0.0001. To reiterate, the properties of the allergens are rare, but considering the size of the DP transcriptome they are not unique.
The results of this study have important implications for understanding the factors that lead to sensitization. Other influences on sensitization include additional environmental exposures, adjuvants (natural6 and anthropogenic7), genetic susceptibility,8 and a modern hygienic lifestyle.9 A limitation of this protocol is that these studies were performed with whole mite extract in order to sample the maximum number of RNA transcripts and proteins for stability assays. Since allergens are found in both whole bodies and fecal pellets,10 human exposures are at least partially represented in the whole body extracts used here. Future studies will attempt to quantify the amount of DP proteins in dust mite fecal particles and samples of house dust to better compare the allergens and non-allergens to which humans are exposed. Understanding the biophysical properties of the mite proteins involved in human exposure will lead to a better understanding of why the human immune system consistently develops an allergic response to less than 0.1% of the DP proteome.
Acknowledgments
This study was supported in part by the Intramural Research Program of the National Institute of Environmental Health Sciences (Z01-ES102885-01 to REL) and the Extramural Research Program of the National Institute of General Medical Sciences (2R01-GM08174 to MCF) and the National Institute Of Allergy And Infectious Diseases of the National Institutes of Health (R01AI077653 to AP). The content is solely the responsibility of the authors and does not necessarily represent the official views of the National Institutes of Health. The authors also thank the NIH Intramural Sequencing Center, Comparative Sequence Group for expert technical assistance with high-throughput sequencing. We thank Marjorie S. Morgan Ph.D. for preparation of the extracts and DiAnn L. Vyszenski-Moher M.S. for assistance with culturing the mites.
References
- 1.Vogel C, Marcotte EM. Insights into the regulation of protein abundance from proteomic and transcriptomic analyses. Nat Rev Genet. 2012;13(4):227–32. doi: 10.1038/nrg3185. [DOI] [PMC free article] [PubMed] [Google Scholar]
- 2.Chan TF, Ji KM, Yim AK, Liu XY, Zhou JW, Li RQ, et al. The draft genome, transcriptome, and microbiome of Dermatophagoides farinae reveal a broad spectrum of dust mite allergens. J Allergy Clin Immunol. 2015;135(2):539–48. doi: 10.1016/j.jaci.2014.09.031. [DOI] [PubMed] [Google Scholar]
- 3.Machado Y, Freier R, Scheiblhofer S, Thalhamer T, Mayr M, Briza P, et al. Fold stability during endolysosomal acidification is a key factor for allergenicity and immunogenicity of the major birch pollen allergen. J Allergy Clin Immunol. 2016;137(5):1525–34. doi: 10.1016/j.jaci.2015.09.026. [DOI] [PMC free article] [PubMed] [Google Scholar]
- 4.Xu Y, Strickland EC, Fitzgerald MC. Thermodynamic analysis of protein folding and stability using a tryptophan modification protocol. Anal Chem. 2014;86(14):7041–8. doi: 10.1021/ac501278j. [DOI] [PubMed] [Google Scholar]
- 5.Morrison DF. Multivariate Statistical Methods. 2nd. MrcGraw-Hill Book Company; 1976. [Google Scholar]
- 6.Gilles-Stein S, Traidl-Hoffmann C. Pollen are more than allergen carriers. Allergologie. 2016;39(2):69–76. [Google Scholar]
- 7.Baldacci S, Maio S, Cerrai S, Sarno G, Baiz N, Simoni M, et al. Allergy and asthma: Effects of the exposure to particulate matter and biological allergens. Resp Med. 2015;109(9):1089–104. doi: 10.1016/j.rmed.2015.05.017. [DOI] [PubMed] [Google Scholar]
- 8.Bonnelykke K, Sparks R, Waage J, Milner JD. Genetics of allergy and allergic sensitization: common variants, rare mutations. Curr Opin Immunol. 2015;36:115–26. doi: 10.1016/j.coi.2015.08.002. [DOI] [PMC free article] [PubMed] [Google Scholar]
- 9.Platts-Mills TAE. The allergy epidemics: 1870–2010. J Allergy Clin Immun. 2015;136(1):3–13. doi: 10.1016/j.jaci.2015.03.048. [DOI] [PMC free article] [PubMed] [Google Scholar]
- 10.Batard T, Baron-Bodo V, Martelet A, Le Mignon M, Lemoine P, Jain K, et al. Patterns of IgE sensitization in house dust mite-allergic patients: implications for allergen immunotherapy. Allergy. 2016;71(2):220–9. doi: 10.1111/all.12796. [DOI] [PubMed] [Google Scholar]
- 11.Thomas WR. Hierarchy and molecular properties of house dust mite allergens. Allergol Int. 2015;64(4):304–11. doi: 10.1016/j.alit.2015.05.004. [DOI] [PubMed] [Google Scholar]