

Abstract
Quinolinic acid, a macrophage/microglia-derived excitotoxin fulfills a plethora of functions such as neurotoxin, gliotoxin, and proinflammatory mediator, and it alters the integrity and cohesion of the blood-brain barrier in several pathophysiological states. Beta-trace protein (BTP), a monomeric glycoprotein, is known to indicate cerebrospinal fluid leakage. Thus, the prior aim of this study was to investigate whether BTP might non-invasively indicate quinolinic acid-induced impaired blood-brain barrier integrity. The research hypotheses were tested in three subsamples with different states of immune activation (patients with HCV-infection and interferon-α, patients with major depression, and healthy controls). BTP has also been described as a sensitive marker in detecting impaired renal function. Thus, the renal function has been considered. Our study results revealed highest quinolinic acid and highest BTP- levels in the subsample of patients with HCV in comparison with the other subsamples with lower or no immune activation (quinolinic acid: F = 21.027, p < 0.001 [ANOVA]; BTP: F = 6.792, p < 0.01 [ANOVA]). In addition, a two-step hierarchical linear regression model showed that significant predictors of BTP levels are quinolinic acid, glomerular filtration rate and age. The neurotoxin quinolinic acid may impair blood-brain barrier integrity. BTP might be a new non-invasive biomarker to indicate quinolinic acid-induced impaired blood-brain barrier integrity.
Quinolinic Acid
The inflammatory and neurodegeneration hypothesis of depressive illness considers major depression to be a psychopathological manifestation of inflammatory processes in the brain1,2. In this concept TNF-α, IFN-α and IFN-γ have a substantial impact on the enzyme indoleamine 2,3-dioxygenase (IDO), which causes a breakdown of the serotonin precursor tryptophan to kynurenine1,2. IDO is expressed in various cell types, including microglia, dendritic cells, monocytes and fibroblasts2. As a result, increased levels of kynurenine cross the blood-brain barrier and are subsequently broken up by human microglia into quinolinic acid, an excitotoxin with N-methyl-D-aspartate (NMDA) receptor affinity, and into other neurotoxic metabolites, which may trigger depressive symptoms2. Corresponding to this, Steiner et al.3,4 showed an upregulated production of quinolinic acid by microglia in the subgenual anterior cingulate cortex and the anterior midcingulate cortex in postmortem brains of patients with major depression who had committed suicide3,4.
The neuroactive metabolite of L-tryptophan quinolinic acid causes acute or chronic neuronal dysfunction through the following mechanisms: (a) Quinolinic acid is a potent NMDA receptor agonist and overstimulates the NMDA receptors in pathophysiological concentrations5,6,7. A massive entry of calcium into neurons, especially in the hippocampus, striatum and the neocortex might be the resulting consequence5,6,7,8. (b) Quinolinic acid causes excessive neurotoxic glutamate release by neurons and inhibits its reuptake by astrocytes9,10. (c) Quinolinic acid-induced reactive oxygen types mediate lipid peroxidation11,12,13,14,15,16.
(d) Quinolinic acid potentiates the toxicity of excitotoxins (e.g. glutamate, glycin, NMDA) and causes progressive mitochondrial dysfunction17. (e) Quinolinic acid impairs autophagy18. (f) Quinolinic acid destabilizes the cytoskeleton and intermediates filament hyperphosphorylation19,20,21. (g) Quinolinic acid plays an important role in the dysregulation of astroglial function and gliotoxicity22,23. Furthermore, Guillemin et al.18 showed that quinolinic acid selectively induces apoptosis of human astrocytes, which produce neuroprotective kynurenic acid. This might lead to lower neuroprotective action against neurotoxic quinolinic acid24,25. (h) Free radical production and oxidative stress are the consequence of quinolinic acid-induced NOS activity in astrocytes18,24. (i) Quinolinic acid causes a disruption of the integrity of the blood-brain barrier4,18,26,27.
In a study by Schefold et al.28 serum levels of kynurenine, kynurenic acid and quinolinic acid increased with chronic kidney disease severity (stages 4, 5 versus controls).
Blood-Brain Barrier
Relating to anatomy, the brain’s microvascular network consists of capillaries, arterioles and venules and forms a protective blood-brain barrier (BBB) that separates the central nervous system (CNS) from the rest of the body, provides a homeostatic environment for the CNS, and restricts the exchange of material between the blood and the perivascular, extracellular fluid29,30,31. The capillaries form the largest and tightest microvasculature in the brain, while venules have a looser junctional arrangement32. The BBB strictly regulates the transport of blood-borne substances into the brain and is constituted of endothelial cells interconnected by a continuous line of tight junctions and of pericytes that are located in the duplication of the basement membrane29,30,31,32. In addition, the capillaries in the brain are surrounded by specialized structures of astrocytes32. Together these anatomical structures form the neurovascular unit (NVU) and incorporate a paracellular barrier (tight junctions, apical junctional complex), a transcellular barrier (low grade of trans- and pinocytosis), and an enzymatic barrier (metabolizes biologically active substances)32. In this way, the BBB restricts neurotoxic mixtures and large polar substances from passively diffusing into the brain29,30,31. In addition, members of the ATP-binding cassette (ABC) transporter family remove actively lipophilic compounds and metabolic toxins4. Numerous studies revealed that supporting cells of the NVU release a broad range of soluble factors that induce and control barrier properties29,31. Imola et al.32 revealed morphological differences in the vasculature of different CNS regions.
Beta-Trace Protein
The Beta-trace protein (BTP), first described in 1961 by J. Clausen, is a monomeric glycoprotein that belongs to the lipocalin superfamily33,34,35. BTP consists of 168 amino acids and has a low molecular weight of 23,000 to 29,000 Da, depending on the degree of glycosylation34,35,36. In 1993, an amino acid sequence determination revealed that BTP has a prostaglandin synthase activity (prostaglandin-H2 D-isomerase; EC 5.3.99.2) and catalyses the conversion of prostaglandin H2 (PGH2), a common precursor of various prostanoids, to prostaglandin D2 (PGD2)33,34,35,36. PGD2 is involved in sleep induction and regulation, adipocyte differentiation, nociception, bronchoconstriction, inflammatory mediator modulation, nitric oxide release, induction of vasodilation, and inhibition of platelet aggregation33,35,36,37,38. In addition, Hoffmann et al.39 described localized and specific functions of BTP for the establishment and the function of the blood-tissue barriers.
BTP is brain-specific, one of the major polypeptide constituents of the cerebrospinal fluid (CSF), and is found in much lower concentrations in the blood38,39. The main origin of serum BTP has been hypothesized to result from diffusion of CNS BTP. After diffusion the liver rapidly eliminates the non-sialylated “brain type” glycoforms by specialized receptors, resulting in larger “blood/urine” sialylated glycoforms38. Corresponding with this, in canines intrathecally administered recombinant BTP was recovered from their serum and urine38. In the brain BTP is secreted to the major site by the leptomeninges and to a certain degree to the choroid plexus34,35,40,41,42. Previous studies showed that the low ventricular CSF concentration (1.5 mg/l) of beta-trace, which derives from the choroid plexus, increases along the CSF flow way in the subarachnoid space up to a mean lumbar concentration of 16.6 mg/l due to of a steady release from the leptomeninges39,43. In another study by Reiber et al.41 the mean BTP concentrations of 132 control patients were 18.4 mg/l in the normal lumbar CSF and 0.59 mg/l in the normal serum. CSF fistulas might be a severe consequence of head trauma, high intracranial pressure, arachnoid granulations, malignancy, surgical procedures at the skull base, or congenital malformation34,35. The detection of BTP to identify a suspected posttraumatic, iatrogenic, spontaneous or idiopathic cerebrospinal fluid leakage (CSF) with CSF rhinorrhea or otorrhea is a non-invasive, highly sensitive and specific method34,35,40,41,42,43,44,45. Furthermore, patients with an acute traumatic CSF leakage without dural repair have a high risk of contracting bacterial meningitis, a potential live-threatening disease35,45,46,47.
Additionally, changes in BTP urine and serum concentrations have been observed in renal diseases48,49. Thus, the kidneys eliminate BTP by glomerular filtration, and renal failure patients have increased serum BTP values35,50,51,52,53. Most recently, BTP has emerged as a novel biomarker of cardiovascular risk, and different studies have explored the role of BTP in hypertension54,55,56,57. Thus, increased BTP levels might also reflect injuries in the renal tubules and arterioles due to extended hypertension58,59.
Aims of the Study
Quinolinic acid fulfills a plethora of physiological functions such as neurotoxin, gliotoxin, prooxidant molecule and proinflammatory mediator, and it alters the integrity and cohesion of the blood-brain barrier26,27. BTP is brain-specific and one of the major polypeptide constituents of the cerebrospinal fluid, and its detection to identify a suspected cerebrospinal fluid leakage is a well-established diagnostic method35. As a consequence, the prior aim of this study was to evaluate for the first time whether BTP might be a new non-invasive immunological marker for quinolinic acid-induced impaired blood-brain barrier integrity. We tested our research hypothesis in three subsamples with different conditions of immune activation and subsequent expected different quinolinic acid levels. BTP has also been described as a sensitive marker in detecting impaired renal function and serum levels of quinolinic acid increase with chronic kidney disease severity28. Thus, the renal function, including the glomerular filtration rate (GFR), were considered.
Methods
Participants and Study Design
To verify the hypothesis that BTP might be an innovative new non-invasive marker for quinolinic acid-induced impaired blood-brain barrier integrity, we examined the relations of quinolinic acid and BTP in three subsamples of our research project on quinolinic acid and kynurenine pathway1,60,61. The patient subsamples and the subsample of healthy controls were used to test the relations of BTP and quinolinic acid in different conditions of quinolinic acid levels. Thus quinolinic acid levels may differ in the two observed patient samples (patients with chronic hepatitis C virus (HCV) infection and IFN-α therapy; patients with major depression) and the sample of healthy controls due to the different conditions of immune activation. In detail, the first patient sample consisted of 41 patients with chronic HCV infection who were examined one month after the start of IFN-α therapy. All these HCV patients were treated on an ambulatory basis at the Division of Gastroenterology and Hepatology, Medical University of Graz, Austria. This subgroup was chosen because it is already known that IFN-α has a substantial impact on indoleamine 2,3-dioxygenase (IDO) that causes a breakdown of tryptophan to kynurenine and subsequently strongly increases quinolinic acid levels1,60,61. Thus we expected the highest quinolinic acid levels in this sample. The second sample consisted of 61 patients with major depression at the time of hospital admittance to the Department of Psychiatry, Hospital of the Brothers of St. John of God, Graz, Austria. In comparison to the sample with HCV infection and INF-α therapy, the immune activation associated with major depression and the subsequent quinolinic acid levels were expected to be much lower in the sample of patients suffering from major depression. Finally, the third sample included 45 physically and mentally healthy controls without a former history of psychiatric disorders. In this sample of healthy controls, lower quinolinic acid concentrations in comparison with patients during IFN-alpha therapy might be expected, due to the lack of concomitant immune activation. The details of the recruitment procedure are described elsewhere1,60,61. Exclusion criteria for all participants were (1) pregnancy, (2) significant comorbid conditions, (3) diagnosis of a neurological disease, and (4) for the patients with HCV infection, a coincidence with other chronic liver diseases.
Our research project and the current study have been approved by the Institutional Review Board of the Medical University of Graz.
Data protection met the standards set by Austrian law. The methods were carried out in accordance with the approved guidelines. All participants in this study had to give signed informed consent, and subjects could decide to withdraw from this study at any time.
Biological Assessments
For all fasting study participants blood was sampled between 08.00 am and 09.00 am for the determination of quinolinic acid, creatinine and BTP.
Quinolinic acid was measured with a new developed liquid chromatography tandem mass spectrometry method62. After solid phase extraction and precolumn derivatization with butanol, analytes were separated on a reversed phase column and detected in the positive electrospray ionization (ESI) mode with the specific transition for quinolinic acid m/z 280 → m/z 78. Commercially available quinolinic acid -d3 was used as internal standards. Within-day CVs for quinolinic acid were 4.5% (225 nmol/L) and 1.2% (725 nmol/L), and between-day CVs were 7.2% (235 nmol/L) and 6.3% (752 nmol/L)62.
Concentrations of beta-trace protein were measured in serum with a latex-enhanced immunonephelometry method on a BN™ System (Siemens Healthcare, Erlangen, Germany). Creatinine measurement was done with an enzymatic method applied to an automated analyser (Cobas Mira Roche, Roche Diagnostics, Basel, Switzerland).
Psychiatric Assessments, Sociodemographic Questionnaire, and Clinical Characteristics
The consenting participants of all subsamples were interviewed by experienced consultant-liaison psychiatrists (A.B., O.A.) to examine the presence and the severity of depressive symptomatology by using the well-validated psychometric observer-rated scale Hamilton Depression Rating Scale (HAMD-17). Recorded sociodemographic variables comprised age, sex, marital and employment status, and living arrangements. Clinical and treatment characteristics of the patients with HCV infection were: subtype of chronic HCV infection, type of IFN-α, and liver fibrosis as captured by fibroscans in kPA.
Statistical Analyses
All descriptive statistics regarding sociodemographic and biochemical data are presented as mean and standard deviation (S.D.). χ2 tests were used to evaluate group differences in sociodemographic categorical variables. To test the data for normality we performed the Kolmogorov-Smirnov test. Log transformations for quinolinic acid and BTP were applied to make these data conform more closely to the normal distribution. Subsequently, for continuous measures, differences between groups were assessed based on the statistical distribution of variables using either one-way analyses of variance (ANOVAs) followed by Scheffé post hoc tests or Kruskal-Wallis H-Test followed by post hoc test with Bonferroni adjustment. By means of multivariate analyses in the form of a two-step hierarchical linear regression model, quinolinic acid was selected to predict beta-trace protein levels. Age, sex, group and renal function were chosen as control variables. In our analysis we considered sex and group as categorical variables. Therefore, we measured sex with one dummy variable taking the value 1 if the patient was male and the value 0 if the patient was female. For patient groups we formed two dummy variables. One dummy variable covered the subsample of patients with chronic HCV infection (subsample 1) and the second dummy variable was measured if the participant was from the subsample of patients with major depression (subsample 2). Thus, the healthy controls (subsample 3) formed the reference category in our analysis. In the subsample of of HCV patients Spearman’s rank correlations were performed to evaluate a potential association between the fibroscans in kPA and quinolinic acid as well BTP. All statistical analyses were performed with IBM SPSS Statistics 22.0 for Windows. P-values < 0.05 were regarded as statistically significant.
Results
Sociodemographic, Clinical and Treatment Characteristics
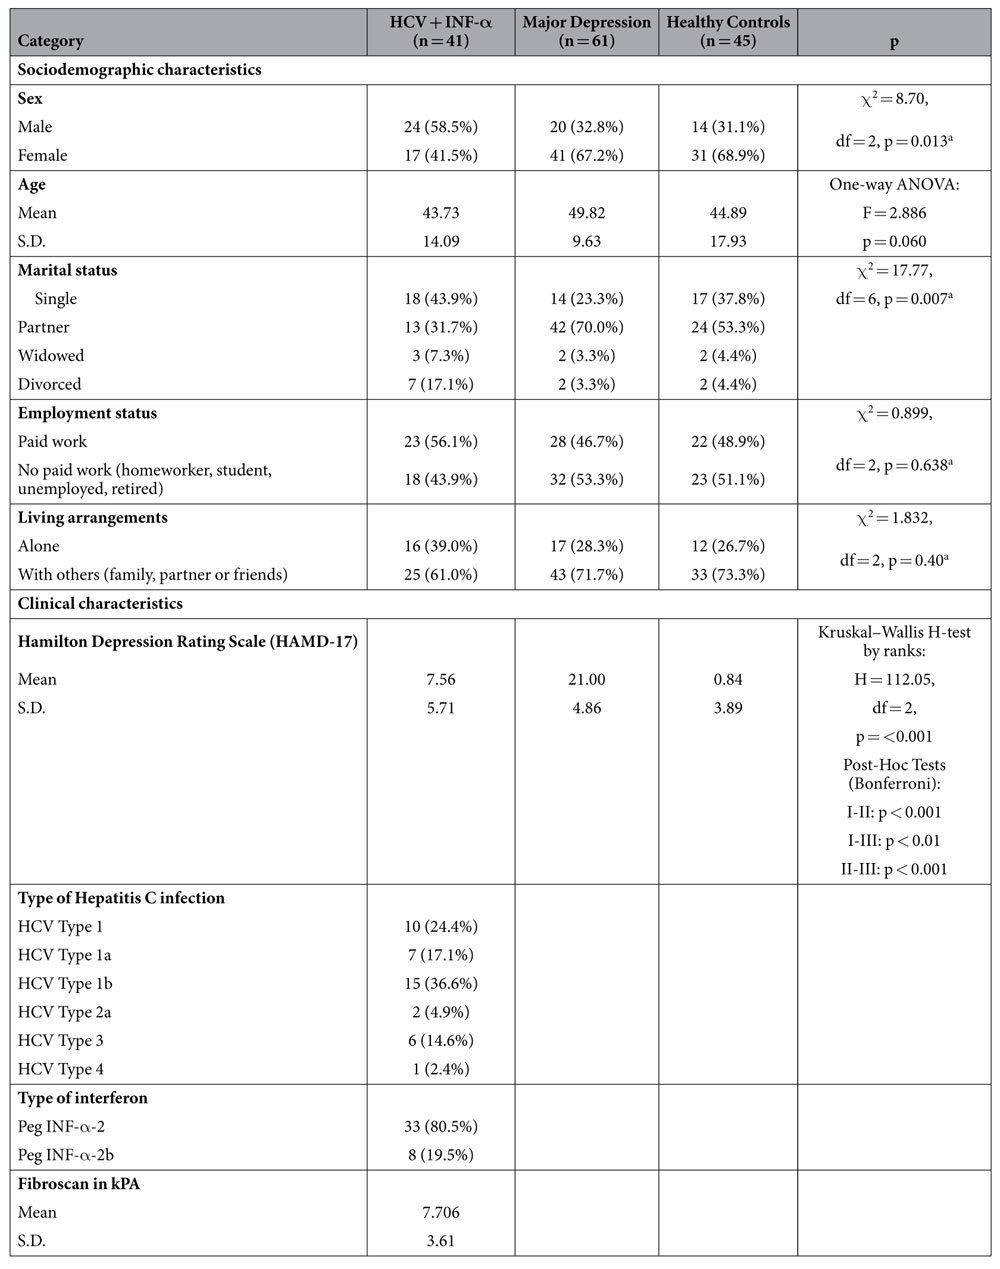
Table 1 provides the sociodemographic and clinical characteristics (including Hamilton Depression Rating Scale [HAMD-17] scores) of all study participants. All consenting 147 participants (60.5% women, 39.5% men) were Caucasian. In the sample of patients with major depression 58 (95.1%) patients had a medication-based therapy with selective serotonin re-uptake inhibitors or second-generation dual-action antidepressants. Two patients (3.3%) had a medication-based therapy with a tricyclic antidepressant and one patient (1.6%) had an additional pharmacological treatment with carbamazepine. The sample of patients with HCV had a medication-based therapy with Peg INF-α-2 orPeg INF-α-2b. In the sample of healthy controls no patient had a psychopharmacological treatment or a Peg INF-α therapy.
Table 1. Sociodemographic and clinical characteristics of the participants.
S.D. = Standard deviation.
aχ2 tests.
Beta-Trace Protein and Quinolinic Acid
In a two-step hierarchical linear regression model using the ordinary least squares (OLS) estimator with heteroscedasticity-consistent (robust) standard errors quinolinic acid was selected to predict beta-trace protein levels. Age, sex (female = 0; male = 1), group [HCV- patients one month after the start of IFN-α therapy (dummy variable 1); patients with major depression (dummy variable 2); healthy controls (reference group)] and renal function (GFR) were chosen as control variables.
In the first step, we regressed beta-trace protein levels against the control variables age, sex, group and renal function (Model 1). This model yields a R2adj. = 0.297 and is statistically highly significant (p < 0.001). In the second step we introduced the predictor quinolinic acid (Model 2). This model is also highly significant and yields a R2adj. = 0.372; p < 0.001. Additionally, the ∆ R2 = 0.077 is highly significant (p < 0.001), which means that the introduction of quinolinic acid to the model significantly improves the explanation of the variance of BTP. In this step, the model shows that significant predictors of beta-trace protein levels are quinolinic acid levels, GFR and age. Table 2 provides the results of the two-step hierarchical linear regression model. (In addition, we tested for group effects concerning the effect of quinolinic acid levels by including interaction effects of quinolinic acid with group dummy variables. Both the overall improvement of the model (∆ R2 = 0.006, p = 0.475) as well as the interaction effects (quinolinic acid*Group-HCV: p = 691; quinolinic acid*Group-Major Depression: p = 0.378) were not significant and therefore lead to no model improvement).
Table 2. Two-step hierarchical linear regression model.
| DV = Beta-Trace Protein (BTP) Total Sample (n = 147) | |||||
|---|---|---|---|---|---|
| Step 1 (Model 1) | B | β | S.E. | p | VIF |
| Constant | −0.186 | 0.061 | 0.003 | ||
| Sex –male (Dummy variable) | 0.020 | 0.105 | 0.014 | 0.148 | 1.083 |
| Age | 0.001 | 0.224 | 0.001 | 0.008 | 1.432 |
| Groupa - HCV (Dummy variable 1) | 0.050 | 0.245 | 0.017 | 0.004 | 1.486 |
| Groupa - Major Depression (Dummy variable 2) | −0.004 | −0.020 | 0.015 | 0.808 | 1.415 |
| Renal Function - Glomerular Filtration Rate | −0.002 | −0.310 | 0.000 | 0.000 | 1.389 |
| F = 13.32***; R2 = 0.321; adjusted R2 = 0.297 | |||||
| Step 2 (Model 2) | |||||
| Constant | −0.686 | 0.131 | 0.000 | ||
| Sex –male (Dummy variable) | 0.015 | 0.082 | 0.013 | 0.236 | 1.090 |
| Age | 0.001 | 0.188 | 0.001 | 0.019 | 1.449 |
| Groupa - HCV (Dummy variable 1) | 0.027 | 0.133 | 0.017 | 0.116 | 1.647 |
| Groupa - Major Depression (Dummy variable 2) | 0.007 | 0.039 | 0.015 | 0.622 | 1.460 |
| Renal Function - Glomerular Filtration Rate | −0.001 | −0.251 | 0.000 | 0.002 | 1.434 |
| Quinolinic Acid | 0.185 | 0.331 | 0.044 | 0.000 | 1.423 |
| F = 15.418***; R2 = 0.398; adjusted R2 = 0.372 | |||||
| ∆ R2 = 0.077*** | |||||
Standardized regression coefficients are displayed in the table; Significance Levels: *p < 0.05; **p < 0.01; ***p < 0.001; Log 10 transformations for quinolinic acid and BTP; aGroup: HCV patients one month after the start of IFN-α therapy (Dummy variable 1); patients with major depression (Dummy variable 2); healthy controls (reference group).
One-way analyses of variance (ANOVAs) additionally showed that patients with HCV infection and IFN-α therapy had significantly higher quinolinic acid levels in comparison to patients with major depression as well as healthy controls. Corresponding with this, the BTP levels differed in the same way. Thus, patients with HCV infection and IFN-α therapy had the highest BTP levels. Table 3 shows the biological assessments.
Table 3. Biological Assessments.
| I: HCV patients + INF-α (n = 41) | II: Major Depression (n = 61) | III: Healthy Controls (n = 45) | p | |
|---|---|---|---|---|
| Beta-Trace Protein (BTP) [mg/L] | Mean: 0.619 S.D. = 0.122 | Mean: 0.543 S.D. = 0.109 | Mean: 0.539 S.D. = 0.119 | One-way ANOVA: F = 6.792 p = 0.002 Post-Hoc Tests (Scheffé): I-II: p = 0.007 I-III: p = 0.005 II-III: p = 0.951 |
| Quinolinic Acid [nmol/L] | Mean: 563.11 S.D. = 161.121 | Mean: 371.23 S.D. = 125.84 | Mean: 428.30 S.D. = 202.08 | One-way ANOVA: F = 21.027 p < 0.001 Post-Hoc Tests (Scheffé): I-II: p < 0.001 I-III: p < 0.001 II-III: p = 0.208 |
| Creatinine [mg/dL] | Mean: 0.872 S.D. = 0.147 | Mean: 0.814 S.D. = 0.180 | Mean: 0.855 S.D. = 0.181 | One-way ANOVA: F = 1.585 p = 0.209 |
| Glomerular Filtration Rate[mL *min−1] | Mean: 87.44 S.D. = 13.83 | Mean: 91.70 S.D. = 15.41 | Mean: 92.63 S.D. = 18.45 | One-way ANOVA: F = 1.295 p = 0.277 |
S.D. = Standard deviation; Log 10 transformations for quinolinic acid and BTP.
In the subsample of HCV patients, liver fibrosis as captured by fibroscans in kPA did neither correlatewith quinolinic acid (Spearman’s rank correlation coefficient r: −0.091, p = 0.729) nor beta-race protein levels (Spearman’s rank correlation coefficient r: −0.018, p = 0.944). Table 1 provides the fibroscan data (Supplementary Information).
Discussion
Several former studies have established an impact of quinolinic acid on blood-brain barrier integrity. According to Heyes et al.63, under normal conditions quinolinic acid in the blood contributes to almost 70% of this metabolite in the CSF, while in conditions of immune activation, the elevations of CSF quinolinic acid indicate both de novo synthesis within the brain as well as entry of quinolinic acid from the blood due to defects in the integrity of the BBB. In a study of Reynolds and Morton27 trypan blue was used to show increases in BBB permeability in striatal lesions induced by intrastriatal injection of quinolinic acid. Diverse research studies in the past have investigated that increased CSF of quinolinic acid may also reflect abnormal blood–brain barrier function in patients with acquired immunodeficiency syndrome (AIDS) dementia complex, exhibiting a relationship to their clinical and neurological status26. In a study by St’‘astný et al.26 potential BBB dysfunction was explored in young adult male Wistar rats four days after the intracerebroventricular infusion of quinolinic acid by measuring plasma albumin extravasation using rocket immunoelectrophoresis. In this study, the intracerebroventricular infusion of quinolinic acid failed to raise the extracellular tissue concentration of albumin in the entorhinal cortex. However, significantly higher levels were detected in the hippocampus proper (but not in the subiculum region and dentate gyrus) and in the striatum26. In addition, Ryu el al.64 showed that an extensive disruption of BBB was observed at 7 days’ post quinolinic acid-injection as demonstrated by increased immunohistochemical staining using an antibody against immunoglobulin G (IgG). The study results also revealed that quinolinic acid intrastriatal injection resulted in significant increases in the number of infiltrating T-lymphocytes (by 70-fold) and expression of major histocompatibility complex (MHC-class II) (by 45-fold) relative to unlesioned controls.
Our study results revealed the highest BTP and quinolinic acid levels in the subsample of patients with HCV infection and INF-α therapy in comparison with the other subsamples with low or no immune activation. In this subsample the observed elevated quinolinic acid levels might be the result of increased immune activation due to INF-α, resulting in increased levels of kynurenine, which crosses the blood-brain barrier and is subsequently broken up by human microglia into quinolinic acid. The simultaneously elevated BTP might be a strong indicator that in somatic conditions with high quinolinic acid levels BTP might be a new non-invasive marker of quinolinic acid-induced impaired blood-brain barrier integrity. Corresponding with this, the two-step hierarchical linear regression model revealed that quinolinic acid is a highly significant predictor of BTP in all examined subsamples. Furthermore, impaired GFR and older age have the already expected additional impact on BTP levels, while liver fibrosis had no significant impact on quinolinic acid or BTP. In conclusion our study results reveal that participants with high levels of neurotoxic quinolinic acid also have higher BTP levels that might indicate CSF leakage.
Limitations
Peripheral markers of BBB function have been known for many years and their clinical use has confirmed their utility. Usually, clinicians refer to the beta-trace protein (BTP) serum concentration to evaluate severe traumatic injuries of the BBB with liquorrhea. In these cases, BTP serum concentrations are elevated in comparison with the respective BTP concentration in aural or nasal secretion. However, so far no meaning has been attached to the physiological fluctuation of BTP. However, it is quite conceivable that even marginally increased BTP values indicate a loss of selectivity of the BBB, which could have an impact on neurophysiological processes and, as a consequence, on physical and mental health. Our study results are a first hint that BTP might also be a non-invasive diagnostic peripheral marker of BBB permeability. A direct comparison with S100B or similar markers should be performed in subsequent studies. Furthermore, it should also be considered to investigate in neuroimaging studies whether marginally increased BTP serum values can be correlated with signs indicating an impairment of BBB permeability. It also seems reasonable to integrate it in cohort studies to detect its possible clinical relevance for neurological and neuropsychological diseases. Thus, additional research studies are required to determine any set patterns of this present exploratory study. Knowledge about the complex interaction between BTP and quinolinic acid is still limited and requires ongoing research.
Conclusions
Several studies demonstrated that the neurotoxin quinolinic acid might impair blood-brain barrier integrity. As a consequence, new non-invasive biomarkers might be of great scientific and clinical value to assess the physiological consequences of increased quinolinic acid levels in the human brain. BTP might be such a new appropriate non-invasive biomarker to indicate quinolinic acid-induced impaired blood-brain barrier integrity.
Additional Information
How to cite this article: Baranyi, A. et al. Beta-trace Protein as a new non-invasive immunological Marker for Quinolinic Acid-induced impaired Blood-Brain Barrier Integrity. Sci. Rep. 7, 43642; doi: 10.1038/srep43642 (2017).
Publisher's note: Springer Nature remains neutral with regard to jurisdictional claims in published maps and institutional affiliations.
Supplementary Material
Footnotes
The authors declare no competing financial interests.
Author Contributions Conceived and designed the experiments: A.B., O.A.G., D.v.L., H.B.R., C.R., R.B., T.S., W.M., H.M., A.M. Performed the experiments: A.B., O.A.G., D.v.L., H.B.R., C.R., R.B., T.S., W.M., H.M., A.M. Analyzed the data: A.B., O.A.G., D.v.L., H.B.R.,C.R., R.B., T.S., W.M., H.M., A.M. Contributed reagents/materials/analysis tools: A.B., O.A.G., A.M. Wrote the paper: A.B., O.A.G., D.v.L., H.B.R., C.R., R.B., T.S., W.M., H.M., A.M. All authors reviewed the manuscript.
References
- Baranyi A. et al. A biopsychosocial model of interferon-alpha-induced depression in patients with chronic hepatitis C infection. Psychother. Psychosom. 82, 332–340 (2013). [DOI] [PubMed] [Google Scholar]
- Wichers M. C. et al. IDO and interferon-alpha-induced depressive symptoms: A shift in hypothesis from tryptophan depletion to neurotoxicity. Mol. Psychiatry. 10, 538–544 (2005). [DOI] [PubMed] [Google Scholar]
- Steiner J. et al. Severe depression is associated with increased microglial quinolinic acid in subregions of the anterior cingulate gyrus: evidence for an immune-modulated glutamatergic neurotransmission? J. Neuroinflammation. 8, 94 (2011). [DOI] [PMC free article] [PubMed] [Google Scholar]
- Steiner J. et al. Bridging the gap between the immune and glutamate hypotheses of schizophrenia and major depression: Potential role of glial NMDA receptor modulators and impaired blood-brain barrier integrity. World J. Biol. Psychiatry. 13, 482–492 (2012). [DOI] [PubMed] [Google Scholar]
- Prado de Carvalho L., Bochet P. & Rossir J. The endogenous agonist quinolinic acid and the non endogenous homoquinolinic acid discriminate between NMDAR2 receptor subunits. Neuroche. Int. 28, 445–452 (1996). [DOI] [PubMed] [Google Scholar]
- Perkins M. N. & Stone T. W. Pharmacology and regional variations of quinolinic acid-evoked excitations in the rat central nervous system. J. Pharmacol. Exp. Ther. 226, 551–557 (1983). [PubMed] [Google Scholar]
- Schwarcz R. & Köhler C. Differential vulnerability of central neurons of the rat to quinolinic acid. Neurosci. Lett. 38, 85–90 (1983). [DOI] [PubMed] [Google Scholar]
- Vandresen-Filho S. et al. Cerebral cortex, hippocampus, striatum and cerebellum show differential susceptibility to quinolinic acid-induced oxidative stress. Neurol. Sci. 36, 1449–1456 (2015). [DOI] [PubMed] [Google Scholar]
- Busse M. et al. Decreased quinolinic acid in the hippocampus of depressive patients: evidence for local anti-inflammatory and neuroprotective responses? Eur. Arch. Psychiatry Clin. Neurosci. 265, 321–329 (2015). [DOI] [PubMed] [Google Scholar]
- Tavares R. G. et al. Quinolinic acid stimulates synaptosomal glutamate release and inhibits glutamate uptake into astrocytes. Neurochem. Int. 40, 621–627 (2002). [DOI] [PubMed] [Google Scholar]
- Elinos-Calderón D. et al. Antioxidant strategy to rescue synaptosomes from oxidative damage and energy failure in neurotoxic models in rats: protective role of S-allylcysteine. J. Neural. Transm. 117, 35–44 (2010). [DOI] [PubMed] [Google Scholar]
- Behan W. M., McDonald M., Darlington L. G. & Stone T. W. Oxidative stress as a mechanism for quinolinic acid-induced hippocampal damage: protection by melatonin and deprenyl. Br. J. Pharmacol. 128, 1754–1760 (1999). [DOI] [PMC free article] [PubMed] [Google Scholar]
- Behan W. M. & Stone T. W. Enhanced neuronal damage by co-administration of quinolinic acid and free radicals, and protection by adenosine A2A receptor antagonists. Br. J. Pharmacol. 135, 1435–1442 (2002). [DOI] [PMC free article] [PubMed] [Google Scholar]
- Braidy N., Grant R., Adams S. & Guillemin G. J. Neuroprotective effects of naturally occurring polyphenols on quinolinic acid-induced excitotoxicity in human neurons. FEBS J. 277, 368–382 (2010). [DOI] [PubMed] [Google Scholar]
- Santamaría A. et al. Quinolinic acid induces oxidative stress in rat brain synaptosomes. Neuroreport. 12, 871–874 (2001a). [DOI] [PubMed] [Google Scholar]
- Santamaría A. et al. In vivo hydroxyl radical formation after quinolinic acid infusion into rat corpus striatum. Neuroreport. 12, 2693–2696 (2001b). [DOI] [PubMed] [Google Scholar]
- Schurr A. & Rigor B. M. Quinolinate potentiates the neurotoxicity of excitatory amino acids in hypoxic neuronal tissue in vitro. Brain Res. 617, 76–80 (1993). [DOI] [PubMed] [Google Scholar]
- Guillemin G. J. Quinolinic acid, the inescapable neurotoxin. FEBS J. 79, 1356–1365 (2012). [DOI] [PubMed] [Google Scholar]
- Pierozan P., Gonçalves Fernandes C., Ferreira F. & Pessoa-Pureur R. Acute intrastriatal injection of quinolinic acid provokes long-lasting misregulation of the cytoskeleton in the striatum, cerebral cortex and hippocampus of young rats. Brain Res. 1577, 1–10 (2014). [DOI] [PubMed] [Google Scholar]
- Pierozan P. et al. Acute intrastriatal administration of quinolinic acid provokes hyperphosphorylation of cytoskeletal intermediate filament proteins in astrocytes and neurons of rats. Exp. Neurol. 224, 188–196 (2010). [DOI] [PubMed] [Google Scholar]
- Rahman A. et al. The excitotoxin quinolinic acid induces tau phosphorylation in human neurons. PLOS One. 4, e6344 (2009). [DOI] [PMC free article] [PubMed] [Google Scholar]
- Sundaram G. et al. Quinolinic acid toxicity on oligodendroglial cells: relevance for multiple sclerosis and therapeutic strategies. J. Neuroinflammation. 11, 204 (2014). [DOI] [PMC free article] [PubMed] [Google Scholar]
- Lee M. C. et al. Characterisation of the expression of NMDA receptors in human astrocytes. PLOS One. 5, e14123 (2010). [DOI] [PMC free article] [PubMed] [Google Scholar]
- Braidy N., Grant R., Adams S., Brew B. J. & Guillemin G. J. Mechanism for quinolinic acid cytotoxicity in human astrocytes and neurons. Neurotox. Res. 16, 77–86 (2009). [DOI] [PubMed] [Google Scholar]
- Myint A. M., Schwarz M. J., Steinbusch H. W. & Leonard B. E. Neuropsychiatric disorders related to interferon and interleukins treatment. Metab. Brain Dis. 24, 55–68 (2009). [DOI] [PubMed] [Google Scholar]
- St’astný F., Skultétyová I., Pliss L. & Jezová D. Quinolinic acid enhances permeability of rat brain microvessels to plasma albumin. Brain Res. Bull. 53, 415–420 (2000). [DOI] [PubMed] [Google Scholar]
- Reynolds D. S. & Morton A. J. Changes in blood-brain barrier permeability following neurotoxic lesions of rat brain can be visualised with trypan blue. J. Neurosci. Methods. 79, 115–121 (1998). [DOI] [PubMed] [Google Scholar]
- Schefold J. C. et al. Increased indoleamine 2,3-dioxygenase (IDO) activity and elevated serum levels of tryptophan catabolites in patients with chronic kidney disease: a possible link between chronic inflammation and uraemic symptoms. Nephrol. Dial. Transplant. 24, 1901–1908 (2009). [DOI] [PubMed] [Google Scholar]
- Wevers N. R. & De Vries H. Morphogens and blood-brain barrier function in health and disease. Tissue Barriers. 4, e1090524 (2015). [DOI] [PMC free article] [PubMed] [Google Scholar]
- Shen S. & Zhang W. ABC transporters and drug efflux at the blood-brain barrier. Rev. Neurosci. 21, 29–53 (2010). [DOI] [PubMed] [Google Scholar]
- Spector R. Nutrient transport systems in brain: 40 years of progress. J. Neurochem. 111, 315–320 (2009). [DOI] [PubMed] [Google Scholar]
- Wilhelm I. et al. Heterogeneity of the blood-brain barrier. Tissue Barriers. 4, e1143544 (2016). [DOI] [PMC free article] [PubMed] [Google Scholar]
- Clausen J. Proteins in normal cerebrospinal fluid not found in serum. Proc. Soc. Exp. Biol. Med. 107, 170–172 (1961). [DOI] [PubMed] [Google Scholar]
- Deseyne S., Vanhouteghem K., Hallaert G., Delanghe J. & Malfait T. Subarachnoidal-pleural fistula (SAPF) as an unusual cause of persistent pleural effusion. Beta-trace protein as a marker for SAPF. Case report and review of the literature. Acta. Clin. Belg. 70, 53–57 (2015). [DOI] [PubMed] [Google Scholar]
- Bachmann-Harildstad G. Diagnostic values of beta-2 transferrin and beta-trace protein as markers for cerebrospinal fluid fistula. Rhinology. 46, 82–85 (2008). [PubMed] [Google Scholar]
- Orenes-Piñero E. et al. β- Trace protein: from GFR marker to cardiovascular risk predictor. Clin. J. Am. So.c Nephrol. 8, 873–881 (2013). [DOI] [PubMed] [Google Scholar]
- Urade Y. & Hayaishi O. Biochemical, structural, genetic, physiological, and pathophysiological features of lipocalin-type prostaglandin D synthase. Biochim. Biophys. Acta. 1482, 259–271 (2000). [DOI] [PubMed] [Google Scholar]
- White C. A., Ghazan-Shahi S. & Adams M. A. β-Trace protein: a marker of GFR and other biological pathways. Am. J. Kidney Dis. 65, 131–146 (2015). [DOI] [PubMed] [Google Scholar]
- Hoffmann A. et al. Purification and chemical characterization of beta-trace protein from human cerebrospinal fluid: Its identification as prostaglandin D synthase. J. Neurochem. 61, 451–456 (1993). [DOI] [PubMed] [Google Scholar]
- Tabaouti K. et al. The role of biology in the diagnosis of cerebrospinal fluid leaks. Ann. Biol. Clin. 67, 141–151 (2009). [DOI] [PubMed] [Google Scholar]
- Reiber H., Walther K. & Althaus H. Beta-trace protein as sensitive marker for CSF rhinorhea and CSF otorhea. Acta Neurol. Scand. 108, 359–362 (2003). [DOI] [PubMed] [Google Scholar]
- Huggins J. T. & Sahn S. A. Duro-pleural fistula diagnosed by beta-2 transferrin. Respiration. 70, 423–425 (2003). [DOI] [PubMed] [Google Scholar]
- Prosser J. D., Vender J. R. & Solares C. A. Traumatic cerebrospinal fluid leaks. Otolaryngol. Clin. North. Am. 44, 857–873 (2011). [DOI] [PubMed] [Google Scholar]
- Mantur M. et al. Cerebrospinal fluid leakage reliable diagnostic methods. Clin. Chim. Acta. 412, 837–840 (2011). [DOI] [PubMed] [Google Scholar]
- Heyer C. M. et al. Subarachnoid-pleural fistula as a complication of malignant pleural mesothelioma. Respirology. 11, 502–505 (2006). [DOI] [PubMed] [Google Scholar]
- Durand M. L. et al. Acute bacterial meningitis in adults. A review of 493 episodes. N. Engl. J. Med. 328, 21–28 (1993). [DOI] [PubMed] [Google Scholar]
- Eljamel M. S. & Foy P. M. Acute traumatic CSF fistulae: the risk of intracranial infection. Br. J. Neurosurg. 4, 381–385 (1990). [DOI] [PubMed] [Google Scholar]
- Hoffmann A., Bächner D., Betat N., Lauber J. & Gross G. Developmental expression of murine Beta-trace in embryos and adult animals suggests a function in maturation and maintenance of blood-tissue barriers. Dev. Dyn. 207, 332–343 (1996). [DOI] [PubMed] [Google Scholar]
- Harrington M. G., Aebersold R., Martin B. M., Merril C. R. & Hood L. Identification of a brain-specific human cerebrospinal fluid glycoprotein, beta-trace protein. Appl. Theor. Electrophor. 3, 229–234 (1993). [PubMed] [Google Scholar]
- Felgenhauer K., Schädlich H. J. & Nekic M. Beta-trace protein as marker for cerebrospinal fluid fistula. Klin. Wochenschr. 65, 764–768 (1987). [DOI] [PubMed] [Google Scholar]
- Melegos D. N., Grass L., Pierratos A. & Diamandis E. P. Highly elevated levels of prostaglandin D synthase in the serum of patients with renal failure. Urology 53, 32–37 (1999). [DOI] [PubMed] [Google Scholar]
- Priem F. et al. Beta-trace protein in serum: a new marker of glomerular filtration rate in the creatinine-blind range. Clin. Chem. 45, 567–568 (1999). [PubMed] [Google Scholar]
- Priem F., Althaus H., Jung K. & Sinha P. Beta-trace protein is not better than cystatin C as an indicator of reduced glomerular filtration rate. Clin. Chem. 47, 2181 (2001). [PubMed] [Google Scholar]
- Filler G., Kusserow C., Lopes L. & Kobrzyński M. Beta-trace protein as a marker of GFR-history, indications, and future research. Clin. Biochem. 47, 1188–1194 (2014). [DOI] [PubMed] [Google Scholar]
- Duan B. et al. Serum Beta-Trace Protein as a Novel Predictor of Pregnancy-Induced Hypertension. J. Clin. Hypertens. 18, 1022–1026 (2016). [DOI] [PMC free article] [PubMed] [Google Scholar]
- Hirawa N. et al. Lipocalin-type prostaglandin d synthase in essential hypertension. Hypertension. 39, 449–454 (2002). [DOI] [PubMed] [Google Scholar]
- Orenes-Piñero E. et al. β-Trace protein: from GFR marker to cardiovascular risk predictor. Clin. J. Am. Soc. Nephrol. 8, 873–881 (2013). [DOI] [PubMed] [Google Scholar]
- Huang M. et al. Association of kidney function and albuminuria with prevalent and incident hypertension: the Atherosclerosis Risk in Communities (ARIC) study. Am. J. Kidney Dis. 65, 58–66, (2015). [DOI] [PMC free article] [PubMed] [Google Scholar]
- Yalcin M. U. et al. Elevated serum beta-trace protein levels are associated with the presence of atrial fibrillation in hypertension patients. J. Clin. Hypertens. 18, 439–443 (2015). [DOI] [PMC free article] [PubMed] [Google Scholar]
- Baranyi A. et al. Nitric Oxide-Related Biological Pathways in Patients with Major Depression. PLOS One. 10, e0143397 (2015). [DOI] [PMC free article] [PubMed] [Google Scholar]
- Baranyi A. et al. Quinolinic Acid Responses during Interferon-α-Induced Depressive Symptomatology in Patients with Chronic Hepatitis C Infection – A Novel Aspect for Depression and Inflammatory Hypothesis. PLOS One. 10, e0137022 (2015). [DOI] [PMC free article] [PubMed] [Google Scholar]
- Meinitzer A. et al. Development of a liquid chromatography-mass spectrometry method for the determination of the neurotoxic quinolinic acid in human serum. Clin. Chim. Acta. 436C, 268–272 (2014). [DOI] [PubMed] [Google Scholar]
- Heyes M. P. & Morrison P. F. Quantification of local de novo synthesis versus blood contributions to quinolinic acid concentrations in brain and systemic tissues. J. Neurochem. 8, 280–288, (1997). [DOI] [PubMed] [Google Scholar]
- Ryu J. K. & McLarnon J. G. Pyruvate blocks blood-brain barrier disruption, lymphocyte infiltration and immune response in excitotoxic brain injury. Am. J. Neurodegener. Dis. 5, 69–73, (2016). [PMC free article] [PubMed] [Google Scholar]
Associated Data
This section collects any data citations, data availability statements, or supplementary materials included in this article.