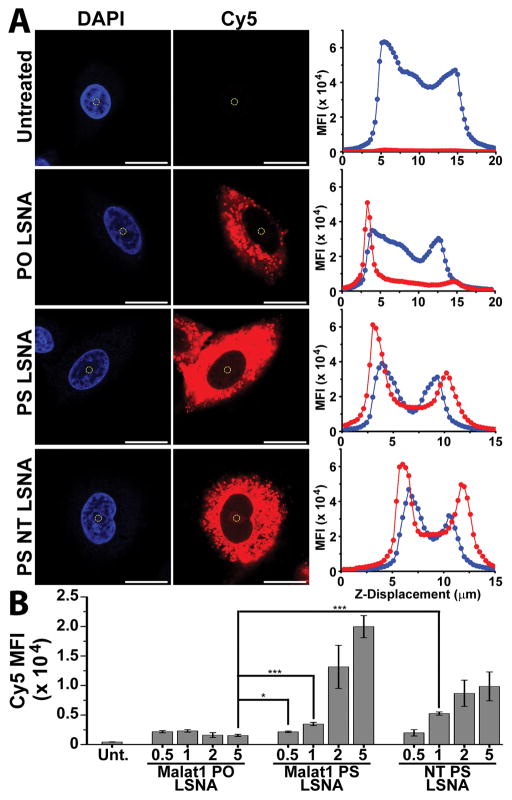
Figure 1.
(A) Representative images of Cy5-labeled LSNA uptake within the A549 cells. The DAPI and MFI intensity was measured near the center of the nucleus (yellow circle) and was used to examine the MFI through the cell in the Z-direction. (B) Mean fluorescence intensity for Cy5 at the center of the nucleus in A549 cells; *** - p<0.001; * - p<0.05; scale bar = 20 μm.

