Abstract
Nitrite infusion into the bloodstream has been shown to elicit vasodilation and protect against ischemia-reperfusion injury through nitric oxide (NO) release in hypoxic conditions. However, the mechanism by which nitrite-derived NO escapes scavenging by hemoglobin in the erythrocyte has not been fully elucidated, owing in part to the difficulty in measuring the reactions and transport on NO in vivo. We developed a mathematical model for an arteriole and surrounding tissue to examine the hypothesis that dinitrogen trioxide (N2O3) acts as a stable intermediate for preserving NO. Our simulations predict that with hypoxia and moderate nitrite concentrations, the N2O3 pathway can significantly preserve the NO produced by hemoglobin nitrite reductase in the erythrocyte and elevate NO reaching the smooth muscle cells. Nitrite retains its ability to increase NO bioavailability even at varying flow conditions, but there is minimal effect under normoxia or very low nitrite concentrations. Our model demonstrates a viable pathway for reconciling experimental findings of potentially beneficial effects of nitrite infusions despite previous models showing negligible NO elevation associated with hemoglobin nitrite reductase. Our results suggest that additional mechanisms may be needed to explain the efficacy of nitrite-induced vasodilation at low infusion concentrations.
Keywords: nitrite infusion, nitrous anhydride, dinitrogen trioxide, arteriole, hypoxic vasodilation
1. Introduction
Hypoxic vasodilation is a homeostatic mechanism providing increased blood flow and oxygen delivery to meet tissue metabolic demand [1]. The production of nitric oxide (NO) – a powerful paracrine vasodilator – by the nitrite reductase activity of deoxygenated hemoglobin (deoxyHb) has been recently proposed as a major mechanism in hypoxic vasodilation [2,3]. It is hypothesized that as NO production by oxygen-dependent endothelial nitric oxide synthase (eNOS) falls during hypoxia, deoxyHb nitrite reductase activity acts as a compensatory pathway to release NO from nitrite [4,5].
Nitrite has been shown to be a vascular storage pool for NO that is relatively nonproductive at normoxia, but provides graded generation of NO as oxygen tension decreases [6,7]. Nitrite reduction has been shown in blood and tissue mechanisms such as xanthine/aldehyde oxidase, NO synthase, components of the mitochondrial electron transport chain, and nonenzymatic acidic disproportionation [8,9]. These mechanisms require relatively extreme levels of acidosis and/or hypoxia and are not readily active under physiological hypoxia [7]. In contrast, infusions of nitrite into the bloodstream in animal and human experiments have been shown to cause vasodilation, protect from ischemia-reperfusion injury, and reduce hypertension through long-term therapy [10]. DeoxyHb acts as an allosteric nitrite reductase whose activity peaks at around the P50 of Hb due to a conformation balance between a high-activity relaxed (R) state and a low-activity tense (T) state [11].
A major challenge to the hypothesis that nitrite reduction by deoxyHb provides a mechanism for the vasodilatory effects of nitrite reduction is how NO escapes the highly effective trap environment of the erythrocyte after nitrite reduction [8]. We and others have previously shown through mathematical models that without mechanisms to limit Hb scavenging, only picomolar levels of NO would be produced outside a red blood cell (RBC) at steady state [12–14]. It has been recently proposed that an intermediate species, dinitrogen trioxide (N2O3), is generated during the nitrite-hemoglobin reaction which is stable enough to diffuse away from the RBC and release NO in tissue [15,16]. N2O3 could be a viable candidate for conserving NO since (i) it is a nitrosating species that generates S-nitrosothiols, seen during nitrite-Hb mediated vasodilation, (ii) it is small, uncharged, and relatively nonreactive with Hb, allowing it to diffuse out of the bloodstream, and (iii) it can homolyze to NO and NO2 in tissue, providing a mechanism for NO release [10,17]. Others have argued that N2O3 is energetically unfavorable [18] or is too short-lived to have a substantial role during the Hb nitrite reduction pathway, although their experimental methods may have been inadequate to detect it [19,20].
Previous mathematical models have considered the possibility of an intermediate such as N2O3 extending the diffusivity and lifetime of RBC NO, but have not explicitly modeled the pathway itself [14]. There have been several recent studies that elucidate parts of the complex nitrite reductase and anhydrase functions of hemoglobin through chemical bond modeling [16,21] and in vitro reactions [22–24]. Therefore, there is a need for mathematical simulations of this new theory to reconcile the experimental effectiveness of Hb nitrite reductase and previous theoretical simulations that predict ineffective NO conservation. The goal of this study was to determine how the inclusion of the N2O3 pathway protects Hb nitrite reductase-derived NO from erythrocyte scavenging. For this purpose, we developed a mathematical model for an arteriole and surrounding tissue to investigate the potential effect of the N2O3 pathway on blood nitrite-derived NO.
2. Methods
2.1. Description of mathematical model
Coupled nonlinear partial differential equations (PDEs) for a simple arteriole with surrounding tissue model (Fig. 1) were written in cylindrical coordinates and solved for steady-state conditions by finite element numerical methods using the software COMSOL v5.1 (COMSOL, Inc., Burlington, MA). The concentric layers are (i) red blood cell (RBC) core, (ii) a RBC-free plasma layer, (iii) endothelium, (iv) vascular wall, and (v) perivascular tissue. All layers were assumed to have homogenous properties and uniform species reactions within them.
Figure 1.
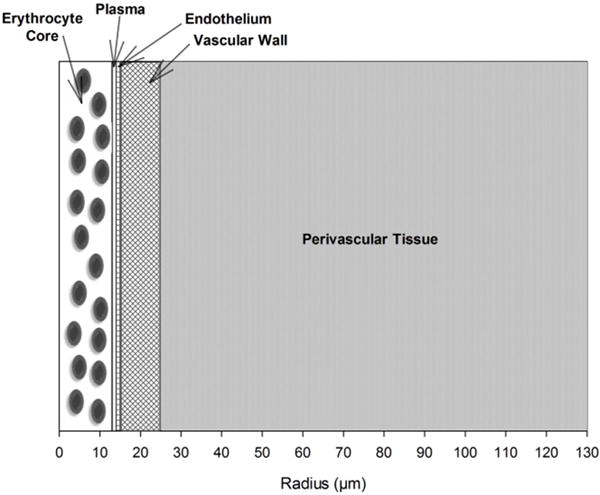
Schematic diagram of a radially concentric cylindrical model of a small arteriole and perivascular tissue.
All simulations were performed at steady-state, and concentration gradients were assumed to be axisymmetric. The diffusive component of axial gradients was assumed to be negligible. Blood flow was assumed to be well-developed laminar flow. The governing general mass transport equation therefore simplifies to Eq. (1):
| (1) |
where i corresponds to species NO, O2, N2O3, and MetHb-NO2− ↔ Hb-NO2. Each species has reactions in layers 1–5 as detailed below. Table 1 lists the dimensions and physical constants used.
Table 1.
Physical Parameters and Rate Constants
| Parameter | Value (s) | References |
|---|---|---|
| Vessel geometry | ||
| Length | 300 μm | [28] |
| Vessel Diameter | 28 μm | [28] |
| Blood (0 < r < r1) | 13 μm | [28] |
| Plasma (r1 < r < r2) | 1 μm | [28] |
| Endothelium (r2 < r r3) | 1 μm | [28] |
| Vascular Wall (r3 < r < r4 | 10 μm | [28] |
| Tissue (r4 < r < r5) | 105 μm | [28] |
| Diffusion coefficients | ||
| NO | 3300 μm2 s−1 | [28] |
| O2 | 2800 μm2 s−1 | [28] |
| N2O3 | 1000 μm2 s−1 | [2] |
| MetHb-NO2− ↔ Hb-NO2 | 75 μm2 s−1 | [29] |
| Oxygen transport | ||
| Solubility coefficient | 1.34 μM Torr−1 | [28] |
| Hill coefficient (h) | 2.84 | [30] |
| P50 | 27.37 Torr | [30] |
| NO scavenging | ||
| Hemoglobin (λb) | 382.5 s−1 | [31] |
| Tissue (λh) | 5 s−1 | [31] |
| Maximum O2 consumption: Qmax | ||
| Vascular wall | 1 μM s−1 | [31] |
| Tissue | 20 μM s−1 | [31] |
| eNOS production | ||
| Maximum RNOmax | 385.07 μM s−1 | See text |
| Km for O2-dependent production | 4.7 Torr | [28] |
| Shear equation term (τref) | 24 dyne cm−2 | [26] |
| Blood flow | ||
| Centerline vmax | 1000 μms−1 | [31] |
| Dynamic viscosity (μ) | 2.3243 mPa•s | [32] |
| Nitrite concentration range | 290nM–250μM | [6,8,33] |
| MWC parameters | ||
| L | 433,894 | [30] |
| c | 0.00805203 | [30] |
| KR | 0.994333 Torr | [30] |
| N2O3 pathway | ||
| Kd for MetHb-NO2− ↔ Hb-NO2 | 7μM | [15] |
| for N2O3 formation | 1.1 × l09M−1 s−1 | [10] |
| kh for N2O3 homolysis | 8.1 × 10⁴s−1 | [34] |
| Hemoglobin | ||
| Hb concentration | 14.55 g dL−1 | [35] |
| Molecular weight | 64.5 kDa | [35] |
| Hematocrit | 45% | [28] |
2.2. Nitric oxide
Mass transport models for NO transport have been constructed and reviewed previously [25,26], and the approach here is similar to theirs. NO production (RNO) was assumed to be uniform and confined to endothelial NOS (layer 3). NO production by eNOS was assumed to follow both linear shear stress dependence (at low shear) and O2-dependent Michaelis-Menten kinetics (Eq. 2) with all other substrates and co-factors present in abundance.
| (2) |
where Km is the Michaelis-Menten constant, and τref is the reference value used by Chen et al. [26]. was chosen so that at baseline flow, RNO matches the purely O2-dependent Michaelis-Menten values used by Buerk [25]. Shear stress was calculated using the laminar pipe flow wall shear stress Eq. (3):
| (3) |
where μb – the dynamic viscosity of blood – was calculated using the modified microvessel viscosity equation by Pries et al. [27]. In the RBC-rich layer 1, NO is scavenged by hemoglobin with first order rate λb, and is produced by nitrite reductase where it participates as a substrate in the production of N2O3. In layers 4 and 5, NO is released by N2O3 homolysis (see below) and reacts with a first order scavenging rates λt with soluble guanylyl cyclase (sGC).
2.3. Oxygen
Blood (layer 1) was assumed to provide uniform, constant O2 delivery which was independently varied between 10–80 Torr. This range of blood oxygen levels covers typical normoxia and physiological hypoxia levels where deoxyHb nitrite reductase has been experimentally effective, and does not cover more extreme pathologically hypoxic or anoxic conditions where tissue reductases are active [6,8]. This range includes the P50 of the oxyhemoglobin dissociation curve as well as the maximum nitrite reductase rate kN, which has been reported to peak between 40 – 60% of Hb saturation. The oxyhemoglobin saturation curve was characterized using a Hill equation with standard human hemoglobin alpha (HbA) values in Table 1. The amount of O2 consumed in the endothelium is twice that of NO produced. O2 consumption in the vascular wall and tissue by sGC was reversibly inhibited by NO as modeled by Buerk [25] in a modified Michaelis-Menten equation described in Eqs. (4) and (5):
| (4) |
| (5) |
where is assumed to be 1 Torr for these simulations.
2.4. Nitrite and nitrite reductase
We limited our simulation conditions to range from low infusions defined as 290 nM (about the level of basal blood nitrite) up to moderate levels (250 μM), which were assumed to be uniform and constant within the vessel lumen (layers 1 and 2). All other sources and sinks of nitrite were assumed negligible for these simulations. DeoxyHb reduces blood nitrite to form NO and methemoglobin (MetHb) in Eq. (6):
| (6) |
where the nitrite reductase bimolecular rate constant kN was characterized as a function of blood PO2 using a modified Monod-Wyman-Changeux (MWC) model of allostery [30]:
| (7) |
where kR = 17 M−1s−1 and kT=0.31 M−1s−1 were estimated from experimental data as the nitrite reductase activities of R and T state deoxyHb, respectively [30]. The MWC model and Hb parameters were estimated based on average values for human hemoglobin alpha (HbA), summarized in Table 1.
2.5. N2O3 pathway
N2O3 was produced from NO and the nitrite-methemoglobin compound catalyzed by the nitrous anhydrase activity of deoxyHb. MetHb was assumed to be produced solely by the infused nitrite and have a basal level of zero. MetHb then rapidly reacts with nitrite to form an equilibrium compound that oscillates between N-bound and O-bound nitrite states: MetHb-NO2− ↔ Hb-NO2 [15]. The diffusivity of the equilibrium compound was also assumed to be equal to that of MetHb, as MetHb is a large molecule compared with nitrite [29]. This compound then reacts with NO to generate N2O3. This reaction was assumed to occur solely in layer 1 as a result of blood nitrite as described in Eqs. (8) and (9):
| (8) |
| (9) |
where Kd is the dissociation constant for the MetHb-nitrite compound, and was assumed to be equal to the direct reaction rate between NO and NO2 to form N2O3. In tissue layers 3–5, N2O3 was assumed to then irreversibly homolyze into NO and NO2 with rate constant kh [34], shown in Eq. (10):
| (10) |
To simplify the various proposed methods of N2O3 formation and transport away from the RBC core, homolysis is assumed to be present only in layers 3–5. Hydrolysis of N2O3 in the bloodstream is assumed to be negligible [34], and other reactions for N2O3 such as nitrosation are assumed to be negligible [36,37].
2.6. Boundary conditions
For all species, zero mass fluxes were assumed at the center of the vessel (r = 0), and at the outer boundary of the tissue layer (r5), Eq. (11):
| (11) |
The mass flux of any species moving out of one layer is assumed to be equal to the mass flux entering the adjacent layer. For example, at the lumen boundary (r2), species behave as Eq. (12):
| (12) |
2.7. Numerical methods
The coupled sets of PDEs were solved in COMSOL 5.1 to steady state with a relative accuracy of 1 × 10⁻⁶ to predict concentration profiles and concentrations averaged across the SMC region (15 < r < 25 μM), and at the center of the RBC (r = 0) at the arteriole midline (z = 150 μm). Simulations were performed for constant blood nitrite infusions ranging from low near-physiological levels (290 nM) to moderate levels (250 μM) at various blood PO2 and blood flow rates to determine the effectiveness of the N2O3 pathway in conserving nitrite-derived NO.
3. Results
The oxyhemoglobin dissociation Hill equation (dashed line) and nitrite reductase rate kN (solid line) curves are plotted as a function of blood PO2 in Fig. 2 (Eq. 7). These equations were parameterized using average adult human values for HbA in Table 1 for these simulations. The maximum kN of 0.3929 M−1 s−1 occurs where the slope of the oxyhemoglobin dissociation curve (dS/dPO2) is maximal at PO2 = 27.24 Torr, slightly below the P50 = 27.37 Torr.
Figure 2.
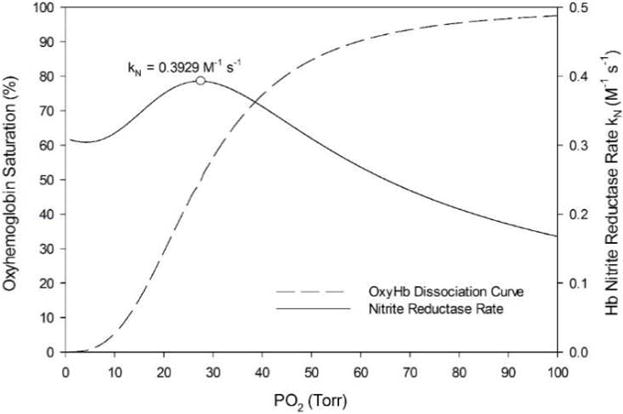
Oxyhemoglobin saturation curve (dashed line) and nitrite reductase rate (solid line). The saturation curve is characterized by the Hill equation using approximated values for HbA: h = 2.84 and P50 = 27.37 Torr. The maximum kN of 0.3929 M−1 s−1 occurs at blood PO2 = 27.24 Torr (circle).
NO bioavailability drops across the entire domain as blood PO2 levels decrease (Fig. 3). The average NO in the SMC region (15 < r < 25 μm) drops non-linearly (Fig. 3 inset) from 41.98 nM to 29.49 nM (29.8%) as blood PO2 drops from normal to low hypoxia levels (80 to 10 Torr), respectively.
Figure 3.
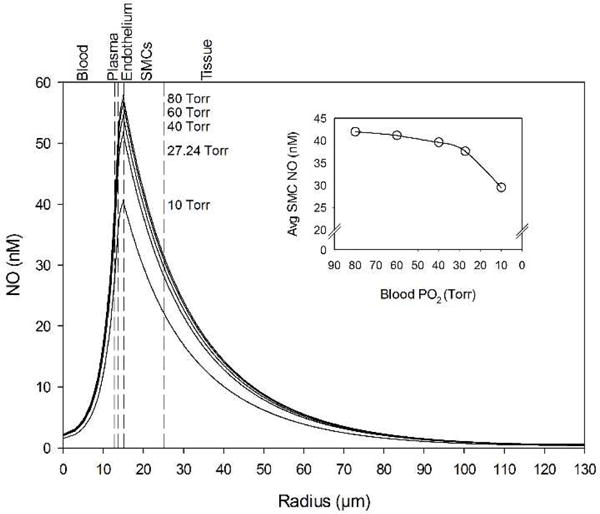
NO concentration profiles across the computational domain for various blood PO2 concentrations. (Inset) Average NO concentration in the smooth muscle cell region between the endothelium and the perivascular tissue (15 < r < 25 μm) for the same blood O2 concentrations. The vertical dashed lines mark boundaries between the five radial model layers labeled above the graph.
The effect of 250 μM blood nitrite infusions on SMC NO at the boundary point without the N2O3 pathway — i.e. only Eq. 6 for nitrite-derived NO — for blood PO2 = 10 Torr (solid line) and 27.24 Torr (dashed line) was compared with baseline, no nitrite infusion NO (Fig. 4). 250 μM nitrite infusion with blood PO2 = 10 Torr was predicted to elevate the average SMC NO by 0.232 nM above the baseline; the same infusion with blood PO2 = 27.24 Torr resulted in 0.154 nM elevation.
Figure 4.
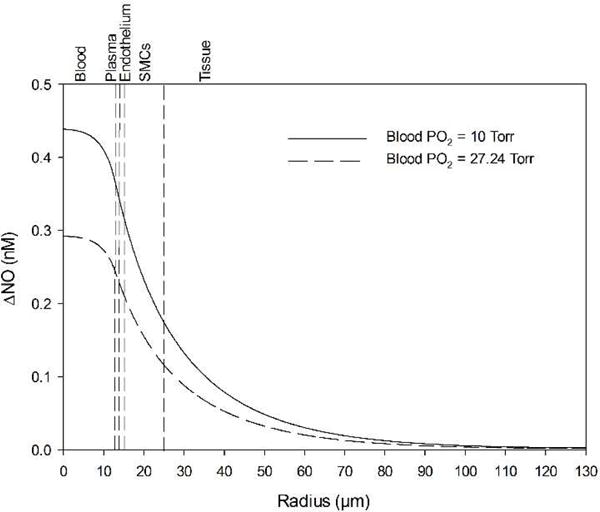
Effect of blood nitrite infusions on baseline NO (Fig. 3) without the N2O3 pathway, only direct nitrite reduction by Hb. A moderate level of 250 μM nitrite is used. Case 1 (solid line) represents infusions at blood PO2 = 27.24 Torr for which the kN value is maximum. Case 2 (dashed line) represents infusions at the lowest oxygen level used for this study (blood PO2 =10 Torr). The vertical dashed lines mark boundaries between the five radial model layers labeled above the graph.
When the N2O3 pathway was simulated, a 250 μM nitrite infusion produced a significant increase in NO concentration at all radial positions in the vessel wall and surrounding tissue (Fig. 5). The effect was more pronounced at low blood PO2 levels of 10 Torr (Fig. 5A) compared to 27.24 Torr (Fig. 5B). A 100 μM nitrite infusion produced a much smaller response. Fig. 6 shows the predicted values for the average SMC NO (15 < r < 25 μm, Fig. 6A) and RBC center (r = 0 μm, Fig. 6B). Increasing nitrite infusions leads to increased SMC NO, but reduces RBC NO. N2O3 is generated in the RBC layer and diffuses to the endothelium where it rapidly homolyzes to NO and NO2 (Eq. 10). N2O3 homolyzes to 1% of its RBC value approximately 3 μm outward from the RBC-plasma boundary for a nitrite infusion of 250 μM at blood PO2 = 10 Torr (not shown). At blood PO2 = 27.24 Torr, increasing nitrite infusions from 1 to 250 μM results in RBC N2O3 values from 1 to 80 nM and endothelium N2O3 values from 0.1 to 5 nM. Table 2 summarizes the predicted changes in NO in Fig. 6.
Figure 5.
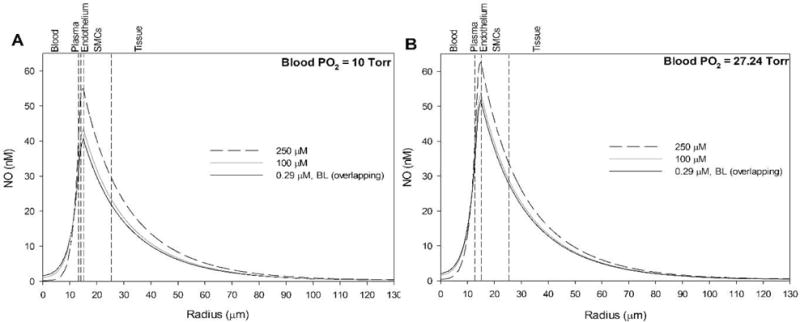
Effect of blood nitrite infusions on NO profiles with the hypothesized N2O3 pathway. Nitrite is varied from 290 nM (solid black line) to 100 μM (solid grey line) to 250 μM (dashed black line) and compared against baseline (no nitrite, overlapping with solid black line) at blood PO2 values of (A) 10 Torr and (B) 27.24 Torr. The vertical dashed lines mark boundaries between the five radial layers labeled above the graphs. Note that the baseline NO profile (no nitrite, solid black line) is indistinguishable from the low nitrite infusion prediction (290 nM).
Figure 6.
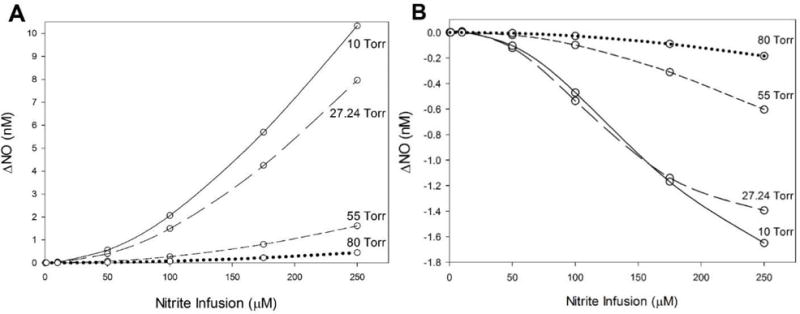
Effect of blood nitrite infusions with the proposed N2O3 pathway on (A) average SMC NO (15 < r < 25 μm) and (B) RBC layer center (r = 0 μm) NO compared with baseline NO. Blood PO2 levels are varied from 10 Torr to 80 Torr.
Table 2.
Effect of Nitrite Infusions on NO at RBCs and Across SMCs
| Nitrite Infusion Concentrations | |||||||
|---|---|---|---|---|---|---|---|
|
| |||||||
| Blood PO2 (Torr) | Baseline NO (nM) | 10 μM | 50 μM | 100 μM | 250 μM | ||
| RBC | 10 | 1.56 | ΔNO (nM) | +0.0017 | −0.121 | −0.536 | −1.39 |
| 27.24 | 1.99 | +0.0013 | −0.104 | −0.471 | −1.65 | ||
| 55 | 2.16 | 0* | −0.020 | −0.098 | −0.60 | ||
| 80 | 2.22 | 0* | −0.005 | −0.027 | −0.18 | ||
|
| |||||||
| Avg. SMC | 10 | 29.5 | ΔNO (nM) | +0.030 | +0.559 | +2.07 | +10.33 |
| 27.24 | 37.6 | +0.021 | +0.396 | + 1.49 | +7.96 | ||
| 55 | 40.9 | +0.004 | +0.071 | +0.271 | +1.61 | ||
| 80 | 42.0 | 0* | +0.020 | +0.074 | +0.44 | ||
Changes in NO below 1 pM are reported as zero
NO production by the endothelium was shear stress dependent (Eq. 2), and thus the relative effect of nitrite on NO concentration may depend on the flow rate. Blood flow was varied by ± 20% from a baseline centerline velocity of 1000 μm s−1, and the effect of these changes on the baseline NO profile was simulated for the hypoxic condition when the blood PO2 = 10 Torr (Fig. 7). Low flow is defined as 800 μm s−1 (dashed line), baseline as 1000 μm s−1 (solid line), and high flow as 1200 μm s−1 (dotted line). Decreasing flow decreases NO availability across the radius, and increased flow increases NO availability.
Figure 7.
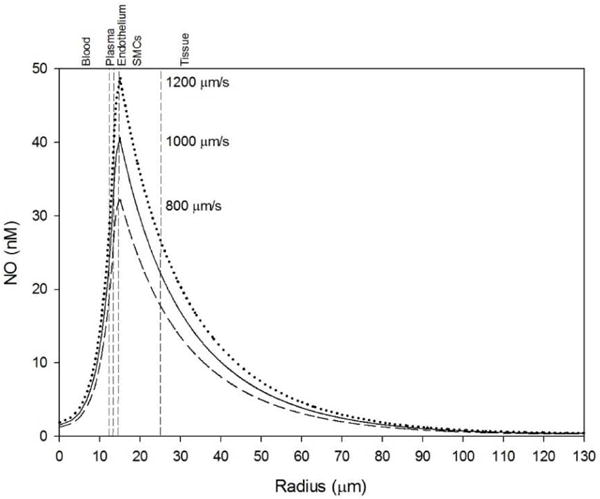
Effect of blood flow changes on baseline NO profile at blood PO2 = 10 Torr. Low (dashed line), baseline (solid line), and high (dotted line) flow were defined as 800, 1000, and 1200 μm s−1 centerline velocities, respectively. The vertical dashed lines mark boundaries between the five radial layers labeled above the graphs.
The effect of 250 μM nitrite infusion (solid lines) was compared to baseline NO (dotted lines) at flow rates: low and high (circles and crosses, respectively) at various blood PO2 levels (Fig. 8). Table 3 shows SMC NO elevations at 250 μM nitrite infusion for low and high blood flow rates. Nitrite shows consistent ability to elevate SMC NO at low and high flow conditions (within 5% of the baseline flow values), but the relative elevation compared to baseline NO is more impactful with lower flow rates.
Figure 8.
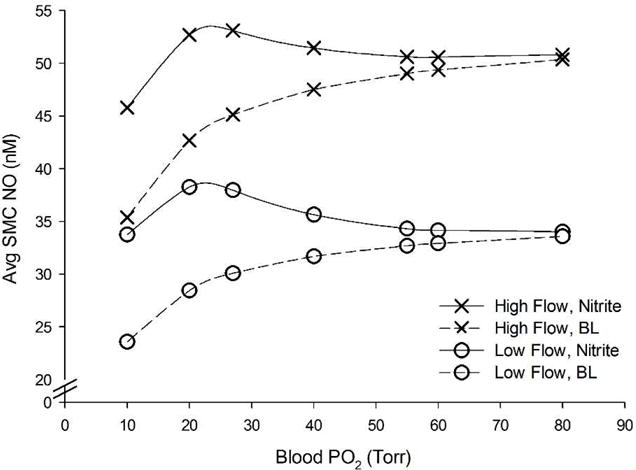
Effect of flow changes and 250 μM nitrite infusion on average SMC NO concentration compared over a range of blood oxygen levels. Circles and crosses correspond to low (800 um s−1) and high (1200 um s−1) flow, respectively. Dashed lines and solid black lines correspond to no nitrite and 250 μM nitrite, respectively. The baseline flow values fell in between low and high flow rates and are not shown for clarity.
Table 3.
Effect of 250 μM Nitrite Infusion on Avg. SMC NO with Varying Blood Flow
| Blood PO2 (Torr) | 10 Torr | 20 Torr | 27.24 Torr | 40 Torr | 55 Torr | 60 Torr | 80 Torr |
|---|---|---|---|---|---|---|---|
| Low Flow ΔNO (nM) | 10.15 | 9.82 | 7.89 | 3.97 | 1.63 | 1.23 | 0.45 |
| BL Flow ΔNO (nM) | 10.33 | 9.96 | 7.97 | 3.96 | 1.61 | 1.21 | 0.44 |
| High Flow ΔNO (nM) | 10.40 | 10.01 | 7.97 | 3.92 | 1.58 | 1.19 | 0.44 |
A sensitivity analysis for the model parameters was performed using small variations (± 5%) in eight key parameters to examine the resulting change in: SMC-endothelium boundary NO (r = 15 μm) in Fig. 9A, and RBC NO (r = 0 μm) in Fig. 9B. For the boundary SMC NO, the sensitivity was very low for all of the parameters except for blood viscosity μb, which had a positive correlation due to the shear-dependent eNOS production term in the model (Eq. 2). For RBC NO, the two significant parameters are the N2O3 formation rate with a negative correlation, and the MetHb-NO −2 ↔ Hb-NO2 dissociation constant Kd with a positive correlation.
Figure 9.

Sensitivity analysis showing the effect of minor variations (± 5%) in model parameters (listed at right) on relative differences in NO at (A) the endothelium-SMC boundary (r = 15 μm) and (B) at the RBC center (r = 0 μm) for Fig. 5A with 250 μM nitrite infusion.
4.1 Discussion
Our computational model is the first attempt to simulate the proposed N2O3 mechanism for preserving NO generated from nitrite infusions into the bloodstream. Our predicted value of 0.3929 M−1 s−1 for the maximum global bimolecular Hb nitrite reduction rate constant kN is similar to experimentally reported values of 0.35 [4], 0.47 [11], and 1.0 M−1 s−1 [38]. Rong et al. normalized these and other experimental findings accounting for different values of hemoglobin, nitrite, and oxygen and concluded that all previous experiments had maximum kN around 0.4 M−1 s−1 [30,39]. Using experimentally reported values of R and T-state hemoglobin reductase (kR and kT, respectively), our modified nitrite reductase model predicts maximum kN values in a narrow range from 0.3929 to 0.4036 M−1 s−1. Our model demonstrates that without the N2O3 pathway, even moderate levels of nitrite infusion and low blood oxygen tensions have little effect on NO elevation in the SMC layer. As Fig. 3 shows, decreasing blood oxygen tension significantly decreases the bioavailability of NO in SMC across the arteriole wall. At the blood PO2 (10 Torr) where nitrite reduction produces the most NO, the elevation with 250 μM nitrite is very small, <0.5 nM all across the arteriole wall (Fig. 4). This prediction is in agreement with previous models showing negligible contribution from Hb nitrite reductase at hypoxia when there is no N2O3 intermediate pathway [12–14].
With the inclusion of the N2O3 pathway, our simulations predict that with moderate infusion levels, nitrite reductase can produce a significant elevation in vascular wall NO under moderate to severe hypoxic conditions (Fig. 5). 250 μM nitrite elevates the boundary SMC NO by 7.97 and 10.33 nM at blood PO2 levels = 27.24 and 10 Torr, respectively (Fig. 6). This is significant since experimental evidence has shown that changes in NO on the nanomolar scale (~5 nM) can cause vasodilation [1,6]. A decrease in blood PO2 from 80 to 10 Torr can result a 12.5 nM decrease in the average SMC NO, and moderate levels of nitrite can largely compensate for this lost NO. Nitrite infusions of approx. >175 μM are capable of raising the boundary SMC NO by >5 nM beginning at hypoxic levels around the maximum nitrite reductase rate (blood PO2 = 27.24 Torr). The model predicts that both conditions are necessary to significantly elevate SMC NO; high levels of nitrite infusion with normoxia or low levels at hypoxia are not sufficient. Nitrite reduction is negligible with normoxia because nitrite reductase activity is lower for T state Hb, and there is less deoxyHb available as a substrate (Eq. 6).
As nitrite infusions and SMC NO increase (Fig. 6A), RBC NO decreases (Fig. 6B). A nitrite infusion of 250 μM at 10 Torr decreases RBC NO by −1.39 nM, with a corresponding SMC elevation of 10.33 nM (Table 2), indicating that the released NO from N2O3 is able to diffuse into the SMC and perivascular tissue regions. The decrease of NO in the RBC region despite infusion of nitrite raising SMC NO is consistent with our understanding of the preservation role of N2O3. In layer 1, NO is consumed faster by the N2O3 generation reaction (Eq. 9) than it is generated by the reaction of nitrite with deoxyHb (Eq. 6). This N2O3 then diffuses from the RBCs and to the endothelium and tissue, where it rapidly homolyzes to raise NO. This NO then diffuses to and significantly elevates SMC NO. This mechanism could explain the paradoxical effectiveness of nitrite-derived NO in blood reaching the SMC despite erythrocyte scavenging.
These results are in partial agreement with experimental studies on vasodilatory effects in vivo by nitrite infusions. N2O3 and other nitroso species are difficult to trap and measure, and it was only recently demonstrated that the MetHb-NO2 − ↔ Hb-NO2 compound is a plausible and energetically favorable species that was invisible to electron paramagnetic resonance spectroscopy in the past [15,16]. Because of this experimental difficulty, we are only able to evaluate our model prediction using experimental data on the oxygen and concentration conditions where it has been established that blood nitrite has a physiological effect. Potent vasodilation has been shown to be linked directly to NO release in mice, rats, sheep, dogs, primates, and humans [33]. Forearm brachial artery infusions of nitrite have been shown to increase forearm blood flow both during and before physiological hypoxia induced by exercise [33]. Nitrite infusions as low as near physiological (hundreds of nM) and moderate levels (hundreds of μM) have been shown to cause arteriolar vasodilation in vivo, and under exercise stress they act as quickly as 15 seconds to several minutes post infusion [11,40]. Our results are consistent with experimental evidence that vasodilation through moderate levels of nitrite infusion into the bloodstream increases in effectiveness as hypoxia increases [4,6,33]. Some studies have shown that low levels of nitrite and mild hypoxia or normoxia are sufficient to cause vasodilation, which is not fully explained by our model [11,33]. These results could be explained by the presence of other active nitrite reduction mechanisms [6,7].
We incorporated a shear stress dependence into eNOS NO production (Eq. 2) as in our previous model [26] in order to determine if the NO response to nitrite infusion changed with different flow rates. Blood flow changes of 20% to the baseline centerline velocity of 1000 μm s−1 significantly changes SMC NO from shear-dependent eNOS (Fig. 7). For example, for blood PO2 = 10 Torr: low, normal, and high flow simulations predict baseline average SMC NO of 23.6, 29.5, and 35.4 nM NO, respectively. Increased flow can compensate for reduced NO production at low blood oxygen levels. Nitrite infusions consistently elevate SMC NO under hypoxia even at different flow rates, but the relative elevation is higher at low flow rates due to the lower baseline NO from less shear-dependent production. At low flow, nitrite infusion can actually elevate SMC NO above the normoxic, no nitrite NO values across the whole range of blood PO2. 250 μM nitrite infusion at blood PO2 = 10 Torr results in 10.15, 10.33, and 10.40 nM SMC NO elevation (43.0, 35.0, and 29.4%, respectively) at low, normal, and high blood flow rates, respectively (Fig. 8). There is also a range of blood oxygen levels, approx. 20–30 Torr, where 250 μM nitrite can raise the SMC NO above the normoxic levels, showing that nitrite infusions can fully recover NO shortage in hypoxia (Fig. 8).
4.2 Model Limitations
The disparity between our results showing high levels of nitrite needed and experimental evidence showing lower effective concentration could be explained by several possible limitations of our model. We have assumed that N2O3 irreversibly forms in the RBC and participates only in the homolysis reaction in tissue layers 3–5 once it escapes the RBCs, but we have not modeled a mechanism besides diffusion that could affect its movement away from the blood. Hypotheses for additional barriers and facilitators of N2O3 transport include compartmentalization within the RBC allowing for enhanced N2O3 formation, diffusion across hydrophobic membranes such as aquaporin or Rhesus channels, or nitrosation of membrane proteins or L-cysteine followed by transportation through the linker-for-activation of T cells (LAT) membrane transporter [10,15]. More detailed assessment of these mechanisms is needed to evaluate the transport of N2O3 once it is formed inside the RBC layer. There is also controversy regarding the exact values of rate constants involved in the N2O3 pathway, due to experimental difficulty in measuring species in vivo [15,34]. The sensitivity analysis showed that these parameters – and, indirectly, Kd of the nitrite-methemoglobin compound) – have a strong influence on the NO concentration. As indicated previously, N2O3 is rapidly homolyzed and penetrates only a few microns into the endothelium and SMC layer, reaching a concentration of ~5 nM at the endothelium for a 250 μM nitrite infusion at blood PO2 = 27.24 Torr. It has also been suggested that N2O3 would lead to an increase in reactive oxygen or nitrogen species, such as peroxynitrite, which could have adverse effects in this region, but it is not clear what concentrations are toxic [9,41]. Furthermore, N2O3 has been hypothesized to be involved in the nitrosation of thiols, one of the most important being glutathione (GSH), but this hypothesis has been challenged by recent experiments showing NO2 as the more significant contributor [37]. Despite this, S-nitrosothiols such as GSNO and other nitrosated products such as SNO-Hb have been shown to increase during nitrite infusion experiments [15,17]. This suggests the nitrite-methemoglobin interaction at least in part participates in redox cycling and nitrosylation reactions that can generate additional nitrite and NO, not just N2O3 [10]. Stamler, Rifkind and colleagues have proposed a major role for SNO-Hb in preserving blood NO [42,43], but this has been challenged by multiple laboratory groups [2,44,45]. Others have hypothesized that thiols, N2O3 isomers, and other nitroso species could also play a role in allowing NO to survive the RBC trap environment [6,20]. These alternative pathways and their effect on NO released from infused nitrite are not fully understood, and modeling them is an area of potential future study.
A more complete assessment of these different pathways and their effects on the spatial gradients of all related species will require more detailed modeling of NO transport. Interactions between N2O3 and reactive oxygen and nitrogen species are also important to consider for the nitrite reductase activity of hemoglobin. We [28,46] and others [47,48] have modeled reactive oxygen and nitrogen species in blood and tissue, and the role of N2O3 in these complex reactions is another area of potential future study. The model can also be expanded to consider additional oxygen ranges and sources of nitrite reduction. There are multiple other mechanisms that are active under deeper hypoxia and anoxia, and it is possible that the in vivo human studies on nitrite reduction involve some of them. These pathways are mainly enzymatic mechanisms such as xanthine oxidase, myoglobin, and aldehyde oxidase that reduce perivascular tissue nitrite [6,49], which are outside the scope of this study but are a subject of potential future study.
4.3 Conclusions
Our model demonstrates that under certain conditions, the N2O3 pathway can significantly preserve the NO produced by blood infusions of nitrite and elevate the vascular wall NO. This effect increases as hypoxia increases, reaches a maximum at the lowest PO2 value, and increases nonlinearly with increasing nitrite concentration. The model predicts minimal effects at normoxia or for lower nitrite concentrations. This model does not fully explain how low levels of nitrite can still elicit vasodilation as observed in vivo, and more detailed modeling of secondary N2O3 pathways and their role in nitrite-NO interactions are required for future studies. Nevertheless, these results provide insight into the mechanisms by which nitrite infusion can cause vasodilation despite the NO-scavenging environment of RBC hemoglobin.
Highlights.
The N2O3 pathway enhances NO availability from hemoglobin nitrite reductase.
Hypoxia and moderate levels of nitrite are required to produce significant nitric oxide.
This nitric oxide enhancing mechanism is consistent at different blood flow rates.
This model does not fully explain how low nitrite levels can cause vasodilation.
Acknowledgments
This work was supported by HL 116256 from NIH.
Footnotes
Publisher's Disclaimer: This is a PDF file of an unedited manuscript that has been accepted for publication. As a service to our customers we are providing this early version of the manuscript. The manuscript will undergo copyediting, typesetting, and review of the resulting proof before it is published in its final citable form. Please note that during the production process errors may be discovered which could affect the content, and all legal disclaimers that apply to the journal pertain.
References
- 1.Gladwin MT, Raat NJH, Shiva S, Dezfulian C, Hogg N, Kim-Shapiro DB, et al. Nitrite as a vascular endocrine nitric oxide reservoir that contributes to hypoxic signaling, cytoprotection, and vasodilation. Am J Physiol Heart Circ Physiol. 2006;291:H2026–H2035. doi: 10.1152/ajpheart.00407.2006. [DOI] [PubMed] [Google Scholar]
- 2.Gladwin MT, Kim-Shapiro DB. The functional nitrite reductase activity of the heme-globins. Blood. 2008;112:2636–2647. doi: 10.1182/blood-2008-01-115261. [DOI] [PMC free article] [PubMed] [Google Scholar]
- 3.Huang KT, Keszler A, Patel N, Patell RP, Gladwin MT, Kim-Shapiro DB, et al. The reaction between nitrite and deoxyhemoglobin: Reassessment of reaction kinetics and stoichiometry. J Biol Chem. 2005;280:31126–31131. doi: 10.1074/jbc.M501496200. [DOI] [PubMed] [Google Scholar]
- 4.Huang Z, Shiva S, Kim-Shapiro DB, Patel RP, Ringwood LA, Irby CE, et al. Enzymatic function of hemoglobin as a nitrite reductase that produces NO under allosteric control. J Clin Invest. 2005;115:2099–107. doi: 10.1172/JCI24650. [DOI] [PMC free article] [PubMed] [Google Scholar]
- 5.Patel RP, Hogg N, Kim-Shapiro DB. The potential role of the red blood cell in nitrite-dependent regulation of blood flow. Cardiovasc Res. 2011;89:507–15. doi: 10.1093/cvr/cvq323. [DOI] [PMC free article] [PubMed] [Google Scholar]
- 6.Van Faassen EE, Bahrami S, Feelisch M, Hogg N, Kelm M, Kozlov AV, et al. Nitrite as regulator of hypoxic signaling in mammalian physiology. Med Res Rev. 2010;29:683–741. doi: 10.1002/med.20151. [DOI] [PMC free article] [PubMed] [Google Scholar]
- 7.Lundberg JO, Weitzberg E, Gladwin MT. The nitrate-nitrite-nitric oxide pathway in physiology and therapeutics. Nat Rev Drug Discov. 2008;7:156–167. doi: 10.1038/nrd2466-c2. [DOI] [PubMed] [Google Scholar]
- 8.Gladwin MT, Crawford JH, Patel RP. The biochemistry of nitric oxide, nitrite, and hemoglobin: role in blood flow regulation. Free Radic Biol Med. 2004;36:707–17. doi: 10.1016/j.freeradbiomed.2003.11.032. [DOI] [PubMed] [Google Scholar]
- 9.Feelisch M, Fernandez BO, Bryan NS, Garcia-Saura MF, Bauer S, Whitlock DR, et al. Tissue processing of nitrite in hypoxia: An intricate interplay of nitric oxide-generating and -scavenging systems. J Biol Chem. 2008;283:33927–33934. doi: 10.1074/jbc.M806654200. [DOI] [PMC free article] [PubMed] [Google Scholar]
- 10.Gladwin MT, Grubina R, Doyle MP. The new chemical biology of nitrite reactions with hemoglobin: R-state catalysis, oxidative denitrosylation, and nitrite reductase/anhydrase. Acc Chem Res. 2009;42:157–67. doi: 10.1021/ar800089j. [DOI] [PubMed] [Google Scholar]
- 11.Cosby K, Partovi KS, Crawford JH, Patel RP, Reiter CD, Martyr S, et al. Nitrite reduction to nitric oxide by deoxyhemoglobin vasodilates the human circulation. Nat Med. 2003;9:1498–1505. doi: 10.1038/nm954. [DOI] [PubMed] [Google Scholar]
- 12.Buerk DG, Barbee KA, Jaron D. Modeling O2-dependent effects of nitrite reductase activity in blood and tissue on coupled NO and O2 transport around arterioles. Adv Exp Med Biol. 2011;701:271–276. doi: 10.1007/978-1-4419-7756-4. [DOI] [PubMed] [Google Scholar]
- 13.Chen K, Piknova B, Pittman RN, Schechter AN, Popel AS. Nitric oxide from nitrite reduction by hemoglobin in the plasma and erythrocytes. Nitric Oxide. 2008;18:47–60. doi: 10.1016/j.niox.2007.09.088. [DOI] [PMC free article] [PubMed] [Google Scholar]
- 14.Jeffers A, Xu X, Huang KT, Cho M, Hogg N, Patel RP, et al. Hemoglobin mediated nitrite activation of soluble guanylyl cyclase. Comp Biochem Physiol A Mol Integr Physiol. 2005;142:130–5. doi: 10.1016/j.cbpb.2005.04.016. [DOI] [PubMed] [Google Scholar]
- 15.Basu S, Grubina R, Huang J, Conradie J, Huang Z, Jeffers A, et al. Catalytic generation of N2O3 by the concerted nitrite reductase and anhydrase activity of hemoglobin. Nat Chem Biol. 2007;3:785–794. doi: 10.1038/nchembio.2007.46. [DOI] [PubMed] [Google Scholar]
- 16.Hopmann KH, Cardey B, Gladwin MT, Kim-Shapiro DB, Ghosh A. Hemoglobin as a nitrite anhydrase: Modeling methemoglobin-mediated N 2O3 formation. Chem - A Eur J. 2011;17:6348–6358. doi: 10.1002/chem.201003578. [DOI] [PMC free article] [PubMed] [Google Scholar]
- 17.Robinson JM, Lancaster JR. Hemoglobin-mediated, hypoxia-induced vasodilation via nitric oxide: Mechanism(s) and physiologic versus pathophysiologic relevance. Am J Respir Cell Mol Biol. 2005;32:257–261. doi: 10.1165/rcmb.F292. [DOI] [PubMed] [Google Scholar]
- 18.Koppenol WH. Nitrosation, thiols, and hemoglobin: energetics and kinetics. Inorg Chem. 2012;51:5637–41. doi: 10.1021/ic202561f. [DOI] [PMC free article] [PubMed] [Google Scholar]
- 19.Mikulski R, Tu C, Swenson ER, Silverman DN. Reactions of nitrite in erythrocyte suspensions measured by membrane inlet mass spectrometry. Free Radic Biol Med. 2010;48:325–31. doi: 10.1016/j.freeradbiomed.2009.11.003. [DOI] [PMC free article] [PubMed] [Google Scholar]
- 20.Tu C, Mikulski R, Swenson ER, Silverman DN. Reactions of nitrite with hemoglobin measured by membrane inlet mass spectrometry. Free Radic Biol Med. 2009;46:14–9. doi: 10.1016/j.freeradbiomed.2008.09.016. [DOI] [PMC free article] [PubMed] [Google Scholar]
- 21.Berto TC, Lehnert N. Density functional theory modeling of the proposed nitrite anhydrase function of hemoglobin in hypoxia sensing. Inorg Chem. 2011;50:7361–3. doi: 10.1021/ic2003854. [DOI] [PubMed] [Google Scholar]
- 22.Goetz BI, Shields HW, Basu S, Wang P, King SB, Hogg N, et al. An electron paramagnetic resonance study of the affinity of nitrite for methemoglobin. Nitric Oxide. 2010;22:149–54. doi: 10.1016/j.niox.2009.10.009. [DOI] [PMC free article] [PubMed] [Google Scholar]
- 23.Tejero J, Basu S, Helms C, Hogg N, King SB, Kim-Shapiro DB, et al. Low NO Concentration Dependence of Reductive Nitrosylation Reaction of Hemoglobin. J Biol Chem. 2012;287:18262–18274. doi: 10.1074/jbc.M111.298927. [DOI] [PMC free article] [PubMed] [Google Scholar]
- 24.Roche CJ, Cassera MB, Dantsker D, Hirsch RE, Friedman JM. Generating S-Nitrosothiols from Hemoglobin: MECHANISMS, CONFORMATIONAL DEPENDENCE, AND PHYSIOLOGICAL RELEVANCE. J Biol Chem. 2013;288:22408–22425. doi: 10.1074/jbc.M113.482679. [DOI] [PMC free article] [PubMed] [Google Scholar]
- 25.Buerk DG. Can We Model Nitric Oxide Biotransport? A Survey of Mathematical Models for a Simple Diatomic Molecule with Surprisingly Complex Biological Activities. Annu Rev Biomed Eng. 2001;3:109–143. doi: 10.1146/annurev.bioeng.3.1.109. [DOI] [PubMed] [Google Scholar]
- 26.Chen X, Buerk DG, Barbee KA, Kirby P, Jaron D. 3D network model of NO transport in tissue. Med Biol Eng Comput. 2011;49:633–647. doi: 10.1007/s11517-011-0758-7. [DOI] [PubMed] [Google Scholar]
- 27.Pries AR, Secomb TW, Gessner T, Sperandio MB, Gross JF, Gaehtgens P. Resistance to blood flow in microvessels in vivo. Circ Res. 1994;75:904–15. doi: 10.1161/01.RES.75.5.904. [DOI] [PubMed] [Google Scholar]
- 28.Buerk DG, Lamkin-Kennard K, Jaron D. Modeling the influence of superoxide dismutase on superoxide and nitric oxide interactions, including reversible inhibition of oxygen consumption. Free Radic Biol Med. 2003;34:1488–1503. doi: 10.1016/S0891-5849(03)00178-3. [DOI] [PubMed] [Google Scholar]
- 29.Keller KH, Friedlander SK. Diffusivity Measurements of Human Methemoglobin. J Gen Physiol. 1966;49:681–687. doi: 10.1085/jgp.49.4.681. [DOI] [PMC free article] [PubMed] [Google Scholar]
- 30.Rong Z, Wilson MT, Cooper CE. A model for the nitric oxide producing nitrite reductase activity of hemoglobin as a function of oxygen saturation. Nitric Oxide - Biol Chem. 2013;33:74–80. doi: 10.1016/j.niox.2013.06.008. [DOI] [PubMed] [Google Scholar]
- 31.Buerk DG. Mathematical Modeling of The Interaction Between Oxygen, Nitric Oxide And Superoxide. Adv Exp Med Biol. 2009;645:7–12. doi: 10.1007/978-0-387-85998-9_2. [DOI] [PubMed] [Google Scholar]
- 32.Buerk DG, Barbee KA, Jaron D. Nitric oxide signaling in the microcirculation. Crit Rev Biomed Eng. 2011;39:397–433. doi: 10.1615/critrevbiomedeng.v39.i5.40. [DOI] [PMC free article] [PubMed] [Google Scholar]
- 33.Dejam A, Hunter CJ, Tremonti C, Pluta RM, Hon YY, Grimes G, et al. Nitrite infusion in humans and nonhuman primates: endocrine effects, pharmacokinetics, and tolerance formation. Circulation. 2007;116:1821–31. doi: 10.1161/CIRCULATIONAHA.107.712133. [DOI] [PubMed] [Google Scholar]
- 34.Butler AR, Ridd JH. Formation of nitric oxide from nitrous acid in ischemic tissue and skin. Nitric Oxide - Biol Chem. 2004;10:20–24. doi: 10.1016/j.niox.2004.01.004. [DOI] [PubMed] [Google Scholar]
- 35.McPherson RA, Pincus MR. Henry’s Clinical Diagnosis and Management by Laboratory Methods. 22nd. Elsevier Saunders; Philadelphia: 2011. pp. 550–1486. [Google Scholar]
- 36.Keshive M, Singh S, Wishnok JS, Tannenbaum SR, Deen WM. Kinetics of S-nitrosation of thiols in nitric oxide solutions. Chem Res Toxicol. 1996;9:988–993. doi: 10.1021/tx960036y. [DOI] [PubMed] [Google Scholar]
- 37.Madrasi K, Joshi MS, Gadkari T, Kavallieratos K, Tsoukias NM. Glutathiyl radical as an intermediate in glutathione nitrosation. Free Radic Biol Med. 2012;53:1968–76. doi: 10.1016/j.freeradbiomed.2012.08.013. [DOI] [PMC free article] [PubMed] [Google Scholar]
- 38.Doyle MP, Pickering RA, DeWeert TM, Hoekstra JW, Pater D. Kinetics and mechanism of the oxidation of human deoxyhemoglobin by nitrites. J Biol Chem. 1981;256:12393–12398. http://www.jbc.org/content/256/23/12393.short (accessed May 13, 2016) [PubMed] [Google Scholar]
- 39.Cantu-Medellin N, Vitturi DA, Rodriguez C, Murphy S, Dorman S, Shiva S, et al. Effects of T- and R-state stabilization on deoxyhemoglobin-nitrite reactions and stimulation of nitric oxide signaling. Nitric Oxide. 2011;25:59–69. doi: 10.1016/j.niox.2011.01.006. [DOI] [PMC free article] [PubMed] [Google Scholar]
- 40.Maher AR, Milsom AB, Gunaruwan P, Abozguia K, Ahmed I, Weaver Ra, et al. Hypoxic modulation of exogenous nitrite-induced vasodilation in humans. Circulation. 2008;117:670–677. doi: 10.1161/CIRCULATIONAHA.107.719591. [DOI] [PubMed] [Google Scholar]
- 41.Wink DA, Darbyshire JF, Nims RW, Saavedra JE, Ford PC. Reactions of the bioregulatory agent nitric oxide in oxygenated aqueous media: Determination of the kinetics for oxidation and nitrosation by intermediates generated in the nitric oxide/oxygen reaction. Chem Res Toxicol. 1993;6:23–27. doi: 10.1021/tx00031a003. [DOI] [PubMed] [Google Scholar]
- 42.Stamler JS. Blood Flow Regulation by S-Nitrosohemoglobin in the Physiological Oxygen Gradient. Science (80−) 1997;276:2034–2037. doi: 10.1126/science.276.5321.2034. [DOI] [PubMed] [Google Scholar]
- 43.Rifkind JM, Nagababu E, Ramasamy S. The quaternary hemoglobin conformation regulates the formation of the nitrite-induced bioactive intermediate and the dissociation of nitric oxide from this intermediate. Nitric Oxide. 2011;24:102–9. doi: 10.1016/j.niox.2011.01.001. [DOI] [PMC free article] [PubMed] [Google Scholar]
- 44.Helms C, Kim-Shapiro DB. Hemoglobin-mediated nitric oxide signaling. Free Radic Biol Med. 2012;29:997–1003. doi: 10.1016/j.biotechadv.2011.08.021.Secreted. [DOI] [PMC free article] [PubMed] [Google Scholar]
- 45.Kim-Shapiro DB, Schechter AN, Gladwin MT. Unraveling the reactions of nitric oxide, nitrite, and hemoglobin in physiology and therapeutics., Arterioscler. Thromb Vasc Biol. 2006;26:697–705. doi: 10.1161/01.ATV.0000204350.44226.9a. [DOI] [PubMed] [Google Scholar]
- 46.Buerk DG. Mathematical modeling of the interaction between oxygen, nitric oxide and superoxide. Adv Exp Med Biol. 2009;645:7–12. doi: 10.1007/978-0-387-85998-9_2. [DOI] [PubMed] [Google Scholar]
- 47.Deonikar P, Kavdia M. A computational model for nitric oxide, nitrite and nitrate biotransport in the microcirculation: Effect of reduced nitric oxide consumption by red blood cells and blood velocity. Microvasc Res. 2010;80:464–476. doi: 10.1016/j.mvr.2010.09.004. [DOI] [PMC free article] [PubMed] [Google Scholar]
- 48.Kavdia M. A Computational Model for Free Radicals Transport in the Microcirculation. Antioxid Redox Signal. 2006;8:1103–1111. doi: 10.1089/ars.2006.8.1103. [DOI] [PubMed] [Google Scholar]
- 49.Duranski MR, Greer JJM, Dejam A, Jaganmohan S, Hogg N, Langston W, et al. Cytoprotective effects of nitrite during in vivo ischemia-reperfusion of the heart and liver. J Clin Invest. 2005;115:1232–40. doi: 10.1172/JCI22493. [DOI] [PMC free article] [PubMed] [Google Scholar]


