

Abstract
Motorcycle crashes result in a significant health burden, including many fatal injuries and serious non-fatal head injuries. Helmets are highly effective in preventing such trauma, and jurisdictions that require helmet use of all motorcyclists have higher rates of helmet use and lower rates of head injuries among motorcyclists. The current study examines helmet use and characteristics of helmeted operators and their riding conditions in Michigan, following a weakening of the state's universal motorcycle helmet use law in April 2012. Data on police-reported crashes occurring during 2012–14 and from a stratified roadside observational survey undertaken in Southeast Michigan during May-September 2014 were used to estimate statewide helmet use rates. Observed helmet use was more common among operators of sports motorcycles, on freeways, and in the morning, and least common among operators of cruisers, on minor arterials, and in the afternoon. The rate of helmet use across the state was estimated at 75%, adjusted for roadway type, motorcycle class, and time of day. Similarly, the helmet use rate found from examination of crash records was 73%. In the observation survey, 47% of operators wore jackets, 94% wore long pants, 54% wore boots, and 80% wore gloves. Protective clothing of jackets and gloves was most often worn by sport motorcycle operators and long pants and boots most often by riders of touring motorcycles. Findings highlight the much lower rate of helmet use in Michigan compared with states that have a universal helmet use law, although the rate is higher than observed in many states with partial helmet laws. Targeted interventions aimed at specific groups of motorcyclists and situations where helmet use rates are particularly low should be considered to increase helmet use.
Keywords: Motorcycle, Helmet, Observation study, Helmet law, Crash data
1. Introduction
1.1. Burden of motorcyclists' injuries and benefits of helmets
Fatal and non-fatal motorcycle crashes are a significant public health burden in the United States, resulting in 4295 deaths and 92,000 non-fatal injuries in 2014 (Institute for Highway Safety [IIHS], 2016a, 2016b). Although motorcycles represented only 3% of registered vehicles in 2014, motorcyclists accounted for 13% of all traffic fatalities (Federal Highway Administration, 2015; IIHS, 2016a). There is clear evidence regarding the effectiveness of helmets in preventing and reducing the severity of head injuries (Cook et al., 2009; Crompton et al., 2010; Houston and Richardson, 2008; Markogiannakis et al., 2006; Mayrose, 2008). Non-helmeted motorcyclists, compared with those wearing helmets, have a 40% increased risk of a fatal head injury and a 15% increased risk of a non-fatal head injury (National Highway Traffic Safety Administration [NHTSA], 2008). NHTSA (2014) estimated that the lives of 1630 motorcyclists were saved in 2013 because they were wearing a helmet.
1.2. Universal helmet laws
As of March 2016, only 19 states and the District of Columbia have universal helmet laws, and laws requiring some motorcyclists' use are in place in 28 states (IIHS, 2016c). There is no motorcycle helmet use law in Illinois, Iowa, or New Hampshire. Helmet use rates are consistently higher in states with universal helmet laws (Mayrose, 2008; NHTSA, 2008). In 2014, 91% of motorcyclists who died in crashes in states with universal helmet use laws were wearing helmets, compared with 40% in states with partial helmet use laws and 28% in states without universal helmet use laws (IIHS, 2016a). Using data from the National Occupant Protection Use Survey (NHTSA, 2015), observed use of DOT-compliant helmets (i.e., helmets that meet federal performance standards for preventing injury or death and excluding helmets often referred to as “novelty helmets”) in 2014 was 89% in states with universal helmet laws and 48% in other states.
1.3. Factors associated with helmet use
1.3.1. Use of crash and observational data
An examination of the factors associated with helmet use may provide a foundation for targeting public health intervention strategies. While previous research has identified correlates of increased crash risk among motorcyclists, few studies have looked at factors associated with helmet use or non-use. This study examines such factors using observational and crash data following the repeal of a universal helmet law. We also examine the likely degree of concordance between rates of helmet use in crash data and rates observed in roadside surveys, which gives insight into the potential value of using more readily collected crash data in understanding the characteristics of those who use a helmet. This is particularly important given the expense and challenge of conducting observational studies that reflect a representative sample of motorcyclists within a state. Crash data, however, are routinely collected by U.S. states and may provide a useful and inexpensive estimate of overall helmet use and could help target public health campaigns in states without universal laws. This approach has been useful in estimating seat belt use rates. After correction for sample selection, data on seatbelt use in fatal crashes from NHTSA's FARS database produced comparable estimates to observed seat belt use from the National Occupant Protection Use Survey (Islam and Goetzke, 2009).
1.3.2. Identified factors associated with helmet use
Some previous research suggests that helmet use varies depending on the road type, weather conditions, and day of the week. NHTSA's National Occupant Protection Use Survey examines various factors related to observed compliant helmet use. In the most recent 2014 national survey (NHTSA, 2015), helmets were worn more frequently on expressways (81%) compared with surface streets (58%), and more often in fast traffic (72%) compared with medium-speed (57%) and slow traffic (62%). Also, there was some greater use in clear weather (65%) compared with light precipitation (55%), and similar rates of use on weekends (64%) and weekdays (65%). Gkritza (2009) examined factors associated with helmet use in an observational survey. The study was conducted in Iowa between 2000 and 2006 and found 36% use rates among operators and 39% among passengers. There were higher rates of helmet use early in the riding season (April compared with August) and in the morning (7–10 am) compared with later in the day (10 am–3 pm or 3 pm–6 pm). Helmet use rates were also higher on freeways/arterial roads compared with local roads, and on cloudy or rainy days compared with sunny days. The study did not examine motorcycle class, day of the week, or driver age or sex. Another observational study found that motorcyclists on weekends (compared with weekdays) were more likely to wear non-DOT-compliant (i.e., novelty) helmets than DOT-compliant helmets in a jurisdiction with a universal helmet use law (Peek-Asa et al., 1999).
There is evidence that self-reported helmet use (McCartt et al., 2011) and helmet use in crashes differ by motorcycle class. Helmet use among fatally injured motorcyclists during 2000 and 2003–08 was highest among those on sport motorcycles (82%) and lowest for those on cruiser, standard, and touring motorcycles (49% each) (Teoh and Campbell, 2010). Further, based on Ohio police-reported crash data from 2006 to 2010, Schneider et al. (2012) reported that riding a newer motorcycle and being at fault in a crash were associated with lower helmet use rates.
1.4. Study objective
Helmet use is associated with reduced head injuries and fatalities (Cook et al., 2009; Crompton et al., 2010; Markogiannakis et al., 2006; Mayrose, 2008; NHTSA, 2014). On April 13, 2012, Michigan implemented a partial repeal of the universal motorcycle helmet use law. The current Michigan law requires motorcyclists younger than age 21 to wear DOT-compliant helmets on public roadways (Michigan Legislature, 2012). The law also requires unhelmeted motorcyclists age 21 or older to have at least $20,000 in health insurance coverage and to either have passed a motorcycle safety course or have held a motorcycle endorsement for a minimum of 2 years.
The current study examines helmet use among motorcyclists in Michigan following the partial repeal of the universal helmet use law. A prior statewide roadside observational survey in Michigan that was weighted by motorcycle registrations estimated helmet use to be 73% in 2013 (Savolainen et al., 2013), but it is unknown if this rate remained stable in subsequent years or how this rate compares with helmet use in crash data. The study uses observational data collected in 2014 to estimate overall helmet use and to examine differences in helmet use by roadway type, time of day, and day of week. We also observed characteristics of helmeted operators, including the type of helmet used and class of motorcycle ridden. The study aim is thus to estimate state-wide use and understand characteristics of helmet users following the repeal of a universal helmet law.
2. Method
Observational data of motorcycles and motorcycle operators were collected on roadways in Southeast Michigan to identify helmet use and were combined with data on helmet use among operators involved in police-reported crashes to produce statewide helmet use estimates. Use of other protective gear (jacket, pants, footwear, gloves) was also observed. More detail on data sources and analysis methods appears below.
2.1. Observation data
2.1.1. Observation sites: roadway type and selection
The observational survey of motorcycle helmet use was conducted in seven counties of Southeast Michigan. The area is the most populous part of Michigan and reflects both urban and rural areas. The National Functional Classification (NFC), a system that classifies roads according to type on a scale of 1–7 (Michigan Department of Transportation [MDOT], 2014a), and traffic volume were utilized to select sites. Selected observation sites included interstates and freeways (NFC 1 and 2), principal arterials (NFC 3, typically connecting routes between cities within urban areas), minor arterials (NFC 4, connecting routes more local in nature), and minor roadways (NFC 5, 6, and 7, collector roads, e.g., serving schools, business, and residential areas or other local roads). Average vehicle miles travelled (VMT) on NFC classified roads across all of Michigan for all vehicle types suggests that interstates/freeways (NFC 1 and 2) accounted for 16% of total VMT, principal arterials (NFC 3) accounted for 22% of total VMT, and minor arterials (NFC 4) accounted for 23% of total VMT in 2013 (Michigan Department of Transportation (MDOT, 2014b).
Sites were randomly selected using random number allocation to the target area (e.g., to rest stop and to mile markers). For each potential site, recent crime activity was examined; three sites were determined to be unsafe and the next random selection was used (The Omega Group, 2014). Using Google Maps, Satellite View (Google Maps, 2014), each site was then examined to ensure there was a place to conduct observations that was safe and provided a good view of the roadway. This resulted in the exclusion of several additional potential sites. Finally, each remaining site was inspected in person to ensure it was safe and provided adequate visibility, and was replaced at random if deemed inappropriate. In anticipation of potential impediments to daily observations (e.g., construction), at each location the closest site that met the selection criteria was selected as a secondary site. Three sites were replaced with secondary sites due to unforeseen conflicts (e.g., construction work).
Data were collected across 10 rest area stops on freeways, 10 traffic-signal or stop-sign-controlled intersections on principal arterials, and 10 traffic-signal or stop-sign-controlled intersections on minor arterials. In total, 488 observations were conducted on freeways and 410 observations were conducted on principal arterials. We initially selected an additional 10 sites on minor roadways (NFC 5, 6, or 7). However, these sites were discontinued after 2 months due to infrequent observations of motorcyclists; none were made on NFC 6/7 roads and 18 were made on NFC 5 roads. The observations made on NFC 5 roads were combined with those made on minor arterials (n = 428, NFC categories ≥4).
2.1.2. Observational data collection procedure
Observations were conducted for 1 h at each site in sunny or overcast weather. All motorcycles and mopeds and their operators (i.e., not passengers) were eligible for observation. Each observer recorded descriptive site information at the beginning of the observation period including the date, site location, start time, weather condition (rating scale of 1–6, with 1 completely sunny and 6 completely overcast, collapsed into 1–3 = sunny and 4–6 = cloudy), as well as any additional notes about the site and observations. At the conclusion of observations, the end time was recorded. For each operator, a research assistant recorded helmet type (none, full face, open face, half helmet, novelty, or unknown) and motorcycle class (cruiser, touring, moped, sports, standard three-wheeler, Spyder, or unknown), as defined in Table 1. Use of other protective gear was also recorded including jacket, pants, footwear, and gloves.
Table 1.
Definition of key characteristics observed of helmet type and motorcycle class.
| Observation feature | Key characteristic |
|---|---|
| Helmet type | |
| Full face | Covers entire head, face, and jaw |
| Open face | Covers entire head and ears but not the rest of the face or jaw |
| Half helmet | Covers entire head but not ears, face, and jaw |
| Novelty | Covers entire head but not ears, face, and jaw; differs from half helmet because of less padding and fits closer to the head; not approved as a protective device by U.S. DOT |
| Motorcycle class | |
| Cruiser | Driver sitting upright, legs positioned in front or straight below torso; front wheel often extended well in front; if a windshield present, often small |
| Sports | Driver leaning forward with legs and feet positioned behind rider torso |
| Touring | Driver sitting upright in seat that is often wide and heavily cushioned, legs positioned in front or straight below torso; large windshield; often have built-in luggage carrier |
| Standard/on-off road | Driver sitting upright, legs positioned below torso; narrow frame and high ground clearance; front fender high above the front wheel |
| Moped/scooter/underbones | Driver sitting upright, legs positioned on a front platform (moped/scooter); motorcycle built around a single tube frame (underbones) |
| Three-wheeler | One front wheel, two back wheels |
| CAN-AM Spyder | Two front wheels, one back wheel |
| Options for protective gear | |
| Jacket | Leather/long sleeve, short sleeve, no shirt |
| Pants | Long pants, shorts |
| Footwear | Boots, tennis shoes, sandals/flip flops, bare feet |
| Gloves | Full gloves, fingerless gloves, no gloves |
Data collection began on May 20, 2014 and concluded September 30, 2014, excluding federal holidays. Observation periods were balanced across time of day and day of week. If the weather forecast predicted a high probability of precipitation or if rain occurred during the observation period, the observation was rescheduled. Many observations were in sunny weather (n = 825 for sunny, n = 529 for cloudy). Observations were conducted during selected time blocks that were randomly selected for the day of the week of the observation until quotas for road type and time block were reached. This included observations on each day of the week (n = 526 for weekends, n = 829 for weekdays) and throughout the day at each site in one-hour block increments in the morning (n = 424 for 7:30–8:30 am and 9–10 am), afternoon (n = 612 for 3:30–4:30 pm), and evening (n = 317 for both 5–6 pm observations and twilight/dusk observations ranging from 8 to 10 pm during the study period). The twilight/dusk observations always occurred while it was light enough to view passing vehicles; in the last few weeks of data collection this necessitated finishing slightly earlier (approximately 9:45 pm). The number of motorcycles observed and coded per site ranged from 7 to 140. No observations were conducted after dark due to limited visibility and safety considerations.
Two research assistants used pen and paper to code observations at each site. The assistants observed opposite directions of traffic, except on freeways where motorcycles traveling in one direction (nearest to the rest stop) were observed and independently coded by both assistants. The data collected on freeways were used to assess inter-observer agreement, resulting in kappa = 0.85 (0.79–91), p < 0.001, for helmet use. This included 451 cases that matched and 10 instances of conflict.
2.1.3. Training observers
Observers completed a 2-day training session. Training was completed approximately 1 week before the first day of data collection and consisted of a lecture and field data collection/practical assessment. In addition, a comprehensive training manual was given to the observers. The practical assessment included an opportunity to receive, respond to, and discuss specific guidelines regarding observations. Detailed definitions and pictures of motorcycle classes, helmets, and protective gear were provided to observers during training and distinguishing features were described. Novelty helmets, for example, were described as being recognized by their close-fit appearance, only being enough larger than the rider's head to allow the head to fit inside. We noted that they often, but not always, appear much like the half helmets, covering only the top of the head, but may be distinguished by their close-fitting appearance. Distinguishing features for identifying the sex of operators were discussed in group training.
Observers participated in multiple practice site visits during training. A field audit was also conducted by research staff throughout the duration of the study, with each observer monitored during at least one observation. Each observer was debriefed at least weekly to ensure adherence to the protocol.
2.2. Michigan state crash data
Data on police-reported motorcycle crashes, defined as those occurring on public roadways and resulting in fatal or non-fatal injury or property damage exceeding $1000, were obtained from the traffic crash reporting unit of the Michigan Criminal Justice Information Center. Data were selected for all of Michigan from April 13, 2012, the effective date of the helmet law change, to September 30, 2014. Both two- and three-wheeled motorcycles were included. Crash data were then selected by time of day (7 am–10 pm) to match the observations. The data extracted included operator helmet use (yes/no); helmet type is not identified in the crash data, and thus novelty helmets are likely counted. Operator helmet use was unknown in 2% of motorcycle crashes; these crashes were excluded from analyses.
Weather conditions, roadway type, day of week, and time of day also were extracted and coded to reflect the categories of the observational data. Further, motorcycle class was identified using vehicle identification numbers, and the class data were categorized to match the motorcycle classes used during the observations. There were few road-side observations of Spyders and three-wheelers, and crashes involving these motorcycle classes were excluded from the analyses. This resulted in the following categories of motorcycle classes: cruiser (includes cruiser and chopper), touring, sport (including sport, super sport, and unclad sport), and standard (including dual purpose, off-road, and standard).
2.3. Data analysis
Initial descriptive calculations (e.g., percentages) were performed on observed data with chi-squared tests conducted to examine the distribution of helmet types by motorcycle class, number of motorcycles riding together, rider sex, road type, weather and time of day (Table 2). Monte Carlo Estimates of Exact test was used when there were small cell size. While we observed mopeds (n = 39), we excluded them from analyses given that Michigan's universal helmet law before the partial repeal only applied to adult riders of some mopeds (those with engine displacements greater than 50 cc or that could attain speeds greater than 30 mph). Data from roadside observations in the southeastern region of the state and state crash data were combined to estimate statewide helmet use rates. Helmet use rates in the crash data reflect both exposure (on-road helmet use rates per mile travelled) and the relative probability with which helmet users and non-users are involved in police-reported crashes. Because novelty helmet use could not be determined in crash data, novelty helmet users in observation data are treated as helmet users in the analyses. Since the estimated use rate is meant to be for all operators rather than crash-involved operators, we chose to weight by number of motorcycles observed per hour (by condition) rather than weighting by crash involvement.
Table 2.
Number and percentages of motorcycle class, motorcycle operator characteristics, and riding conditions for each helmet type from roadside observations.
| Characteristic | None | Full face | Open face | Half | Novelty | Total helmet use (including novelty) | ||||||
|---|---|---|---|---|---|---|---|---|---|---|---|---|
|
|
|
|
|
|
|
|||||||
| N | % | N | % | N | % | N | % | N | % | N | % | |
| TOTAL (N= 1290) | 298 | 23.1 | 425 | 33.0 | 201 | 15.6 | 267 | 20.7 | 98 | 7.6 | 991 | 76.8 |
| Motorcycle class (p***)a | ||||||||||||
| Cruiser (n = 704) | 177 | 25.1 | 131 | 18.6 | 129 | 18.3 | 191 | 27.1 | 76 | 10.8 | 527 | 74.9 |
| Touring (n = 277) | 101 | 36.5 | 37 | 13.4 | 60 | 21.7 | 60 | 21.7 | 19 | 6.9 | 176 | 63.5 |
| Sport (n = 297) | 16 | 6.0 | 241 | 89.9 | 2 | 0.8 | 7 | 2.6 | 2 | 0.8 | 281 | 94.6 |
| Three-wheeler (n= 12) | 3 | 25.0 | 0 | 0 | 3 | 25.0 | 5 | 41.7 | 1 | 8.3 | 9 | 75.0 |
| Standard (n= 17) | 0 | 0 | 12 | 70.6 | 3 | 17.7 | 2 | 11.8 | 0 | 0 | 17 | 100 |
| Spyder(n = 8) | 0 | 0 | 3 | 37.5 | 4 | 50.0 | 1 | 12.5 | 0 | 0 | 8 | 100 |
| Riding with other motorcyclists | (χ2(4) = 1.6, ns) | |||||||||||
| Yes (n = 125) | 29 | 23.2 | 38 | 30.4 | 17 | 13.6 | 30 | 24.0 | 11 | 8.8 | 96 | 76.8 |
| No (n = 1164) | 269 | 23.1 | 387 | 33.3 | 184 | 15.8 | 237 | 20.4 | 87 | 7.5 | 895 | 76.9 |
| Rider sex (χ2(4)=3.9, ns) | ||||||||||||
| Male (n = 1162) | 292 | 25.1 | 343 | 29.5 | 179 | 15.4 | 256 | 22.0 | 92 | 7.9 | 870 | 73.0 |
| Female (n = 30) | 4 | 13.3 | 11 | 36.7 | 7 | 23.3 | 5 | 16.7 | 3 | 10.0 | 26 | 86.7 |
| Road type (χ2(8) = 39.4***) | ||||||||||||
| Freeway (n = 480) | 83 | 17.3 | 180 | 37.5 | 96 | 20.0 | 97 | 20.2 | 24 | 5.0 | 397 | 82.0 |
| Arterial (n = 409) | 105 | 25.7 | 134 | 32.8 | 51 | 12.5 | 90 | 22.0 | 29 | 7.1 | 304 | 74.3 |
| Minor arterial (n = 400) | 110 | 27.5 | 111 | 27.8 | 54 | 13.5 | 80 | 20.0 | 45 | 11.3 | 290 | 72.5 |
| Weather (χ2 (4) = 3.0, ns) | ||||||||||||
| Sunny (n = 783) | 173 | 22.1 | 253 | 32.3 | 129 | 16.5 | 163 | 20.8 | 64 | 8.2 | 609 | 77.8 |
| Cloudy (n = 507) | 125 | 24.7 | 172 | 33.9 | 72 | 14.2 | 104 | 20.5 | 34 | 6.7 | 382 | 75.4 |
| Time of day (χ2(8) = 25.7**) | ||||||||||||
| Morning (n = 402) | 64 | 15.9 | 152 | 37.8 | 80 | 19.9 | 76 | 18.9 | 30 | 7.5 | 338 | 84.1 |
| Afternoon (n = 582) | 152 | 26.1 | 175 | 30.1 | 81 | 13.9 | 127 | 21.8 | 47 | 8.1 | 430 | 73.9 |
| Evening (n=304) | 81 | 26.6 | 98 | 32.2 | 40 | 13.2 | 64 | 21.1 | 21 | 6.9 | 223 | 73.4 |
| Day of week (χ2(4) = 2.0, ns) | ||||||||||||
| Weekday (n = 786) | 173 | 22.0 | 283 | 36.0 | 122 | 15.5 | 145 | 18.5 | 63 | 8.0 | 613 | 78.0 |
| Weekend (n = 503) | 125 | 24.9 | 142 | 28.2 | 79 | 15.7 | 122 | 24.3 | 35 | 7.0 | 378 | 75.2 |
Note: Percents may not sum to 100, due to rounding. N represents cases with known helmet types.
p<0.05.
p<0.01.
p<0.001.
Monte Carlo Estimate for Exact Test.
These analyses assume that the relative crash risk for helmet users and non-users is consistent across the state within certain categories (e.g., daytime), that is, such a relationship is no different in the southeastern region as compared to the remainder of the state. Eq. (1) uses Bayes' Rule to show that the relative probability of crashing for helmeted versus unhelmeted motorcyclists is equal to the ratio of the odds of being helmeted in crashes and the odds of being helmeted in the population:
| (1) |
where C indicates a crash and H indicates helmet use.
As this ratio is assumed to be the same for the southeastern region and the entire state, the odds of helmet use for the entire state can be estimated as BS = BR (AS/AR), where the subscript S indicates data at the state level and the subscript R indicates data at the region level.
Helmet use odds in the crash populations (AS and AR) were obtained from the state and region crash data. The helmet use odds in the region (BR) was estimated from roadside observations, within condition (e.g., time of day, motorcycle class).
The selection of conditions for analysis was done using logistic regression. Since many of the predictors of helmet use (e.g., motorcycle class and road type) were moderately correlated, we used the logistic regression equations to predict the probability of helmet use in the observed population and in the crash population as a function of a specific set of conditions. Predictors in the logistic regression model using the observation data were selected first. A backwards stepwise approach was used and, after removing predictors that did not meet a p < 0.05 criterion (using a Type III F test for the predictor as a whole), the remaining predictors defined the set of conditions under which both observed and crash-based helmet use ORs were calculated. Interactions between the remaining predictors were tested for significance.
A second logistic regression was conducted using the crash data from southeast Michigan. This regression was constrained to use the same predictors as the observation data, even if they were not significant. All cases without missing values on relevant variables were then grouped according to values of the predictors in the observation data model. For each unique combination of predictor values, we then computed the estimated risk ratio of crashing with and without a helmet under that condition. This was computed as the ratio of the estimated odds ratio (OR) for helmet use among the crash population to the estimated OR for helmet use in the observed population (Eq. (1)). The observed regional helmet use OR for each category was divided by the estimated risk ratio to get the estimated helmet OR for that category across Michigan. Finally, the OR was transformed to a helmet use rate for that category. The overall Michigan estimated helmet use rate was computed as the weighted average use rate across the categories weighted by the motorcycles-per-hour of observation rate from the observation data.
Bootstrapping was used to estimate confidence intervals (Efron and Tibshirani, 1994). We selected 1000 pairs of independent bootstrap samples from the crash data and the observation data. From each pair, we recomputed the estimated helmet use rate for Michigan using the process described above. The 95th percentile confidence limits on the helmet use rate were constructed from percentiles of the bootstrap results.
3. Results
3.1. Characteristics of observed motorcycle operators by helmet use and type
A total of 1290 motorcycle operators were observed across all sites. Helmets were worn by 76.5% ± 2.2% of observed motorcycle operators. There were statistically significant differences in the distribution of helmet types by motorcycle class, road type, and time of day (Table 2).
We observed that motorcyclists riding sport, standard, and Spyder motorcycles more often wore helmets compared with riders of other motorcycle classes, although the number of riders observed on standard and Spyder motorcycles was small. The most common helmet type observed was full-face helmets, which were worn by about a third of operators. A half-helmet was the most commonly used helmet among operators of cruisers and three-wheelers. Novelty helmets were used by 8% of operators and were most often worn by operators of cruiser, touring, or three-wheeler motorcycles. Further, fewer motorcyclists on arterial roads (minor or major) were observed wearing helmets compared with those riding on freeways. Motorcyclists riding in the afternoon and evening were less likely to wear helmets compared with those riding in the morning. Most motorcycle operators were not travelling in a group of motorcyclists (n = 1164, 90%), but some were traveling with others (n = 125, 10%). Operators were typically male (n = 1162, 97%).
3.2. Observed motorcycle operator use of protective clothing and helmets
In addition to helmets, the observers also coded protective clothing. Here we observed overall, 47% of operators wore jackets, 94% wore long pants, 54% wore boots, and 81% wore gloves, although there was 51% missing observation of gloves/no gloves (Table 3). Driver helmet type varied by whether the rider wore boots, a jacket, or gloves, but not long pants. Riders wearing full-face helmets were more likely to be wearing a jacket and gloves, but less likely to be wearing boots than riders wearing other helmet types. Those operators wearing full-face helmets wore jackets (69%) more often than those using other helmet types, and those wearing novelty helmets (34%) or no helmets (20%) wore jackets least often. Around two-thirds of operators of sport motorcycles wore jackets and two-thirds of operators of touring motorcycles wore boots. Those wearing full-faced helmets were observed least often to wear boots compared with operators wearing other types of helmets or no helmets.
Table 3.
Descriptive statistics of protective clothing by helmet use and motorcycle class.
| Jacket N= 1268 | Long pants N = 1283 | Boots N = 1286 | Gloves N = 681 | |||||
|---|---|---|---|---|---|---|---|---|
|
|
|
|
|
|||||
| n | % | n | % | n | % | n | % | |
| Percent of all riders with each clothing item | 598 | 47.1 | 1207 | 94.1 | 696 | 54.1 | 551 | 80.9 |
| Percent of riders in each motorcycle class with each clothing item | χ2(3) = 47.2*** | χ2(3) = 6.5, ns | χ2(3) = 70.1*** | χ2(3) = 49.4*** | ||||
| Cruiser | 292 | 41.9 | 662 | 94.3 | 419 | 59.5 | 275 | 77.7 |
| Touring | 116 | 43.0 | 265 | 96.0 | 175 | 63.2 | 92 | 69.7 |
| Sport | 183 | 65.1 | 263 | 92.3 | 96 | 33.7 | 179 | 96.8 |
| Three-wheeler | 7 | 35.0 | 17 | 85.0 | 6 | 30.0 | 5 | 50.0 |
| Percent of riders in each helmet type with each clothing item | χ2(4)= 181.7*** | χ2(4) = 6.0, ns | χ2 (4) = 47.7*** | χ2(4) = 172.5*** | ||||
| Full face | 292 | 69.5 | 395 | 93.2 | 175 | 41.0 | 290 | 98.0 |
| Open face | 101 | 51.8 | 189 | 95.5 | 118 | 58.7 | 93 | 85.3 |
| Half | 114 | 43.2 | 257 | 96.6 | 168 | 63.2 | 103 | 76.3 |
| Novelty | 33 | 34.0 | 90 | 91.8 | 66 | 67.4 | 22 | 55.0 |
| Any | 540 | 54.5 | 931 | 94.3 | 526 | 52.2 | 509 | 88.5 |
| None | 58 | 19.9 | 276 | 92.9 | 170 | 57.2 | 43 | 42.6 |
Note: Ns in tables are number of riders in each cell (i.e., numerator of percentage). For some cases motorcycle class and helmet type were coded as ‘unknown’ by the observers (<2%). For 47% of observations, the presence of gloves was not coded by observers. Observations where protective clothing use, helmet use, or motorcycle class was unknown are excluded. The denominator in each case is the number of riders observed for each characteristic, excluding unknowns.
p<0.05.
p<0.01.
p<0.001.
3.3. Helmet use estimations
Logistic regression was used to model helmet use from the observation data. The starting set of predictors was road type, motorcycle class, time of day (morning, afternoon, evening), driver sex, weather (cloudy vs. sunny), and weekday/weekend. Associations between pairs of these variables were assessed using chi-square tests. Weekend riding was associated with motorcycle class (χ2(2) = 7.6, p = 0.02), time of day (χ2(2) = 33.0, p < 0.001), and road type (χ2(2) = 23, p < 0.001). Road type was associated with weather (χ2(2) = 23.0, p < 0.001) and time of day (χ2(2) = 38.1, p < 0.001). Finally, time of day and weather were associated (χ2(2) = 7.8, p = 0.02). Using a backwards stepwise approach, the final set of predictors were road type, motorcycle class, and time of day. There were no significant interactions among these variables in predicting helmet use, so the final model consisted of three main effects. The model coefficients and F tests are shown in Table 4.
Table 4.
Results of logistic regression predicting helmet use for observation data.
| Estimate | Standard Error | t Value | Pr > |t| | |
|---|---|---|---|---|
| Road Type (F(1,1242) = 17.14; p < 0.001) | ||||
| Reference group: Interstate/freeway | ||||
| Non-interstate/freeway road (NFC ≥ 3) | −0.64 | 0.15 | −4.14 | <0.001 |
| Motorcycle class (F(2,1242) = 32.02; p <0.001) | ||||
| Reference group: Cruiser | ||||
| Sport | 1.74 | 0.28 | 6.19 | <0.001 |
| Touring | −0.61 | 0.16 | −3.91 | <0.001 |
| Time of Day (F(2, 1242) = 7.88; p < 0.001) | ||||
| Reference group: Morning | ||||
| Afternoon | −0.66 | 0.17 | −3.77 | <0.001 |
| Evening | −0.64 | 0.20 | −3.22 | <0.001 |
-2LL difference from null: 125.2.
In the crash data, the overall rate of helmet use was 72.9% ± 1.1%, and in the Southeast Michigan subsample was 73.9% ± 1.7%. Model coefficients and F tests for the same model as above but using crash data from Southeast Michigan are shown in Table 5. In both analyses, compared with operators riding cruisers, those riding sports motorcycles were more likely to wear helmets, and those riding touring motorcycles were less likely to wear them. Compared with riding in the morning, those riding in the afternoon and evening were less likely to wear helmets. Compared with riding on a highway, those riding on arterials were less likely to wear helmets (found in the observation data only).
Table 5.
Results of logistic regression predicting helmet use for southeast Michigan crash data.
| Estimate | Standard Error | t Value | Pr > |t| | |
|---|---|---|---|---|
| Road Type (F(1,1272) = 0.16; p = 0.69) | ||||
| Reference group: Interstate/freeway | ||||
| Non-interstate/freeway road (NFC ≥ 3) | −0.28 | 0.16 | −1.79 | 0.07 |
| Motorcycle class (F(2,1272) = 34.27; p < 0.001) | ||||
| Reference group: Cruiser | ||||
| Sport | 1.13 | 0.16 | 7.25 | <0.001 |
| Touring | −0.34 | 0.12 | −2.77 | 0.006 |
| Time of Day (F(2, 1169) = 5.59; p = 0.003) | ||||
| Reference group: Morning | ||||
| Afternoon | −0.79 | 0.26 | −3.02 | 0.002 |
| Evening | −1.04 | 0.27 | −3.91 | <0.001 |
-2LL difference from null: 123.0.
To compare the two models, we computed predicted helmet use for each category represented by a unique combination of conditions crossing road type, motorcycle class, and time of day. The correlation between predicted risks for the two models is high (r = 0.91). The predicted values under each model for each of the unique combinations of conditions are shown in Fig. 1. The line in the figure represents equal prediction for the two models and shows alignment around the slope. Note that for the majority of categories, the observation data predict higher helmet use rates than the crash data. When the observation-predicted helmet use rate is higher than the crash-predicted rate, the risk ratio for crashing with versus without a helmet is less than 1.
Fig. 1.
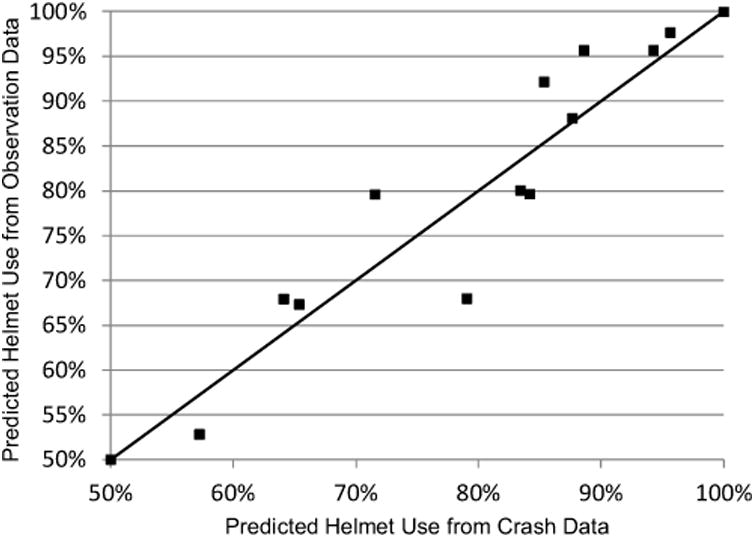
Predicted helmet use probability from a model based on crash data, compared with a model based on observation data. The line represents equal predictions for the two models.
Table 6 shows the helmet use rates for all crash-involved motorcycle operators in Michigan and the estimated statewide observed use rates by road type, motorcycle class, and time of day. The estimated observed use rates were based on adjusting each category by the relative risk of crashing for helmeted and unhelmeted operators in that category, as described in the methods.
Table 6.
Actual police-reported crash-involved helmet use rate and estimated observed statewide helmet use rates by road type, motorcycle class, and time of day.
| Motorcycle class | Time of day | N | Helmet use rate identified in actual crash data | Estimated statewide on-road helmet use rate |
|---|---|---|---|---|
| Roadway Type: Freeway | ||||
| Cruiser | Morning | 12 | 83.3% | 83.9% |
| Afternoon | 99 | 78.8% | 85.2% | |
| Evening | 72 | 62.5% | 63.5% | |
| Touring | Morning | 14 | 85.7% | 82.7% |
| Afternoon | 107 | 69.2% | 72.7% | |
| Evening | 55 | 69.1% | 64.1% | |
| Sport | Morning | 21 | 95.2% | 97.5% |
| Afternoon | 81 | 93.8% | 97.8% | |
| Evening | 81 | 97.5% | 98.7% | |
| Roadway Type: Non-Freeway | ||||
| Cruiser | Morning | 147 | 82.3% | 77.4% |
| Afternoon | 1072 | 69.9% | 71.7% | |
| Evening | 687 | 64.5% | 57.2% | |
| Touring | Morning | 96 | 74.0% | 61.5% |
| Afternoon | 752 | 66.0% | 61.8% | |
| Evening | 425 | 59.3% | 45.0% | |
| Sport | Morning | 92 | 95.7% | 96.8% |
| Afternoon | 451 | 87.6% | 93.4% | |
| Evening | 474 | 86.1% | 89.3% |
To compute an overall statewide helmet use rate among motorcycle operators on the road, we weighted the estimated helmet use rate in the last column of Table 6 by the rate at which motorcycles were observed per hour within each category. The overall estimated helmet use rate including novelty helmets and 95% confidence interval was 75.4% (CI: 68.3%, 82.6%). We also estimate that 9.6% (CI: 7.8%, 11.5%) of the sample was wearing novelty helmets.
4. Discussion
Fatalities and head injuries to motorcyclists present a significant public health concern. It is well-established that the use of an approved motorcycle helmet is associated with reduced head injuries and that a universal motorcycle helmet use law is associated with greater use of helmets and fewer injuries and fatalities among motorcyclists (NHTSA, 2015). Despite this evidence, a majority of U.S. states do not have universal helmet laws, including Michigan (IIHS, 2016c). This study sought to examine helmet use following the partial repeal of Michigan's universal helmet use law using both police-reported crash data and roadside observational data in one region of the state. Our approach allowed us to estimate the helmet use rate among all operators across the state without requiring observations to be done across the entire state.
The current study estimated the rate of helmet use (including novelty helmets) at 75% for all motorcycle operators, compared with 73% identified in police-reported crash data. The rates and analyses presented in Fig. 1 highlight the degree of concordance between helmet use in crash data and the observed helmet use. The similarity and alignment is notable and suggests there is value in using crash data, in particular data that include property-damage-only crashes, when understanding statewide helmet use rates. Given the costs of large scale observations and that crash data is routinely collected by states, helmet use rates in crash data may be a useful and inexpensive way to approximate overall helmet use and especially to identify associated characteristics and changes over time.
In 2006, 6 years prior to the helmet law change, observed helmet use in Michigan was 99.4%, based on a statewide observational survey (Datta et al., 2006). The findings from the current study show the level of helmet use in Michigan following the weakening of the universal helmet law was considerably lower than that observed in 2006. However, current estimated helmet use was higher than typically seen in other states that have weakened or repealed their universal helmet use laws. For example, Texas and Kentucky had comparably high rates of helmet use (near full use: 97% and 96%, respectively) prior to the partial repeal of their universal helmet laws, and observed use rates dropped to 66% and 65%, respectively, in the year after (Preusser et al., 2000; Ulmer and Preusser, 2003). Helmet use in crashes declined among motorcyclists involved in police-reported crashes in Pennsylvania from 82% in 2001–02 to 58% in 2004–05 after the state implemented a partial repeal of the helmet law in 2003 (Mertz and Weiss, 2008). Rates of use, however, were still considerably lower in Michigan after the partial repeal of the universal helmet law than rates in states with universal helmet use laws. It is unclear why Michigan's helmet use was higher following the partial repeal of the universal helmet use law, relative to changes in use after partial repeals in other states, including other northern states [e.g., Pennsylvania, (Mertz and Weiss, 2008)]. The findings are, however, in line with other observational data collected in Michigan after the law was modified (Savolainen et al., 2013).
The study also provides a better understanding of the context and characteristics of operators who do not wear a helmet. Helmet use was greatest for operators of sport motorcycles compared with operators of other motorcycle classes, and in the morning versus afternoon and evening, and these estimates were similar for the observational and crash data. In observation data, greater use was associated with riding on freeways compared with local arterial roads. This finding replicates a component of an earlier study by Gkritza (2009), who found that a larger proportion of motorcyclists used helmets on freeways and major arterial roads compared with city and local roads. The findings are also similar to the research reported by McCartt et al. (2011), who in a telephone survey of motorcyclists examined rates of helmet use among riders of particular motorcycle classes. In the current study, there is overall evidence of higher use rates in observed data compared with the crash data except in a few cases on non-freeway roads, including among operators of cruisers in the afternoon and evenings and among those on touring motorcycles at all times.
In the absence of a universal helmet law, the differences by motorcycle class, roadway type, and time of day observed in this study provide information that can be used to guide the development of safety strategies. About 8% of observed motorcycles were wearing novelty helmets, suggesting resources could be directed toward educating riders on the superior protection of DOT-compliant helmet use compared with novelty helmets and ways to identify a DOT-compliant helmet. Observed helmet use varied by time of day and roadway type; this suggests that educational programs should encourage the use of helmets at all times of the day and on all types of roadways. Wearing jackets, pants, or gloves lowers the risk of hospitalization for crash-involved motorcyclists, and wearing boots reduces the risk of injury (de Rome et al., 2011) Thus, education that encourages the use of protective clothing also is warranted. While we observed high rates of the use of gloves and long pants, only about half of operators wore jackets and boots. However, it is important to note that there is no evidence that educational efforts to increase helmet use have been effective. Universal motorcycle helmet use laws however have been clearly documented to increase helmet use (NHTSA, 2015).
The current study has several limitations. First, the study drew on daylight observations recorded primarily by a single research assistant at specified morning, afternoon, and evening times in Southeast Michigan, which were then generalized to the state based on crash data statistics. This may have limited our ability to identify and refine factors that differentiate among the characteristics of motorcyclists with regard to helmet use. Of note, in the logistic regression analyses of factors associated with helmet use, road type and afternoon riding were not associated with helmet use in the crash data yet were in the observation data. Further, helmet use may not always be accurately recorded in police reports of crashes. The focus of this study was limited to Michigan. Similar studies of selection sample of states from various regions of the country would allow for a more comprehensive examination of the effects of riding context, including seasonality of riding, climate, licensing status, and geography on helmet use. In particular, linking crash data with licensing data will provide opportunity for future research to better understand riders and their driving history. We collected observational data from only one riding season, which was the second season after the weakening of the Michigan universal helmet law, but we also used crash data from the riding season immediately after the law change, the most recent data available. The single season of observation also prevents an examination of temporal trends and patterns. We also do not have information about the level of enforcement of the universal law before the partial repeal, which could have affected how noticeable the reduction in enforcement was to motorcyclists after the partial repeal was enacted. Finally, our analysis method relies on the assumption that relative involvement of helmeted and unhelmeted riders in police-reported crashes is constant within rider category (e.g., bike type, road type, etc.) across the state. Although many mechanisms for different involvement rates (e.g., helmet use associated with less risky in driving, lower injury levels for helmet wearers leading to lower rate of reporting crashes to the police) are accounted for, there may be others that are different in different regions.
In sum, this study estimates that statewide helmet use among Michigan motorcyclists was 75% a few years following the partial repeal of a universal helmet use law, based on a combination of statewide crash data and regional roadside observational data. The findings show that helmet use is lower than is typically observed in states with universal helmet laws. For example, in the most recent national observational survey conducted in 2014, the rate of helmet use in states with universal helmet laws was 96% when non-DOT compliant helmets are included (or 89% when only DOT-compliant helmets are included) (NHTSA, 2015). It is also lower than rates observed in Michigan when the universal helmet use law was in place (Datta et al., 2006). At the same time, it is higher than is typically seen in states that have weakened their universal helmet use laws. This research also estimates helmet use rates based on key characteristics of operators, for example, their choice of motorcycle and the time of day and type of roadway. In particular, operators of sport motorcycles more often wore a helmet, and that helmet was more often a full-face helmet, compared with operators of cruisers or touring motorcycles. The lower use of helmets by operators of cruisers and touring motorcycles is particularly pronounced when they are riding on surface roads compared with freeways. These different patterns of use highlight the potential for further research and for designing and targeting strategies for improving helmet use rates in states without universal helmet laws.
Acknowledgments
We wish to acknowledge the support of the Insurance Institute for Highway Safety (IIHS), in particular, Anne McCartt for her suggestions that improved this paper. We also would like to thank the research staff who undertook the observations, Patrick Bowman for some data analysis, and Doug Roehler for assisting in preparing for the observations.
References
- Cook LJ, Kerns T, Burch C, Thomas A, Bell E. Motorcycle Helmet Use and Head and Facial Injuries: Crash Outcomes in the CODES-Linked Data Report No DOT HS 811 208. National Highway Traffic Safety Administration; Washington, DC: 2009. [Google Scholar]
- Crompton JG, Oyetunji T, Stevens KA, Efron DT, Haut ER, Haider AH. Motorcycle helmets save lives, but not limbs: a national trauma data bank analysis of functional outcomes after motorcycle crash. J Surg Res. 2010;158:1–5. doi: 10.1016/j.jss.2009.06.034. http://dx.doi.org/10.1016/j.jss.2009.06.034. [DOI] [PubMed] [Google Scholar]
- de Rome L, Ivers R, Fitzharris M, Du W, Haworth N, Heritier S, Richardson D. Motorcycle protective clothing: protection from injury or just the weather? Accid Anal Prev. 2011;43:1893–1900. doi: 10.1016/j.aap.2011.04.027. [DOI] [PubMed] [Google Scholar]
- Datta TK, McAvor D, Grillo L. Motorcycle Protective Gear Use Observation Study: Final Report. Michigan Office of Highway Safety Planning; Lansing, MI: 2006. [Google Scholar]
- Federal Highway Administration. State Motor-Vehicle Registrations - 2014. [accessed 17.03.2016];2015 Available: 2014 https://www.fhwa.dot.gov/policyinformation/statistics/2014/mv1.cfm.
- Efron B, Tibshirani RJ. An Introduction to the Bootstrap Monographs on Statistics and Applied Probability. Vol. 57. CRC Press; Boca Raton, FL: 1994. [Google Scholar]
- Gkritza K. Modeling motorcycle helmet use in Iowa: evidence from six roadside observational surveys. Accid Anal Prev. 2009;41:479–484. doi: 10.1016/j.aap.2009.01.009. http://dx.doi.org/10.1016/j.aap.2009.01.009. [DOI] [PubMed] [Google Scholar]
- Google Maps (Cartographer) 2014 South-east Michigan [Street Map] [Google Scholar]
- Houston DJ, Richardson LE. Motorcyclist fatality rates and mandatory helmet-use laws. Accid Anal Prev. 2008;40:200–208. doi: 10.1016/j.aap.2007.05.005. http://dx.doi.org/10.1016/j.aap.2007.05.005. [DOI] [PubMed] [Google Scholar]
- Insurance Institute for Highway Safety. Author; Arlington, VA: 2016a. [accessed: 16.03.16]. Fatality Facts: Motorcycles and ATVs. Available: http://www.iihs.org/iihs/topics/t/motorcycles/fatalityfacts/motorcycles. [Google Scholar]
- Insurance Institute for Highway Safety. Unpublished analysis of 2014 data from the National Automotive Sampling System General Estimates System. Author; Arlington, VA: 2016b. [Google Scholar]
- Insurance Institute for Highway Safety. Author; Arlington, VA: 2016c. Mar 2016, [accessed: 16.03.16]. Motorcycle Helmet Use. Available: http://www.iihs.org/iihs/topics/laws/helmetuse?topicName=motorcycles. [Google Scholar]
- Islam S, Goetzke F. Correcting sample selection in FARS data to estimate seatbelt use. J Safety Res. 2009;40:389–393. doi: 10.1016/j.jsr.2009.09.002. http://dx.doi.org/10.1016/j.jsr.2009.09.002. [DOI] [PubMed] [Google Scholar]
- Markogiannakis H, Sanidas E, Messaris E, Koutentakis D, Alpantaki K, Kafetzakis A, Tsiftsis D. Motor vehicle trauma: analysis of injury profiles by road-user category. Emerg Med J. 2006;23:27–31. doi: 10.1136/emj.2004.022392. http://dx.doi.org/10.1136/emj.2004.022392. [DOI] [PMC free article] [PubMed] [Google Scholar]
- Mayrose J. The effects of a mandatory motorcycle helmet law on helmet use and injury patterns among motorcyclist fatalities. J Safety Res. 2008;39:429–432. doi: 10.1016/j.jsr.2008.07.001. http://dx.doi.org/10.1016/j.jsr.2008.07.001. [DOI] [PubMed] [Google Scholar]
- McCartt AT, Blanar L, Teoh ER, Strouse LM. Overview of motorcycling in the United States: a national telephone survey. J Safety Res. 2011;42:177–184. doi: 10.1016/j.jsr.2011.05.003. http://dx.doi.org/10.1016/j.jsr.2011.05.003. [DOI] [PubMed] [Google Scholar]
- Mertz KJ, Weiss HB. Changes in motorcycle-related head injury deaths, hospitalizations, and hospital charges following repeal of Pennsylvania's mandatory motorcycle helmet law. Am J Public Health. 2008;98(8):1464–1467. doi: 10.2105/AJPH.2007.123299. http://dx.doi.org/10.2105/AJPH.2007.123299. [DOI] [PMC free article] [PubMed] [Google Scholar]
- Michigan Department of Transportation (MDOT) NFC Post 2010 Census Statewide Review. Author; State of Michigan, Lansing, MI: 2014a. [Google Scholar]
- Michigan Department of Transportation (MDOT) Author; State of Michigan, Lansing, MI: 2014b. Michigan Highway Performance Monitoring System (HPMS)-NFC. Downloaded 3/17/16 from https://www.michigan.gov/documents/mdot/MDOT_TOTALS_LENAVMTBYNFC_372812_7.PDF. [Google Scholar]
- Michigan Legislature. Michigan Vehicle Code Act 300 (section 257.658) Author; Lansing, MI: 2012. [Google Scholar]
- National Highway Traffic Safety Administration. Motorcycle Helmet Use Laws Traffic Safety Facts, Laws. U.S Department of Transportation; Washington, DC: 2008. Report No DOT HS 810 887W. [Google Scholar]
- National Highway Traffic Safety Administration. Motorcycles Traffic Safety Facts. U.S Department of Transportation; Washington, DC: 2014. Research Note. Report No. DOT HS 812 035. [Google Scholar]
- National Highway Traffic Safety Administration. Motorcycle Helmet Use in 2014: Overall Results Traffic Safety Facts. U.S Department of Transportation; Washington, DC: 2015. Research Note. Report No. DOT HS 812 110. [Google Scholar]
- Peek-Asa C, McArthur DL, Kraus JF. The prevalence of non-standard helmet use and head injuries among motorcycle riders. Accid Anal Prev. 1999;31(3):229–233. doi: 10.1016/s0001-4575(98)00071-2. http://dx.doi.org/10.1016/S0001-4575(98)00071-2. [DOI] [PubMed] [Google Scholar]
- Preusser DF, Hedlund JH, Ulmer RG. Evaluation of Motorcycle Helmet Law Repeal in Arkansas and Texas. National Highway Traffic Safety Administration; Washington, DC: 2000. Report No. DOT HS 809 131. [Google Scholar]
- Savolainen P, Gates T, Morden JA, Hacker E. 2013 Direct Observtion Survey of Motorcycle Helmet Use. Transpotation Research Group, Wayne State University; Detroit, MI: 2013. [Google Scholar]
- Schneider WH, Savolainen PT, Van Boxel D, Beverley R. Examination of factors determining fault in two-vehicle motorcycle crashes. Accid Anal Prev. 2012;45:669–676. doi: 10.1016/j.aap.2011.09.037. http://dx.doi.org/10.1016/j.aap.2011.09.037. [DOI] [PubMed] [Google Scholar]
- Teoh ER, Campbell M. Role of motorcycle type in fatal motorcycle crashes. J Safety Res. 2010;41:507–512. doi: 10.1016/j.jsr.2010.10.005. http://dx.doi.org/10.1016/j.jsr.2010.10.005. [DOI] [PubMed] [Google Scholar]
- The Omega Group. Author; San Diego, CA: 2014. CrimeMapping. Available: http://www.crimemapping.com/help/faq.aspx. [Google Scholar]
- Ulmer RG, Preusser DF. Evaluation of the Repeal of Motorcycle Helmet Laws in Kentucky and Louisiana. National Highway Traffic Safety Administration; Washington, DC: 2003. Report No. DOT HS 809 530. [Google Scholar]