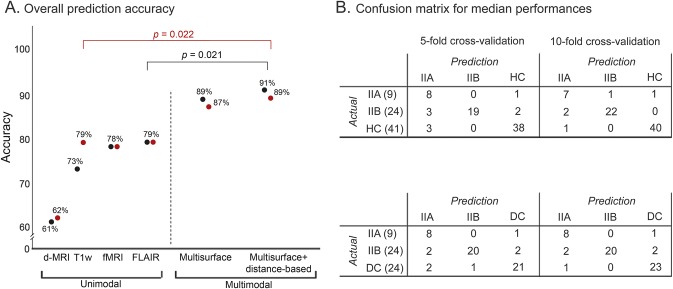
Figure 4. Automated classification.
(A) The plot shows the overall prediction accuracy across 100 iterations for classifiers operating on unimodal (i.e., lesional features derived from 1 modality) and multimodal feature combinations (multisurface and distance-based) based on the 10-fold cross-validation. Results are shown separately for classifiers including healthy controls (HC) (in black) and disease controls (DC) (in red). McNemar test compared accuracy across feature combinations. (B) Confusion matrix of median performance for learners operating on multimodal (multisurface and distance-based) features. The diagonal cells show correct predictions, while nondiagonal cells report incorrect predictions. Note that from the initial 53 MRI features per case (20 for T1-weighted, 17 for fluid-attenuated inversion recovery [FLAIR], 10 for diffusion-weighted MRI [d-MRI] and 6 for resting-state functional MRI [rs-fMRI]), only a subset was chosen by the feature selection to train the classifier. The average for the 5-/10-fold validation was 7 ± 2/7 ± 1 features, when training with healthy controls, and 7 ± 2/9 ± 1, when training with disease controls, respectively.

