

Abstract
Sarcolipin (SLN) and phospholamban (PLN) are two small proteins that regulate the sarco(endo)plasmic reticulum Ca2+-ATPase pumps. In a recent study, we discovered that Pln overexpression (PlnOE) in slow-twitch type I skeletal muscle fibers drastically impaired SERCA function and caused a centronuclear myopathy-like phenotype, severe muscle atrophy and weakness, and an 8 to 9-fold upregulation of SLN protein in the soleus muscles. Here, we sought to determine the physiological role of SLN upregulation, and based on its role as a SERCA inhibitor, we hypothesized that it would represent a maladaptive response that contributes to the SERCA dysfunction and the overall myopathy observed in the PlnOE mice. To this end, we crossed Sln-null (SlnKO) mice with PlnOE mice to generate a PlnOE/SlnKO mouse colony and assessed SERCA function, CNM pathology, in vitro contractility, muscle mass, calcineurin signaling, daily activity and food intake, and proteolytic enzyme activity. Our results indicate that genetic deletion of Sln did not improve SERCA function nor rescue the CNM phenotype, but did result in exacerbated muscle atrophy and weakness, due to a failure to induce type II fiber compensatory hypertrophy and a reduction in total myofiber count. Mechanistically, our findings suggest that impaired calcineurin activation and resultant decreased expression of stabilin-2, and/or impaired autophagic signaling could be involved. Future studies should examine these possibilities. In conclusion, our study demonstrates the importance of SLN upregulation in combating muscle myopathy in the PlnOE mice, and since SLN is upregulated across several myopathies, our findings may reveal SLN as a novel and universal therapeutic target.
Introduction
The muscle proteins, sarcolipin (SLN) and phospholamban (PLN), are two well-known regulators of sarco(endo)plasmic reticulum Ca2+-ATPase (SERCA) pumps [1, 2]. We have recently discovered that type I fiber specific PLN overexpression in mice (PlnOE) causes severe impairments in SERCA function and a centronuclear myopathy (CNM)-like phenotype in the soleus and gluteus minimus muscles [3]. Along with severe muscle atrophy and weakness, these muscles displayed the three main histological features associated with CNM: 1) increased central nuclei, 2) central aggregation of oxidative activity, and 3) type I fiber predominance and hypotrophy [4]. SLN protein was upregulated 7–9 fold in the soleus and gluteus minimus muscles from PlnOE mice compared with wild-type (WT) [3], a feature that is common among other mouse models of muscle disease where SLN is often upregulated [5–12]. However, the physiological role of SLN upregulation in PlnOE mice remains unknown.
Co-expression of SLN and PLN at supraphysiological levels in HEK-293 cells results in superinhibition of calcium uptake [13]. Although the exact mechanisms leading to CNM is unclear, aberrant calcium handling [14, 15] has been suggested to have a pathological role. SERCA inhibition and the concomitant rise in [Ca2+]i could lead to the generation of reactive oxygen species [16] and activation of the Ca2+-dependent calpain proteases [17, 18] ultimately leading to muscle wasting. Since forced over-expression of SLN in skeletal muscle represses SR Ca2+ uptake and impairs contractile function [19] and SLN ablation enhances Ca2+ transport and muscle relaxation [20], we hypothesized that preventing the upregulation of SLN protein in PlnOE mice may mitigate CNM pathology and combat the muscle atrophy and weakness that occurs. To test this hypothesis, we crossed Sln-null (SlnKO) mice [21] with heterozygous PlnOE mice [3] and examined the effect on SERCA function, CNM pathology, soleus muscle mass, and contractile function.
Methods
Mice
The PlnOE and SlnKO mice have been described previously [3, 21]. To direct type I fiber specific Pln overexpression, the Pln transgene was attached to the β-myosin heavy chain (MHC) promoter [22], which directs high levels of type I skeletal-muscle specific transgene expression [23–25]. FVB/N PlnOE mice were resuscitated from cryopreserved embryos by the mmRRC (000067-MU) to generate a breeding colony with WT FVB/N mice in our facility. Since the SlnKO mice were generated onto a C57BL/6J background [21], we backcrossed heterozygous male FVB/N PlnOE animals with either C57BL/6J SlnKO or WT littermate females for 6 generations to generate PlnOE/SlnKO, PlnOE, and WT control lines on a C57BL/6J background. All Pln overexpressing, with or without Sln, were heterozygous for Pln. With this breeding strategy, WT and PlnOE littermate mice were cousins to PlnOE/SlnKO mice. All animals used in the study were adult mice (WT, 6.2 ± 0.1 months; PlnOE, 6.1 ± 0.7 months; PlnOE/SlnKO, 6.1 ± 0.6 months). Animals were housed in an environmentally controlled room with a standard 12:12-hour light-dark cycle and allowed access to food and water ad libitum. All animal procedures were reviewed and approved by the Animal Care Committee of the University of Waterloo and are consistent with the guidelines established by the Canadian Council on Animal Care.
SERCA activity and Ca2+ uptake
Ca2+-dependent SERCA activity was assessed in soleus homogenates over Ca2+ concentrations ranging from pCa 7.2 to 5.4 in the presence of the Ca2+ ionophore A23187 (Sigma C7522) using a spectrophotometric plate reader assay as previously described [26]. Maximal SERCA activity was taken from the raw data and SERCA activity-pCa curves were generated with GraphPad PrismTM (CA, USA) by non-linear regression curve fitting using an equation for a general cooperative model for substrate activation. Ca2+ uptake was measured at a free [Ca2+] of 1500 nM in soleus homogenates in the presence of precipitating anion, oxalate, using the fluorescent dye Indo-1 and a spectrofluorometer equipped with dual-emission monochromators [27].
In vitro muscle contractility
WT, PlnOE, and PlnOE/SlnKO mice were sacrificed by cervical dislocation, and the intact soleus muscles were removed and placed into a bath with oxygenated Tyrode solution (95% O2, 5% CO2) containing 121 mM NaCl2, 5 mM KCl, 24 mM NaHCO3, 1.8 mM CaCl2, 0.4 mM NaH2PO4, 5.5 mM glucose, 0.1 mM EDTA, and 0.5 mM MgCl2, pH 7.3, that was maintained at 25°C. Muscles were situated between two platinum electrodes and force was electrically evoked and assessed across a range of stimulation frequencies from 1 to 100 Hz using a biphasic stimulator (Model 710B, Aurora Scientific, Inc., ON, Canada). Data were analyzed using Dynamic Muscle Control Data Acquisition software (Aurora Scientific). Specifically, peak isometric force amplitude (mN) and the maximal rates of force development (+dF/dt) and relaxation (−dF/dt) were determined during a twitch and across the range of stimulation frequencies. Peak isometric force was then normalized to muscle weight (mN/g).
Antibodies
Primary antibodies against PLN (2D12), phosphorylated-NFATc1 (PA5-38301), total NFATc1 (MA3-024), SERCA2a (MA3-919), ryanodine receptor 1 (RyR, MA3-925), dihydropyridine receptor α1 subunit (DHPR, MA3-920), and calsequesterin I and II (CSQ, MA3-913) were obtained from Pierce Antibodies. The primary antibody directed against SLN was generated by Lampire Biological Laboratories (PA, USA) [28]. LC3B (2775) and p62 (GP62-C) antibodies were obtained from Cell Signaling Technology (MA, USA) and Progen Biotechnik (Heidelberg, Germany), respectively. The primary antibody against actin (A2066) and stabilin-2 (orb158499) were obtained from Sigma Aldrich (MO, USA), and Biorbyt (CA, USA), respectively. SERCA1a antibody (A52) was a kind gift from Dr. David MacLennan (University of Toronto) [29]. The primary antibodies against MHCI (BA-F8), MHCIIa (SC-71), and MHCIIb (BF-F3) were obtained from Developmental Studies Hybridoma Bank (IA, USA). Secondary antibodies for western blotting, goat anti-mouse IgG (peroxidase conjugated) and goat anti-rabbit IgG (peroxidase conjugated) were obtained from Santa Cruz Biotechnology (TX, USA). Secondary antibodies for immunofluorescence staining, Alexa Fluor 350 anti-mouse IgG2b, Alexa Fluor 488 anti-mouse IgG1, and Alexa Fluor 555 anti-mouse IgM, were obtained from Molecular Probes (OR, USA).
Histological, histochemical and immunofluorescent staining
Soleus samples embedded in O.C.T. compound were cut into 10 μm thick serial cross sections with a cryostat (Thermo Electronic, MA, USA) maintained at -20°C. Histological staining included H&E and Van Gieson, and histochemical staining included succinate dehydrogenase (SDH) activity. Images were acquired with a brightfield Nikon microscope linked to a PixeLink digital camera and quantified with ImageJ software (NIH, MA, USA). Immunofluorescence analysis of MHC expression was previously described [30] and performed with primary antibodies against MHCI, MHCIIa, and MHCIIb. Fibers that were not positively stained with MHCI, IIa, or IIb antibodies were considered as type IIX fibers. Slides were visualized with an Axio Observer Z1 fluorescent microscope equipped with standard red, green, blue filters, an AxioCam HRm camera, and AxioVision software (Carl Ziess, Oberkochen, Germany). Quantification of fiber distribution and cross-sectional area (CSA) was performed using imageJ software.
Western blotting
Western blotting was performed to determine expression levels of SLN, PLN, phosphorylated-PLN, SERCA1a, SERCA2a, RyR, DHPR, CSQ, phosphorylated-NFATc1, total NFATc1, stabilin-2, LC3, and p62. Solubilized proteins from tissue homogenates were separated using tricine based SDS-PAGE (13% total acrylamide for PLN and SLN) or standard SDS-PAGE (7.5% total acrylamide for phosphorylated- NFATc1, total NFATc1, SERCA1a, SERCA2a, RyR, DHPR, and CSQ,; 12% total acrylamide for p62 and LC3). Separated proteins were then transferred onto 0.2 μm PVDF membranes for all analyses except for SLN, which utilized nitrocellulose membranes. Membranes were then immunoprobed with their corresponding primary antibodies and subsequently immunoprobed with horseradish peroxidase-conjugated secondary antibodies. Antigen-antibody complexes were detected by SuperSignal West FemtoTM substrate (Pierce, Thermo Fisher Scientific Inc., MA, USA) for SLN, phosphorylated NFAT, and stabilin-2; Luminata ForteTM (Millipore, MA, USA) for PLN, phosphorylated PLN, and RYR; and ECL Western Blot Substrate (BioVision, MA, USA) for total NFAT, SERCA1a, SERCA2a, CSQ, DHPR, LC3 and p62. Quantification of optical densities was performed using GeneTools (Syngene, MD, USA) and values were normalized to the densitometric sum of all bands visualized through ponceau staining or actin. For RyR, DHPR, and CSQ analyses, the same PVDF membrane was used and cut into their corresponding strips (RyR > 250 kDa; DHPR 100–250 kDa; and CSQ < 100 kDa).
Electron microscopy
To examine the triad structures in the soleus muscles of WT, PlnOE, and PlnOE/SlnKO mice, we performed transmission electron microscopy (TEM). Briefly, muscle samples (1 cubic mm each) were fixed immediately in 2.5% glutaraldehyde (EM grade) in 0.2M phosphate buffer (pH 7.4), overnight at 4°C. Subsequently, samples were postfixed in 1% osmium tetraoxide in the same buffer, dehydrated in a graded acetone series, and embedded in an epon-aldarite resin. Semithin sections (0.74 μm) were stained with toluidine blue and placed on a hot plate for 30 seconds to determine orientation of samples. Ultrathin longitudinal sections (90 nm) were cut on a Leica Reichart Ultracut E microtome (Leica Microsystem, Wetzlar, Germany), double contrasted with uranyl acetate (50% in methanol) and lead citrate (0.4% w/v in boiled H2O), and viewed in a CM 10 Philips TEM.
Proteolytic enzyme activity assays
Caspase-3 and cathepsin-B/L activity were determined in soleus muscle homogenates using the substrates Ac-DEVD-AMC (Alexis Biochemicals) and z-FR-AFC (Enzo Life Sciences, NY, USA), respectively, whereas calpain and 20S proteasome activity were determined using Suc-LLVY-AMC (Enzo-Life Sciences) [3]. These fluorogenic substrates are weakly fluorescent but yield highly fluorescent products following proteolytic cleavage by their respective proteases. Fluorescence was measured using a SPECTRAmax Gemini XS microplate spectrofluorometer (Molecular Devices, Sunnyvale, CA) with excitation and emission wavelengths of 360 nm and 440 nm (caspase-3), 380 nm and 460 nm (calpain and 20S proteasome), or 400 nm and 505 nm (cathepsin), respectively. To distinguish between calpain and 20S proteasome activity, the specific inhibitors Z-Leu-Leu-CHO (calpain; Enzo-Life Sciences) and epoxomicin (20S proteasome; Cayman Chemical, MI, USA) were incubated and the difference in fluorescence from homogenates incubated with and without the respective inhibitors was measured. All proteolytic activities were normalized to total protein content and expressed as fluorescence intensity in arbitrary units per mg of protein.
Daily activity and food intake measurements
Daily food consumption (g/day) and cage activity were measured using a comprehensive laboratory animal monitoring system (CLAMS; Oxymax series; Columbus Instruments, Columbus, OH, USA) as previously described [31]. This system is equipped with a feed scale for monitoring mass of food consumed, as well as X- and Z-axes infrared photocell detectors that allow for monitoring ambulatory activity (when 2 adjacent x-axis beams were broken in succession) and total cage activity. Mice were placed in the CLAMS for a 3-day period for 3 separate trials and had free access to food and water.
Statistics
All values are presented as means ± standard error (SEM). Statistical significance was set to p ≤ 0.05. Most comparisons between WT, PlnOE, and PlnOE/SlnKO mice were performed using a one-way ANOVA with a Tukey’s post-hoc test or a Games-Howell post-hoc test to control for unequal variances. A two-way ANOVA was used to examine the force frequency curves.
Results
Effect of Sln ablation on SERCA function
Similar to the FVB/N line [3] we observed an 8-fold upregulation of SLN protein in the PlnOE soleus, and we confirmed the lack of SLN protein after genetic deletion of Sln (Fig 1A). Removal of Sln did not alter the level of monomeric or pentameric PLN overexpression (Fig 1B). Unexpectedly, the rates of Ca2+ uptake, and SERCA’s apparent affinity for Ca2+ were similarly reduced in the PlnOE and PlnOE/SlnKO soleus muscles compared with WT (Fig 1C–1E).
Fig 1. Sln deletion does not rescue SERCA function in PlnOE mice.

(A) Western blot analyses showing successful removal of the 8-fold upregulation in SLN protein (n = 6 per genotype). Ponceau staining ensured equal loading. (B) PlnOE and PlnOE/SlnKO soleus muscles displayed similar levels of monomeric (m) and pentameric (p) PLN overexpression compared with WT (n = 6 per genotype). Values were normalized to actin. (C) Rates of Ca2+ uptake were similarly reduced in the PlnOE and PlnOE/SlnKO soleus muscles compared with WT (n = 6–7, per genotype). (D) Representative SERCA activity-pCa curves measured in soleus homogenates (n = 6–7, per genotype). (E) SERCA’s apparent affinity for Ca2+, presented as pCa50, was similarly reduced in the PlnOE and PlnOE/SlnKO soleus muscles compared with WT (n = 6–7, per genotype). pCa50 is the negative logarithm of the Ca2+ concentration required to attain half-maximal SERCA activity rate. *Significantly different from WT using a Student’s t-test (A), and a one-way ANOVA with a Tukey’s post-hoc (B, C and E), p ≤ 0.05. All values are means ± SEM.
PLN phosphorylation and expression of other Ca2+regulatory proteins
As with total PLN expression, only 2.5 μg of protein from soleus homogenates was required to detect phosphorylated PLN (p-PLN) in the PlnOE and PlnOE/SlnKO mice compared to the 25 μg of protein required from WT mice (Fig 2A). The p-PLN/PLN ratio was significantly lower in both PlnOE and PlnOE/SlnKO mice compared with WT, but there were no differences between PlnOE and PlnOE/SlnKO mice (Fig 2A). Assessment of the other major Ca2+ regulatory proteins including SERCA1a, SERCA2a, DHPR, RyR, and CSQ did not reveal any significant differences (Fig 2B–2F).
Fig 2. PLN phosphorylation and expression levels of other Ca2+ regulatory proteins.

(A) Western blot analyses demonstrating that monomeric p-PLN/PLN ratio is significantly lower in both PlnOE and PlnOE/SlnKO soleus muscles compared with WT (n = 5–6 per genotype). Western blotting for other major Ca2+ regulatory proteins SERCA1a (B, 110 kDa), SERCA2a (C, 110 kDa), RyR (D, 565 kDa), DHPR (E, 170 kDa), and CSQ (F, 63 kDa) did not reveal any significant differences across genotypes (n = 5–8 per genotype, with a 6 μg load for all proteins). *Significantly different from WT using a a one-way ANOVA with a Tukey’s post-hoc, p ≤ 0.05. All values are means ± SEM.
CNM phenotype in PlnOE and PlnOE/SlnKO mice
To determine whether genetic deletion of SLN would influence the CNM phenotype, we performed: 1) H&E staining to examine the percentage of central nuclei, 2) SDH staining to look for central aggregation of oxidative activity, and 3) immunofluorescent staining to assess type I fiber distribution and size. Both the PlnOE and PlnOE/SlnKO soleus muscles exhibited a CNM-like phenotype with an increase in central nuclei, central aggregation of oxidative activity, and type I fiber predominance and hypotrophy (Fig 3A–3F). Consistent with other models of CNM and biopsies from CNM patients [32–35], TEM analyses revealed triad abnormalities with swollen sarcoplasmic reticulum membranes in both the PlnOE and PlnOE/SlnKO soleus muscles (Fig 3G). In addition to this and in agreement with our initial characterization of the PlnOE mice [3], endomysial fibrosis and core-like lesions were evident in the PlnOE and PlnOE/SlnKO soleus (Fig 3H–3J). Collectively, these data suggest that Sln deletion had very little effect on the overall CNM phenotype that occurs with PLN overexpression.
Fig 3. SLN does not contribute to CNM pathology in PlnOE mice.

Representative H&E (A), immunofluorescent (B), and SDH (C) stained sections showing the CNM phenotype of elevated central nuclei (D), type I fiber predominance (E) and type I fiber hypotrophy and type II fiber hypertrophy (F), and central aggregation of oxidative activity (yellow arrows in C) (n = 4–6 per genotype). (G) Transmission electron micrographs illustrating triad disruptions with swollen sarcoplasmic reticulum in both the PlnOE and PlnOE/SlnKO soleus muscles. Arrowheads point to the swollen sarcoplasmic reticulum with corresponding area. Van-Giesons staining (H) quantified with imageJ (I) reveals greater endomysial fibrosis the PlnOE and PlnOE/SlnKO soleus muscles compared with WT (n = 4 per genotype). (J) Representative SDH-stained and H&E-stained sections displaying core-like aspects in the PlnOE and PlnOE/SlnKO soleus muscles that cannot be explained by the presence of an artifact or vacuole. Arrows point to the core-like aspect and asterisks depict the same fiber within serial sections. *Significantly different from WT using a one-way ANOVA with a Tukey’s post-hoc, p ≤ 0.05. All values are means ± SEM. CSA, cross-sectional area. All scale bars are set to 50 μm except for (G) where scale bars are set to 100 nm.
Effect of Sln deletion on muscle size and contractile function
The absence of SLN exacerbated the soleus muscle atrophy seen with PLN overexpression [3, 22] as the soleus:body weight ratios were smallest in the PlnOE/SlnKO mice compared with both PlnOE and WT (Fig 4A). Furthermore, the type IIA fibers from PlnOE/SlnKO mice failed to undergo the typical compensatory hypertrophy observed in the PlnOE mice (Fig 3F and reference [3]), and the type IIX fibers showed a similar pattern (Fig 3F); however the one-way ANOVA did not indicate statistical significance (p = 0.11). There was also a significant reduction in total fiber count in the PlnOE/SlnKO soleus muscles compared with both PlnOE and WT mice (Fig 4B). Soleus muscles from PlnOE/SlnKO mice displayed significant reductions in mass-specific force from 50-100Hz stimulation compared with WT (Fig 4C). In contrast, the PlnOE soleus muscles were only significantly weaker than WT at 100 Hz (Fig 4C). Furthermore, comparisons between PlnOE and PlnOE/SlnKO soleus force-frequency curves using a two-way ANOVA reveals a significant main effect of genotype (p = 0.02), which suggests that the PlnOE/SlnKO soleus muscles are weaker than the PlnOE soleus muscles. With respect to twitch kinetics, the rates of relaxation (Fig 4D) and force development (Fig 4E) were reduced in the PlnOE and PlnOE/SlnKO soleus muscles compared with WT, with the rates of force development being significantly slower in PlnOE/SlnKO compared with PlnOE. Importantly, body weight, daily food intake, and daily activity were not different between groups (Table 1), and therefore cannot explain the worsened soleus muscle atrophy and weakness.
Fig 4. Without SLN upregulation, PlnOE soleus muscles are smaller and weaker.

(A) soleus:body weight ratios (mg/g) across genotype (n = 18–23 per genotype). (B) Total myofiber count in soleus muscle sections counted after immunofluorescent staining (n = 6 per genotype). (C) Mass-specific force-frequency curve analysis in isolated soleus muscles (n = 6–7 per genotype). Rates of relaxation (-dF/dt, D) and force development (+dF/dt, E) measured for a single twitch (n = 6–7 per genotype). For (A, B, D and E), *significantly different from WT; †significantly different from PlnOE, using a one-way ANOVA p ≤ 0.05. For C, *significantly different from PlnOE/SlnKO; †significantly different from PlnOE, using a two-way ANOVA p ≤ 0.05. All values are means ± SEM.
Table 1. Body weight, daily activity and daily food intake measures from WT, PlnOE, and PlnOE/SlnKO mice.
| Parameter | WT | PlnOE | PlnOE/SlnKO |
|---|---|---|---|
| Body weight (g) | 35.9 ± 0.8 | 37.5 ± 0.8 | 36.0 ± 1.1 |
| Food intake (g/d) | 4.9 ± 0.5 | 5.2 ± 0.3 | 4.7 ± 0.4 |
| Total activity (counts/d) | 15,354 ± 1,073 | 11,070 ± 1,690 | 12,072 ± 1,468 |
| Ambulatory activity (counts/d) | 5,435 ± 680 | 3,665 ± 681 | 3,950 ± 641 |
Values are means ± SEM (n = 18–23, for the average body weight of PlnWT/SlnWT, PlnOE/SlnWT, and PlnOE/SlnKO mice; n = 6 per genotype for daily food consumption, ambulation, and total activity). Ambulatory activity counts were when the mouse crossed 2 adjacent x-axis infrared beams in succession. One-way ANOVA revealed no significant effect of genotype for body weight (p = 0.37), food intake (p = 0.48), total activity (p = 0.12), or dual beam activity (p = 0.17).
Fiber type distribution
In response to Pln overexpression in the slow-twitch type I fibers, the type II fibers decrease in proportion while the type I fibers increase [3, 22]. A similar result was observed in this study with significant reductions in both type IIA and type IIX fiber percentages in PlnOE mice compared with WT (Fig 3E). In contrast, the type IIA fiber distribution in the PlnOE/SlnKO was not different from WT (Fig 3E) suggestive of a delayed fast-to-slow fiber type shift.
NFATc1 phosphorylation and stabilin-2 expression as markers of calcineurin signaling
To explain the lack of type II fiber hypertrophy and the delay in the fast-to-slow fiber type shift in the absence of Sln, we focused on calcineurin, the Ca2+-calmodulin dependent serine/threonine phosphatase known to regulate these cellular adaptations [36–38] and, perhaps more importantly, shown to be responsive to SLN [39]. When examining the phosphorylation status of nuclear factor of activated T-cells cytoplasmic 1 (NFATc1) as a marker of calcineurin signaling, compared with WT we found that NFATc1 phosphorylation relative to total NFATc1 was significantly lower in PlnOE but not PlnOE/SlnKO soleus (Fig 5A). Calcineurin-mediated activation of NFATc1 increases the expression of stabilin-2; a phosphatidylserine receptor required for myoblast fusion [40]. Corresponding well with the significant dephosphorylation of NFATc1 only in the PlnOE mice, we found a significant elevation in stabilin-2 expression only in PlnOE soleus compared with WT (Fig 5B). Stabilin-2 expression was also higher in the PlnOE soleus compared to the PlnOE/SlnKO soleus.
Fig 5.

Elevated NFATc1 phosphorylation status (A) and a failure to promote stabilin-2 expression (B) indicates blunted calcineurin signaling in PlnOE/SlnKO mice. * Significantly different from WT using a one-way ANOVA with a Games-Howell post-hoc for unequal variances (A, n = 7–12 per genotype), or a Tukey’s post-hoc test (B, n = 9–10 per genotype); †significantly different from PlnOE, p ≤ 0.05. All values are means ± SEM.
Assessment of the major proteolytic pathways and autophagy
Next, we tested whether elevated proteolytic activities could also contribute to the exacerbated soleus muscle atrophy seen in the PlnOE/SlnKO mice. Consistent with our previous study [3], calpain, caspase-3, 20S proteasome and cathepsin activities were all significantly elevated in the PlnOE soleus compared with WT; however, none of these were augmented further in the PlnOE/SlnKO soleus (Fig 6A–6D). In fact, only the 20S proteasome was significantly elevated in the PlnOE/SlnKO soleus compared with WT. Moreover, a trending reduction in p62 content (p = 0.10) and a significant increase in the LC3-II/I ratio in the PlnOE soleus, combined with the elevated cathepsin activity, indicate greater autophagic signaling compared with WT (Fig 6E and 6F); however, we did not observe this in the PlnOE/SlnKO mice. Taken together, these results suggest that proteolytic activity and autophagic signaling were not enhanced in PlnOE/SlnKO soleus and cannot explain the exacerbated muscle atrophy caused by Sln ablation.
Fig 6. Sln deletion does not augment proteolytic activity and autophagic signaling in response to Pln overexpression.
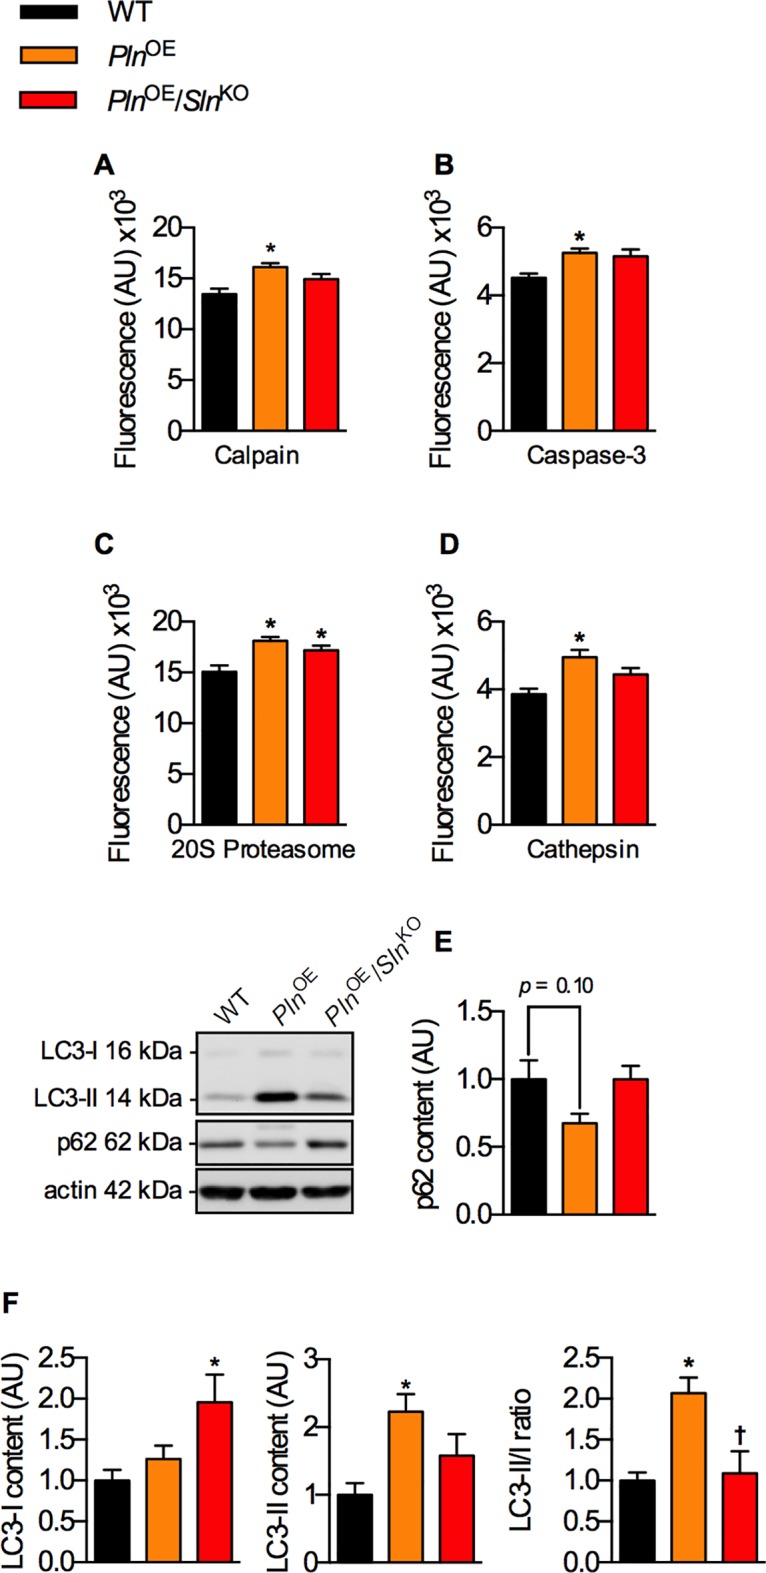
Calpain (A), caspase-3 (B), and 20S proteasome activity assays (C). Enhanced autophagy revealed by increased cathepsin activity (D), decreased p62 levels (E) and increased LC3-II/I content (F) in PlnOE mice is attenuated in PlnOE/SlnKO mice. *Significantly different from WT, †significantly different from PlnOE using a one-way ANOVA and a Tukey’s post-hoc test, p ≤ 0.05. For proteolytic measures, n = 6–7; for p62, LC3-I and–II content, n = 11–12 and optical densities were normalized to actin. All values are means ± SEM.
Discussion
In this study, we examined the physiological role of SLN upregulation in the PlnOE mouse model of CNM by generating the PlnOE/SlnKO mouse line. We hypothesized that SLN ablation would alleviate the CNM pathology, muscle atrophy, and weakness in this model through improvements in SERCA function. However, in contrast to our hypotheses, we did not observe any improvements in SERCA function or CNM phenotype in the PlnOE/SlnKO soleus, and found that Sln deletion actually exacerbated the soleus muscle atrophy and weakness by preventing the compensatory type II fiber hypertrophy and reducing the total myofiber count. In addition, rates of force development were slower in the PlnOE/SlnKO soleus compared with those from PlnOE mice, which could be due to excitation-contraction (E-C) coupling impairments related to triad structural defects.
In a previous study with Sln overexpressing mice, SLN was shown to stimulate calcineurin [39], a Ca2+-dependent phosphatase that is implicated in muscle growth [36, 38, 41] and promotion of the slow-oxidative phenotype [36, 41–45]. Pharmacological inhibition of calcineurin prevents myofiber hypertrophy and the fast-to-slow fiber type transition in plantaris muscles that have been mechanically overloaded after synergist ablation of the soleus and gastrocnemius [36, 41, 46]. We propose that the PlnOE soleus represents a model of intramuscular overload, whereby the type I fiber hypotrophy results in overload of the type II fibers within the soleus causing them to hypertrophy and transition towards the slow oxidative phenotype [3]. However, in the absence of SLN upregulation, the fast-to-slow fiber type shift and type II fiber hypertrophy are attenuated in the PlnOE mice.
A failure to dephosphorylate NFAT and increase expression of stabilin-2 are indicative of impaired calcineurin signaling in the PlnOE/SlnKO mice. It is well accepted that calcineurin activation is important for controlling muscle fibre type in adaptive muscle remodeling so lowered calcineurin activation can at least partly explain the blunted fast-to-slow fiber type shift in the PlnOE/SlnKO soleus. On the other hand, there is some discrepancy regarding calcineurin’s role in stimulating muscle growth. Specifically, some studies have failed to replicate the hypertrophic effect of calcineurin in the overloaded plantaris [47, 48], and genetically modified mice, characterized with either calcineurin inhibition or over-activation, display no effects on myofiber size or muscle mass [45, 49–51]. Nonetheless, calcineurin’s role in myoblast fusion is well established [52–54] and recent evidence has shown that calcineurin activation, specifically through NFATc1, increases the expression of a phosphatidylserine receptor, stabilin-2, and that without stabilin-2, myoblast fusion, myofiber size, and muscle mass are severely reduced [40]. According to the myonuclear domain theory, an increase in the relative amount of nuclei per fibre, via enhanced myoblast fusion to pre-existing myofibers, will increase myofiber size and overall muscle mass [54, 55]. Collectively, our results suggest that the blunted calcineurin signalling in the PlnOE/SlnKO mice reduces stabilin-2 expression and likely impairs myoblast fusion, thereby contributing to the reductions in soleus size, type II fiber CSA, and force generation.
Impairments in stabilin-2 and myoblast fusion could also contribute to the reduction in total fiber count we observed in the PlnOE/SlnKO mice, possibly via impaired muscle regeneration. While calcineurin’s role in muscle regeneration has been well established [56–58], it is important to note that CNMs, including the PlnOE mouse, generally do not display signs of extensive muscle regeneration [3, 59]. Alternatively, although excessive autophagy could be detrimental and may lead to muscle atrophy [60], impaired autophagy also results in extensive myofiber degeneration [61]. Therefore, the impaired activation of autophagic signaling in the PlnOE/SlnKO soleus could also contribute to the reductions in total fiber count. Collectively, these results indicate that failure to promote both calcineurin and autophagic signaling in the PlnOE/SlnKO soleus, unlike the PlnOE soleus, likely contribute to the hypoplasia and the exacerbated muscle atrophy and weakness in this model.
Upregulated SLN is a hallmark of several muscle diseases [5–12] but it’s unknown whether that response is adaptive or pathogenic. This is the first study to examine the role of SLN upregulation in any form of muscle myopathy and our results indicate that SLN upregulation is an adaptive response that may be required for optimal activation of calcineurin to combat the muscle atrophy and weakness that occurs in the PlnOE soleus. In the dystrophic mdx mouse model, the affected skeletal muscles show large upregulation of SLN [7], and given the data presented here, this increase in SLN could potentially aid in activating calcineurin and autophagic signaling, both of which have been shown to be promising therapeutic strategies [57, 62–66]. In addition, corticosteroid [63] and high-fat feeding [67] can ameliorate dystrophic pathology in mdx mice, and both treatments lead to an increase in SLN expression [9, 31, 68]. Future studies aimed at examining the role of SLN across these different myopathies could further reveal the importance of SLN in overall muscle health.
An unresolved issue is why Sln deletion did not result in increased Ca2+ uptake and SERCA activity in soleus homogenates, given that Sln deletion alone, without Pln overexpression, increased the apparent affinity of SERCA for Ca2+ by 0.1 pCa units in soleus homogenates compared with WT [20], an effect that we reproduced here (data not shown). Further analysis of PLN’s phosphorylation status or the expression of other major Ca2+ regulatory proteins such as SERCA1a, SERCA2a, RyR, DHPR, and CSQ do not provide a likely explanation. Sln deletion in PlnOE mice primarily affected the type II fibers (ie. attenuated type II fiber hypertrophy and fast-to-slow fiber type shift). Therefore, it is possible that SLN upregulation in soleus from PlnOE mice is occurring primarily in the overloaded type II fibers that do not overexpress PLN. In support of this view, previous findings from our laboratory show that SLN is predominantly expressed in type II fibers from human vastus lateralis [28]. If SLN upregulation occurs primarily in the type II fibers, there would be less potential for superinhibition to occur, and any improvement in SERCA function expected in the type II fibers after Sln deletion could be masked by the level of PLN overexpression that occurs in the type I fibers, which comprise more than 55% of the muscle fibers. Thus, our study is limited in measuring SERCA function in whole homogenates, but if it was possible to measure SERCA activity specifically in type II fibers then we would expect increased activity in PlnOE/SlnKO compared with PlnOE, which would correspond with the blunted calcineurin activity we observed in PlnOE/SlnKO soleus.
Our work also sheds light on the differences between PLN and SLN function in skeletal muscle. Our findings showing that PLN overexpression causes myopathy and muscle atrophy whereas SLN upregulation counters it, adds to the notion that PLN and SLN may not be functionally redundant [69]. Indeed, unlike the muscle weakness observed in PlnOE mice [3, 22], SlnOE mice present with enhanced contractility [70]. It also appears that PLN is different from SLN in its ability to regulate calcineurin signaling since PLN overexpression alone without SLN upregulation resulted in greatly reduced calcineurin signaling. Given that both PLN and SLN are capable of inhibiting SERCA [13, 71, 72], it is surprising that only SLN seems to be a significant regulator of calcineurin. Similarly, it appears that SLN but not PLN is capable of altering autophagy in skeletal muscle since PLN overexpression alone without SLN upregulation did not increase autophagic signaling. We speculate that SLN’s influence on energy expenditure [73] may have a role in activating autophagy, whereas PLN may not have the same influence on ATP consumption in muscle [74], but this needs to be explored further.
In summary, we have found that SLN is upregulated in the soleus muscles from PLN overexpressing mice to combat muscle atrophy and weakness by promoting the compensatory type II fiber hypertrophy and maintaining total myofiber number through calcineurin activation and autophagic signaling. We did not find any alterations in the CNM phenotype in the PlnOE/SlnKO soleus, which suggests that SLN likely has no contribution to CNM pathology. Increased SLN expression is a hallmark of muscle disease, which may represent an adaptive response that is necessary for muscle growth and remodeling and future studies should determine whether SLN provides a novel therapeutic target for other neuromuscular disorders.
Supporting information
(XLSX)
Acknowledgments
We thank Adrienne Boone for her technical help with TEM analysis. We thank Dawn McCutcheon and Jean Flanagan for their expertise in generating mouse breeding colonies, and the Animal Health Technicians at the University of Waterloo for their help in maintaining them. We thank Dr. Muthu Periasamy (Sanford, Bernam, Orlando, USA) for providing the SlnKO mice. This work was supported by research grants from the Canadian Institutes of Health Research (CIHR; MOP 86618 and MOP 47296 to A.R.T). A doctoral award from CIHR supported V.A.F. and doctoral awards from NSERC supported A.M. and D.B.
Data Availability
All relevant data are included within the manuscript and its Supporting Information files.
Funding Statement
This work was supported by research grants from the Canadian Institutes of Health Research (MOP 86618 and MOP 47296 to A.R.T). A doctoral award from the Canadian Institutes of Health Research supported V.A.F. and doctoral awards from the Natural Sciences and Engineering Research Council supported A.M. and D.B.
References
- 1.Gamu D, Bombardier E, Smith IC, Fajardo VA, Tupling AR. Sarcolipin provides a novel muscle-based mechanism for adaptive thermogenesis. Exercise and sport sciences reviews. 2014;42(3):136–42. Epub 2014/06/21. 10.1249/JES.0000000000000016 [DOI] [PubMed] [Google Scholar]
- 2.MacLennan DH, Kranias EG. Phospholamban: a crucial regulator of cardiac contractility. Nat Rev Mol Cell Biol. 2003;4(7):566–77. Epub 2003/07/03. 10.1038/nrm1151 [DOI] [PubMed] [Google Scholar]
- 3.Fajardo VA, Bombardier E, McMillan E, Tran K, Wadsworth BJ, Gamu D, et al. Phospholamban overexpression in mice causes a centronuclear myopathy-like phenotype. Dis Model Mech. 2015;8(8):999–1009. Epub 2015/06/03. 10.1242/dmm.020859 [DOI] [PMC free article] [PubMed] [Google Scholar]
- 4.Romero NB. Centronuclear myopathies: a widening concept. Neuromuscul Disord. 2010;20(4):223–8. Epub 2010/02/26. 10.1016/j.nmd.2010.01.014 [DOI] [PubMed] [Google Scholar]
- 5.Calvo AC, Manzano R, Atencia-Cibreiro G, Olivan S, Munoz MJ, Zaragoza P, et al. Genetic biomarkers for ALS disease in transgenic SOD1(G93A) mice. PLoS One. 2012;7(3):e32632 Epub 2012/03/14. 10.1371/journal.pone.0032632 [DOI] [PMC free article] [PubMed] [Google Scholar]
- 6.Ottenheijm CA, Fong C, Vangheluwe P, Wuytack F, Babu GJ, Periasamy M, et al. Sarcoplasmic reticulum calcium uptake and speed of relaxation are depressed in nebulin-free skeletal muscle. FASEB J. 2008;22(8):2912–9. Epub 2008/04/25. 10.1096/fj.07-104372 [DOI] [PMC free article] [PubMed] [Google Scholar]
- 7.Schneider JS, Shanmugam M, Gonzalez JP, Lopez H, Gordan R, Fraidenraich D, et al. Increased sarcolipin expression and decreased sarco(endo)plasmic reticulum Ca2+ uptake in skeletal muscles of mouse models of Duchenne muscular dystrophy. J Muscle Res Cell Motil. 2013;34(5–6):349–56. Epub 2013/06/12. 10.1007/s10974-013-9350-0 [DOI] [PubMed] [Google Scholar]
- 8.Osborne RJ, Lin X, Welle S, Sobczak K, O'Rourke JR, Swanson MS, et al. Transcriptional and post-transcriptional impact of toxic RNA in myotonic dystrophy. Hum Mol Genet. 2009;18(8):1471–81. Epub 2009/02/19. PubMed Central PMCID: PMC2664149. 10.1093/hmg/ddp058 [DOI] [PMC free article] [PubMed] [Google Scholar]
- 9.Gayan-Ramirez G, Vanzeir L, Wuytack F, Decramer M. Corticosteroids decrease mRNA levels of SERCA pumps, whereas they increase sarcolipin mRNA in the rat diaphragm. J Physiol. 2000;524 Pt 2:387–97. Epub 2000/04/15. [DOI] [PMC free article] [PubMed] [Google Scholar]
- 10.Nakagawa O, Arnold M, Nakagawa M, Hamada H, Shelton JM, Kusano H, et al. Centronuclear myopathy in mice lacking a novel muscle-specific protein kinase transcriptionally regulated by MEF2. Genes Dev. 2005;19(17):2066–77. Epub 2005/09/06. 10.1101/gad.1338705 [DOI] [PMC free article] [PubMed] [Google Scholar]
- 11.Liu N, Bezprozvannaya S, Shelton JM, Frisard MI, Hulver MW, McMillan RP, et al. Mice lacking microRNA 133a develop dynamin 2-dependent centronuclear myopathy. J Clin Invest. 2011;121(8):3258–68. Epub 2011/07/09. 10.1172/JCI46267 [DOI] [PMC free article] [PubMed] [Google Scholar]
- 12.Campanaro S, Romualdi C, Fanin M, Celegato B, Pacchioni B, Trevisan S, et al. Gene expression profiling in dysferlinopathies using a dedicated muscle microarray. Hum Mol Genet. 2002;11(26):3283–98. Epub 2002/12/10. [DOI] [PubMed] [Google Scholar]
- 13.Asahi M, Kurzydlowski K, Tada M, MacLennan DH. Sarcolipin inhibits polymerization of phospholamban to induce superinhibition of sarco(endo)plasmic reticulum Ca2+-ATPases (SERCAs). J Biol Chem. 2002;277(30):26725–8. Epub 2002/05/29. 10.1074/jbc.C200269200 [DOI] [PubMed] [Google Scholar]
- 14.Jungbluth H, Zhou H, Sewry CA, Robb S, Treves S, Bitoun M, et al. Centronuclear myopathy due to a de novo dominant mutation in the skeletal muscle ryanodine receptor (RYR1) gene. Neuromuscul Disord. 2007;17(4):338–45. Epub 2007/03/23. 10.1016/j.nmd.2007.01.016 [DOI] [PubMed] [Google Scholar]
- 15.Wilmshurst JM, Lillis S, Zhou H, Pillay K, Henderson H, Kress W, et al. RYR1 mutations are a common cause of congenital myopathies with central nuclei. Ann Neurol. 2010;68(5):717–26. Epub 2010/09/15. 10.1002/ana.22119 [DOI] [PubMed] [Google Scholar]
- 16.Altamirano F, Lopez JR, Henriquez C, Molinski T, Allen PD, Jaimovich E. Increased resting intracellular calcium modulates NF-kappaB-dependent inducible nitric-oxide synthase gene expression in dystrophic mdx skeletal myotubes. J Biol Chem. 2012;287(25):20876–87. Epub 2012/05/03. 10.1074/jbc.M112.344929 [DOI] [PMC free article] [PubMed] [Google Scholar]
- 17.Murphy RM, Dutka TL, Horvath D, Bell JR, Delbridge LM, Lamb GD. Ca2+-dependent proteolysis of junctophilin-1 and junctophilin-2 in skeletal and cardiac muscle. J Physiol. 2013;591(Pt 3):719–29. Epub 2012/11/14. [DOI] [PMC free article] [PubMed] [Google Scholar]
- 18.Murphy RM, Verburg E, Lamb GD. Ca2+ activation of diffusible and bound pools of mu-calpain in rat skeletal muscle. J Physiol. 2006;576(Pt 2):595–612. Epub 2006/07/22. 10.1113/jphysiol.2006.114090 [DOI] [PMC free article] [PubMed] [Google Scholar]
- 19.Tupling AR, Asahi M, MacLennan DH. Sarcolipin overexpression in rat slow twitch muscle inhibits sarcoplasmic reticulum Ca2+ uptake and impairs contractile function. J Biol Chem. 2002;277(47):44740–6. Epub 2002/09/19. 10.1074/jbc.M206171200 [DOI] [PubMed] [Google Scholar]
- 20.Tupling AR, Bombardier E, Gupta SC, Hussain D, Vigna C, Bloemberg D, et al. Enhanced Ca2+ transport and muscle relaxation in skeletal muscle from sarcolipin-null mice. Am J Physiol Cell Physiol. 2011;301(4):C841–9. Epub 2011/06/24. 10.1152/ajpcell.00409.2010 [DOI] [PMC free article] [PubMed] [Google Scholar]
- 21.Babu GJ, Bhupathy P, Timofeyev V, Petrashevskaya NN, Reiser PJ, Chiamvimonvat N, et al. Ablation of sarcolipin enhances sarcoplasmic reticulum calcium transport and atrial contractility. Proc Natl Acad Sci U S A. 2007;104(45):17867–72. Epub 2007/11/01. 10.1073/pnas.0707722104 [DOI] [PMC free article] [PubMed] [Google Scholar]
- 22.Song Q, Young KB, Chu G, Gulick J, Gerst M, Grupp IL, et al. Overexpression of phospholamban in slow-twitch skeletal muscle is associated with depressed contractile function and muscle remodeling. FASEB J. 2004;18(9):974–6. Epub 2004/04/03. 10.1096/fj.03-1058fje [DOI] [PubMed] [Google Scholar]
- 23.Knotts S, Rindt H, Neumann J, Robbins J. In vivo regulation of the mouse beta myosin heavy chain gene. J Biol Chem. 1994;269(49):31275–82. Epub 1994/12/09. [PubMed] [Google Scholar]
- 24.Rindt H, Gulick J, Knotts S, Neumann J, Robbins J. In vivo analysis of the murine beta-myosin heavy chain gene promoter. J Biol Chem. 1993;268(7):5332–8. Epub 1993/03/05. [PubMed] [Google Scholar]
- 25.Rindt H, Knotts S, Robbins J. Segregation of cardiac and skeletal muscle-specific regulatory elements of the beta-myosin heavy chain gene. Proc Natl Acad Sci U S A. 1995;92(5):1540–4. Epub 1995/02/28. [DOI] [PMC free article] [PubMed] [Google Scholar]
- 26.Duhamel TA, Green HJ, Stewart RD, Foley KP, Smith IC, Ouyang J. Muscle metabolic, SR Ca(2+) -cycling responses to prolonged cycling, with and without glucose supplementation. J Appl Physiol (1985). 2007;103(6):1986–98. Epub 2007/10/06. [DOI] [PubMed] [Google Scholar]
- 27.Tupling R, Green H. Silver ions induce Ca2+ release from the SR in vitro by acting on the Ca2+ release channel and the Ca2+ pump. J Appl Physiol (1985). 2002;92(4):1603–10. Epub 2002/03/16. [DOI] [PubMed] [Google Scholar]
- 28.Fajardo VA, Bombardier E, Vigna C, Devji T, Bloemberg D, Gamu D, et al. Co-Expression of SERCA Isoforms, Phospholamban and Sarcolipin in Human Skeletal Muscle Fibers. PLoS One. 2013;8(12):e84304 Epub 2013/12/21. 10.1371/journal.pone.0084304 [DOI] [PMC free article] [PubMed] [Google Scholar]
- 29.Zubrzycka-Gaarn E, MacDonald G, Phillips L, Jorgensen AO, MacLennan DH. Monoclonal antibodies to the Ca2+ + Mg2+-dependent ATPase of sarcoplasmic reticulum identify polymorphic forms of the enzyme and indicate the presence in the enzyme of a classical high-affinity Ca2+ binding site. J Bioenerg Biomembr. 1984;16(5–6):441–64. Epub 1984/12/01. [DOI] [PubMed] [Google Scholar]
- 30.Bloemberg D, Quadrilatero J. Rapid determination of myosin heavy chain expression in rat, mouse, and human skeletal muscle using multicolor immunofluorescence analysis. PLoS One. 2012;7(4):e35273 Epub 2012/04/25. 10.1371/journal.pone.0035273 [DOI] [PMC free article] [PubMed] [Google Scholar]
- 31.Bombardier E, Smith IC, Gamu D, Fajardo VA, Vigna C, Sayer RA, et al. Sarcolipin trumps beta-adrenergic receptor signaling as the favored mechanism for muscle-based diet-induced thermogenesis. FASEB J. 2013;27(9):3871–8. Epub 2013/06/12. 10.1096/fj.13-230631 [DOI] [PMC free article] [PubMed] [Google Scholar]
- 32.Al-Qusairi L, Laporte J. T-tubule biogenesis and triad formation in skeletal muscle and implication in human diseases. Skelet Muscle. 2011;1(1):26 Epub 2011/07/30. PubMed Central PMCID: PMC3156648. 10.1186/2044-5040-1-26 [DOI] [PMC free article] [PubMed] [Google Scholar]
- 33.Al-Qusairi L, Weiss N, Toussaint A, Berbey C, Messaddeq N, Kretz C, et al. T-tubule disorganization and defective excitation-contraction coupling in muscle fibers lacking myotubularin lipid phosphatase. Proc Natl Acad Sci U S A. 2009;106(44):18763–8. Epub 2009/10/23. PubMed Central PMCID: PMC2773964. 10.1073/pnas.0900705106 [DOI] [PMC free article] [PubMed] [Google Scholar]
- 34.Dowling JJ, Lawlor MW, Dirksen RT. Triadopathies: an emerging class of skeletal muscle diseases. Neurotherapeutics: the journal of the American Society for Experimental NeuroTherapeutics. 2014;11(4):773–85. Epub 2014/08/30. [DOI] [PMC free article] [PubMed] [Google Scholar]
- 35.Dowling JJ, Vreede AP, Low SE, Gibbs EM, Kuwada JY, Bonnemann CG, et al. Loss of myotubularin function results in T-tubule disorganization in zebrafish and human myotubular myopathy. PLoS Genet. 2009;5(2):e1000372 Epub 2009/02/07. 10.1371/journal.pgen.1000372 [DOI] [PMC free article] [PubMed] [Google Scholar]
- 36.Dunn SE, Burns JL, Michel RN. Calcineurin is required for skeletal muscle hypertrophy. J Biol Chem. 1999;274(31):21908–12. Epub 1999/07/27. [DOI] [PubMed] [Google Scholar]
- 37.Ito N, Ruegg UT, Kudo A, Miyagoe-Suzuki Y, Takeda S. Activation of calcium signaling through Trpv1 by nNOS and peroxynitrite as a key trigger of skeletal muscle hypertrophy. Nat Med. 2013;19(1):101–6. Epub 2012/12/04. 10.1038/nm.3019 [DOI] [PubMed] [Google Scholar]
- 38.Semsarian C, Wu MJ, Ju YK, Marciniec T, Yeoh T, Allen DG, et al. Skeletal muscle hypertrophy is mediated by a Ca2+-dependent calcineurin signalling pathway. Nature. 1999;400(6744):576–81. Epub 1999/08/17. 10.1038/23054 [DOI] [PubMed] [Google Scholar]
- 39.Maurya SK, Bal NC, Sopariwala DH, Pant M, Rowland LA, Shaikh SA, et al. Sarcolipin Is a Key Determinant of the Basal Metabolic Rate, and Its Overexpression Enhances Energy Expenditure and Resistance against Diet-induced Obesity. J Biol Chem. 2015;290(17):10840–9. Epub 2015/02/26. 10.1074/jbc.M115.636878 [DOI] [PMC free article] [PubMed] [Google Scholar]
- 40.Park SY, Yun Y, Lim JS, Kim MJ, Kim SY, Kim JE, et al. Stabilin-2 modulates the efficiency of myoblast fusion during myogenic differentiation and muscle regeneration. Nature communications. 2016;7:10871 Epub 2016/03/15. PubMed Central PMCID: PMC4793076. 10.1038/ncomms10871 [DOI] [PMC free article] [PubMed] [Google Scholar]
- 41.Michel RN, Dunn SE, Chin ER. Calcineurin and skeletal muscle growth. The Proceedings of the Nutrition Society. 2004;63(2):341–9. Epub 2004/08/06. 10.1079/PNS2004362 [DOI] [PubMed] [Google Scholar]
- 42.Frey N, Frank D, Lippl S, Kuhn C, Kogler H, Barrientos T, et al. Calsarcin-2 deficiency increases exercise capacity in mice through calcineurin/NFAT activation. J Clin Invest. 2008;118(11):3598–608. Epub 2008/10/11. PubMed Central PMCID: PMC2564612. 10.1172/JCI36277 [DOI] [PMC free article] [PubMed] [Google Scholar]
- 43.Chin ER, Olson EN, Richardson JA, Yang Q, Humphries C, Shelton JM, et al. A calcineurin-dependent transcriptional pathway controls skeletal muscle fiber type. Genes Dev. 1998;12(16):2499–509. Epub 1998/08/26. PubMed Central PMCID: PMC317085. [DOI] [PMC free article] [PubMed] [Google Scholar]
- 44.Musaro A, McCullagh KJ, Naya FJ, Olson EN, Rosenthal N. IGF-1 induces skeletal myocyte hypertrophy through calcineurin in association with GATA-2 and NF-ATc1. Nature. 1999;400(6744):581–5. Epub 1999/08/17. 10.1038/23060 [DOI] [PubMed] [Google Scholar]
- 45.Naya FJ, Mercer B, Shelton J, Richardson JA, Williams RS, Olson EN. Stimulation of slow skeletal muscle fiber gene expression by calcineurin in vivo. J Biol Chem. 2000;275(7):4545–8. Epub 2000/02/15. [DOI] [PubMed] [Google Scholar]
- 46.Michel RN, Chin ER, Chakkalakal JV, Eibl JK, Jasmin BJ. Ca2+/calmodulin-based signalling in the regulation of the muscle fibre phenotype and its therapeutic potential via modulation of utrophin A and myostatin expression. Applied physiology, nutrition, and metabolism = Physiologie appliquee, nutrition et metabolisme. 2007;32(5):921–9. Epub 2007/12/07. 10.1139/H07-093 [DOI] [PubMed] [Google Scholar]
- 47.Bodine SC, Stitt TN, Gonzalez M, Kline WO, Stover GL, Bauerlein R, et al. Akt/mTOR pathway is a crucial regulator of skeletal muscle hypertrophy and can prevent muscle atrophy in vivo. Nat Cell Biol. 2001;3(11):1014–9. 10.1038/ncb1101-1014 [DOI] [PubMed] [Google Scholar]
- 48.Serrano AL, Murgia M, Pallafacchina G, Calabria E, Coniglio P, Lomo T, et al. Calcineurin controls nerve activity-dependent specification of slow skeletal muscle fibers but not muscle growth. Proc Natl Acad Sci U S A. 2001;98(23):13108–13. PubMed Central PMCID: PMCPMC60832. 10.1073/pnas.231148598 [DOI] [PMC free article] [PubMed] [Google Scholar]
- 49.Parsons SA, Millay DP, Wilkins BJ, Bueno OF, Tsika GL, Neilson JR, et al. Genetic loss of calcineurin blocks mechanical overload-induced skeletal muscle fiber type switching but not hypertrophy. J Biol Chem. 2004;279(25):26192–200. Epub 2004/04/15. 10.1074/jbc.M313800200 [DOI] [PubMed] [Google Scholar]
- 50.Parsons SA, Wilkins BJ, Bueno OF, Molkentin JD. Altered skeletal muscle phenotypes in calcineurin Aalpha and Abeta gene-targeted mice. Mol Cell Biol. 2003;23(12):4331–43. PubMed Central PMCID: PMCPMC156151. 10.1128/MCB.23.12.4331-4343.2003 [DOI] [PMC free article] [PubMed] [Google Scholar]
- 51.Dunn SE, Chin ER, Michel RN. Matching of calcineurin activity to upstream effectors is critical for skeletal muscle fiber growth. J Cell Biol. 2000;151(3):663–72. Epub 2000/11/04. PubMed Central PMCID: PMC2185582. [DOI] [PMC free article] [PubMed] [Google Scholar]
- 52.Horsley V, Friday BB, Matteson S, Kegley KM, Gephart J, Pavlath GK. Regulation of the growth of multinucleated muscle cells by an NFATC2-dependent pathway. J Cell Biol. 2001;153(2):329–38. Epub 2001/04/20. PubMed Central PMCID: PMC2169453. [DOI] [PMC free article] [PubMed] [Google Scholar]
- 53.Horsley V, Jansen KM, Mills ST, Pavlath GK. IL-4 acts as a myoblast recruitment factor during mammalian muscle growth. Cell. 2003;113(4):483–94. Epub 2003/05/22. [DOI] [PubMed] [Google Scholar]
- 54.Horsley V, Pavlath GK. Prostaglandin F2(alpha) stimulates growth of skeletal muscle cells via an NFATC2-dependent pathway. J Cell Biol. 2003;161(1):111–8. Epub 2003/04/16. PubMed Central PMCID: PMC2172881. 10.1083/jcb.200208085 [DOI] [PMC free article] [PubMed] [Google Scholar]
- 55.Allen DL, Roy RR, Edgerton VR. Myonuclear domains in muscle adaptation and disease. Muscle Nerve. 1999;22(10):1350–60. Epub 1999/09/17. [DOI] [PubMed] [Google Scholar]
- 56.Sakuma K, Nishikawa J, Nakao R, Watanabe K, Totsuka T, Nakano H, et al. Calcineurin is a potent regulator for skeletal muscle regeneration by association with NFATc1 and GATA-2. Acta Neuropathol. 2003;105(3):271–80. Epub 2003/01/31. 10.1007/s00401-002-0647-0 [DOI] [PubMed] [Google Scholar]
- 57.Stupka N, Michell BJ, Kemp BE, Lynch GS. Differential calcineurin signalling activity and regeneration efficacy in diaphragm and limb muscles of dystrophic mdx mice. Neuromuscul Disord. 2006;16(5):337–46. Epub 2006/04/20. 10.1016/j.nmd.2006.03.003 [DOI] [PubMed] [Google Scholar]
- 58.Stupka N, Schertzer JD, Bassel-Duby R, Olson EN, Lynch GS. Calcineurin-A alpha activation enhances the structure and function of regenerating muscles after myotoxic injury. Am J Physiol Regul Integr Comp Physiol. 2007;293(2):R686–94. Epub 2007/05/04. 10.1152/ajpregu.00612.2006 [DOI] [PubMed] [Google Scholar]
- 59.Jungbluth H, Wallgren-Pettersson C, Laporte J. Centronuclear (myotubular) myopathy. Orphanet J Rare Dis. 2008;3:26 Epub 2008/09/27. 10.1186/1750-1172-3-26 [DOI] [PMC free article] [PubMed] [Google Scholar]
- 60.Sandri M. Autophagy in skeletal muscle. FEBS Lett. 2010;584(7):1411–6. Epub 2010/02/06. 10.1016/j.febslet.2010.01.056 [DOI] [PubMed] [Google Scholar]
- 61.Masiero E, Agatea L, Mammucari C, Blaauw B, Loro E, Komatsu M, et al. Autophagy is required to maintain muscle mass. Cell metabolism. 2009;10(6):507–15. Epub 2009/12/01. 10.1016/j.cmet.2009.10.008 [DOI] [PubMed] [Google Scholar]
- 62.Chakkalakal JV, Harrison MA, Carbonetto S, Chin E, Michel RN, Jasmin BJ. Stimulation of calcineurin signaling attenuates the dystrophic pathology in mdx mice. Hum Mol Genet. 2004;13(4):379–88. Epub 2003/12/19. 10.1093/hmg/ddh037 [DOI] [PubMed] [Google Scholar]
- 63.St-Pierre SJ, Chakkalakal JV, Kolodziejczyk SM, Knudson JC, Jasmin BJ, Megeney LA. Glucocorticoid treatment alleviates dystrophic myofiber pathology by activation of the calcineurin/NF-AT pathway. FASEB J. 2004;18(15):1937–9. Epub 2004/10/01. 10.1096/fj.04-1859fje [DOI] [PubMed] [Google Scholar]
- 64.Stupka N, Schertzer JD, Bassel-Duby R, Olson EN, Lynch GS. Stimulation of calcineurin Aalpha activity attenuates muscle pathophysiology in mdx dystrophic mice. Am J Physiol Regul Integr Comp Physiol. 2008;294(3):R983–92. Epub 2008/01/18. 10.1152/ajpregu.00375.2007 [DOI] [PubMed] [Google Scholar]
- 65.De Palma C, Morisi F, Cheli S, Pambianco S, Cappello V, Vezzoli M, et al. Autophagy as a new therapeutic target in Duchenne muscular dystrophy. Cell death & disease. 2012;3:e418. Epub 2012/11/16. PubMed Central PMCID: PMC3542595. [DOI] [PMC free article] [PubMed] [Google Scholar]
- 66.Pauly M, Daussin F, Burelle Y, Li T, Godin R, Fauconnier J, et al. AMPK activation stimulates autophagy and ameliorates muscular dystrophy in the mdx mouse diaphragm. Am J Pathol. 2012;181(2):583–92. Epub 2012/06/12. 10.1016/j.ajpath.2012.04.004 [DOI] [PubMed] [Google Scholar]
- 67.Radley-Crabb HG, Fiorotto ML, Grounds MD. The different impact of a high fat diet on dystrophic mdx and control C57Bl/10 mice. PLoS currents. 2011;3:RRN1276 Epub 2011/11/19. PubMed Central PMCID: PMC3217191. 10.1371/currents.RRN1276 [DOI] [PMC free article] [PubMed] [Google Scholar]
- 68.Bal NC, Maurya SK, Sopariwala DH, Sahoo SK, Gupta SC, Shaikh SA, et al. Sarcolipin is a newly identified regulator of muscle-based thermogenesis in mammals. Nat Med. 2012;18(10):1575–9. Epub 2012/09/11. 10.1038/nm.2897 [DOI] [PMC free article] [PubMed] [Google Scholar]
- 69.Shaikh SA, Sahoo SK, Periasamy M. Phospholamban and sarcolipin: Are they functionally redundant or distinct regulators of the Sarco(Endo)Plasmic Reticulum Calcium ATPase? J Mol Cell Cardiol. 2016;91:81–91. Epub 2016/01/09. 10.1016/j.yjmcc.2015.12.030 [DOI] [PMC free article] [PubMed] [Google Scholar]
- 70.Sopariwala DH, Pant M, Shaikh SA, Goonasekera SA, Molkentin JD, Weisleder N, et al. Sarcolipin overexpression improves muscle energetics and reduces fatigue. J Appl Physiol (1985). 2015;118(8):1050–8. Epub 2015/02/24. PubMed Central PMCID: PMC4398885. [DOI] [PMC free article] [PubMed] [Google Scholar]
- 71.Asahi M, Sugita Y, Kurzydlowski K, De Leon S, Tada M, Toyoshima C, et al. Sarcolipin regulates sarco(endo)plasmic reticulum Ca2+-ATPase (SERCA) by binding to transmembrane helices alone or in association with phospholamban. Proc Natl Acad Sci U S A. 2003;100(9):5040–5. Epub 2003/04/15. 10.1073/pnas.0330962100 [DOI] [PMC free article] [PubMed] [Google Scholar]
- 72.Gorski PA, Glaves JP, Vangheluwe P, Young HS. Sarco(endo)plasmic reticulum calcium ATPase (SERCA) inhibition by sarcolipin is encoded in its luminal tail. J Biol Chem. 2013;288(12):8456–67. Epub 2013/01/31. 10.1074/jbc.M112.446161 [DOI] [PMC free article] [PubMed] [Google Scholar]
- 73.Bombardier E, Smith IC, Vigna C, Fajardo VA, Tupling AR. Ablation of sarcolipin decreases the energy requirements for Ca2+ transport by sarco(endo)plasmic reticulum Ca2+-ATPases in resting skeletal muscle. FEBS Lett. 2013;587(11):1687–92. Epub 2013/05/01. 10.1016/j.febslet.2013.04.019 [DOI] [PubMed] [Google Scholar]
- 74.Sahoo SK, Shaikh SA, Sopariwala DH, Bal NC, Periasamy M. Sarcolipin protein interaction with sarco(endo)plasmic reticulum Ca2+ ATPase (SERCA) is distinct from phospholamban protein, and only sarcolipin can promote uncoupling of the SERCA pump. J Biol Chem. 2013;288(10):6881–9. Epub 2013/01/24. 10.1074/jbc.M112.436915 [DOI] [PMC free article] [PubMed] [Google Scholar]
Associated Data
This section collects any data citations, data availability statements, or supplementary materials included in this article.
Supplementary Materials
(XLSX)
Data Availability Statement
All relevant data are included within the manuscript and its Supporting Information files.