Figure 1.
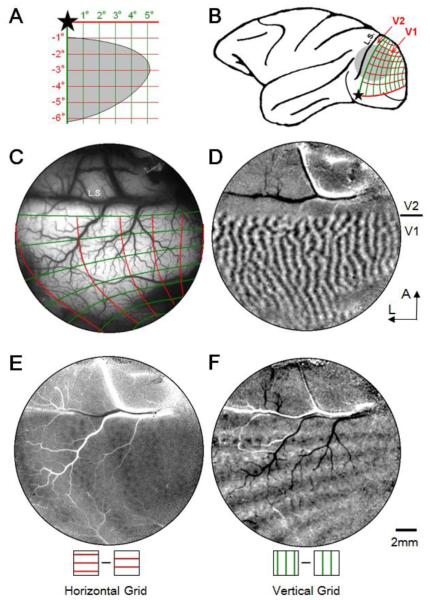
Determining retinotopic maps in macaque V1. A. Stimulus grid lines presented in lower right visual quadrant for left hemisphere mapping. Star: fovea location. Grid spacing: 1 degree. Line width: 0.1 deg. Gray area: visual field of the imaged field of view in V1 (illustrated in C). B. Location of imaging window (gray disk) on left hemisphere of a macaque brain. Red and green lines correspond to horizontal and vertical grid lines, respectively. L.S.: lunate sulcus. C-F: Cortical images obtained from an imaging window over V1 and V2 (gray disk in B). C. Summary of visual maps imaged in E and F. Surface blood vessel map with imaged retinotopic lines overlaid. Red and green lines correspond to those shown in A. Fovea is out of the window to the left. D. Ocular dominance map (left eye minus right eye subtraction map) illustrating V1/V2 border. A: anterior, L: lateral, applies to C-F. E. A subtraction map of two horizontal grids having 90-degree phase difference. F. A subtraction map of two vertical grids having 90-degree phase difference. Scale bar in F: 2mm applies to C-F.

