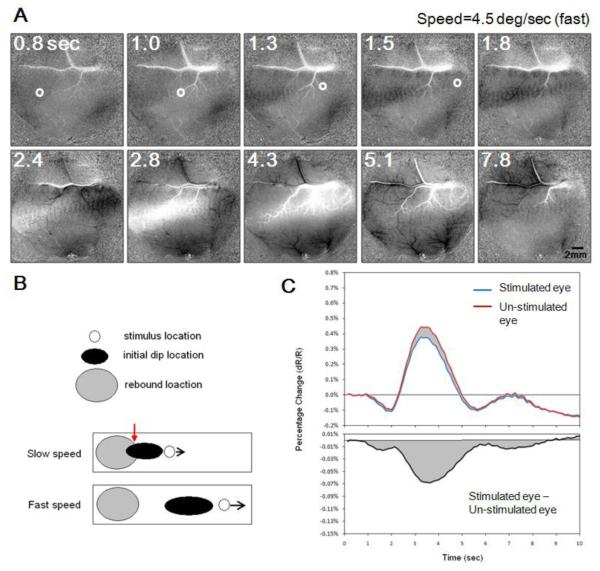
Figure. 3.
V1 Response to a fast moving spot. Conventions same as Figure 2 except dot speed is 4.5 deg/sec. Spot appeared at 0.5 second and disappeared at 1.5 second. A and C are plotted with the same conventions as A and C in Figure 2. B: Schematic illustrating spatial interactions between initial dip signal (black oval) and late positive rebound signal (gray oval). Stimulus location is represented as a white circle. At slow speed, the initial dip and late positive signal share spatial overlap (red arrow); at faster speed, these two signals are largely segregated which permit better temporal estimation. C: Similar to responses to a slow speed dot (Figure 2C), the global signal is tri-phasic (top panel) and domain-specific signal is always negative (bottom panel).

