Abstract
With age, hematopoietic stem cells (HSCs) lose their ability to regenerate the blood system, and promote disease development. Autophagy is associated with health and longevity, and is critical for protecting HSCs from metabolic stress. Here, we show that loss of autophagy in HSCs causes accumulation of mitochondria and an activated metabolic state, which drives accelerated myeloid differentiation mainly through epigenetic deregulations, and impairs HSC self-renewal activity and regenerative potential. Strikingly, the majority of HSCs in aged mice share these altered metabolic and functional features. However, ~ 1/3 of aged HSCs exhibit high autophagy levels and maintain a low metabolic state with robust long-term regeneration potential similar to healthy young HSCs. Our results demonstrate that autophagy actively suppresses HSC metabolism by clearing active, healthy mitochondria to maintain quiescence and stemness, and becomes increasingly necessary with age to preserve the regenerative capacity of old HSCs.
Aging is the greatest risk factor for many pathological conditions including cancers, neurodegenerative disorders, cardiovascular diseases, and diabetes1. Physiological aging is a complex and multifactorial process that is regulated by both genetic and environmental factors2. Although tissues across the body are seemingly affected in different ways, one emerging hallmark of aging is that reduction in tissue function usually correlates with a reduction in stem cell activity3. The blood system is critical for many aspects of organismal health, and proper maintenance of blood production relies on the ability of HSCs to self-renew and differentiate into all lineages of mature blood cells4. In adults, HSCs are rare and reside in specialized niches in the bone marrow (BM) cavity, where they are kept in a low metabolic, mainly glycolytic quiescent state unless called upon to regenerate the blood system5. With age, HSCs lose their regenerative abilities, but their overall expansion maintains blood production in old organisms, albeit with typical features of blood aging like anemia, immunosenescence, increased production of myeloid cells and higher predisposition to hematological cancers6. Yet, how old HSCs (oHSC) retain some functional abilities in an adverse aging BM microenvironment7,8 remains largely unknown.
Macroautophagy (hereafter called autophagy) is an essential proteostasis and stress response mechanism that maintains cellular health by regulating the quantity and quality of organelles and macromolecules through lysosomal degradation, and is activated in response to nutrient deprivation and other stressors to generate energy and allow survival9. Autophagy is controlled by a series of autophagy related genes (Atg) like the ATG12 conjugation system (Atg12-Atg5-Atg16), which are essential for the formation of double-membrane autophagosomes. Autophagy is regulated by important nutrient sensing pathways including the mechanistic target of rapamycin (mTOR) and 5′ AMP-activated protein kinase (AMPK), which inhibits and activates autophagy, respectively. Autophagy is critical for the proper development of the blood system10,11, for HSC mobilization12, and to allow adult HSCs to survive acute metabolic stress13. Autophagy declines with age in many tissues14, and reduced autophagy levels in muscle stem cells directly contribute to decreased regenerative potential and muscle atrophy15. In contrast, we previously found increased basal autophagy in oHSCs13. Here, we set out to identify how autophagy controls HSC function, and how changes in autophagy levels affect HSC aging.
Accelerated aging phenotypes upon loss of autophagy in HSCs
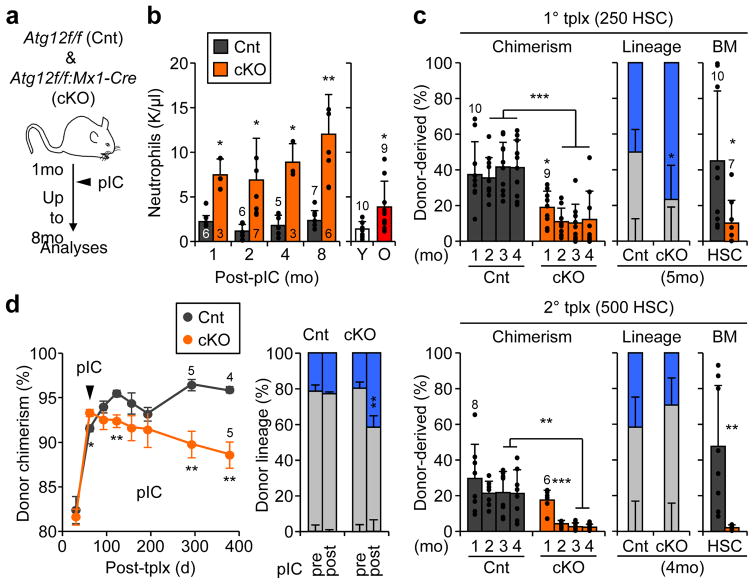
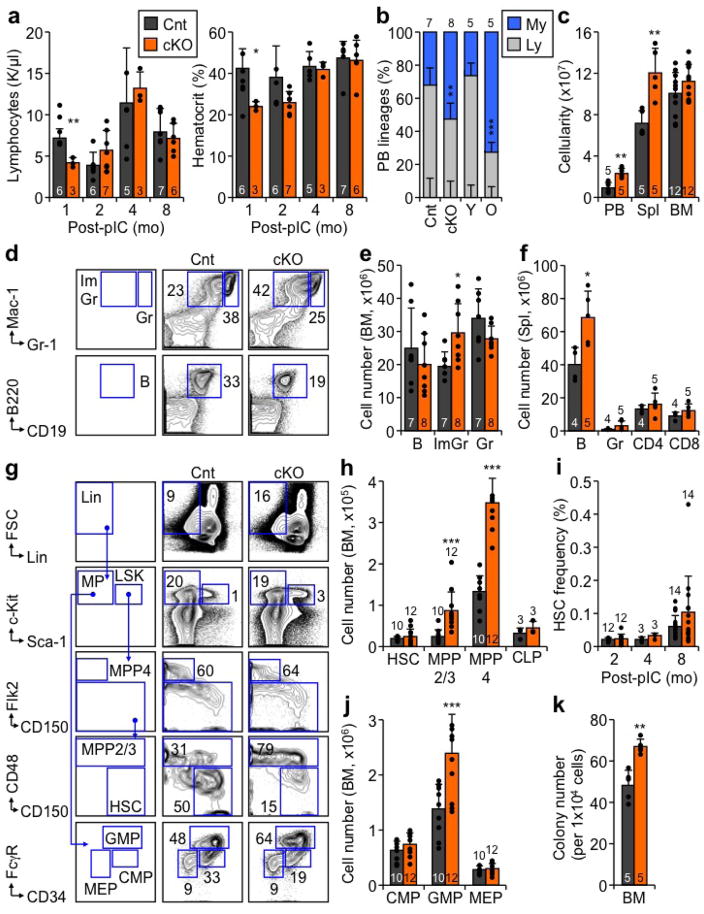
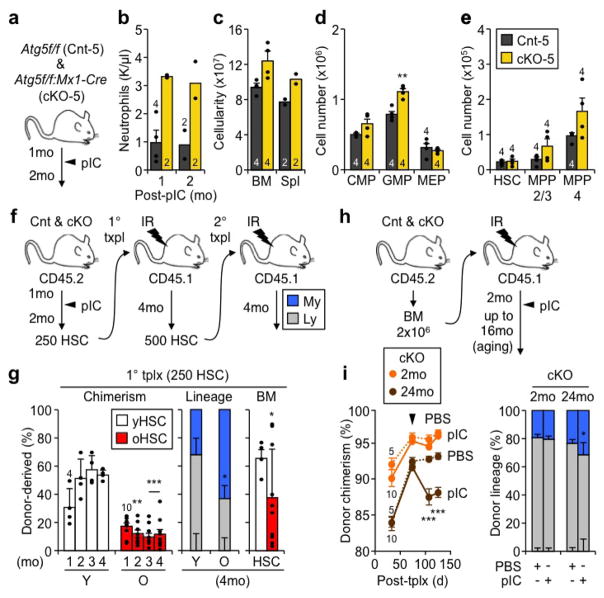
To inactivate autophagy in adult HSCs, we used our previously described Atg12flox/flox:Mx1-Cre conditional knockout (Atg12cKO) mouse model13, and deleted Atg12 with poly(I:C) (pIC) at 4 weeks of age (Fig. 1a). Surprisingly, the blood system of Atg12cKO mice remained largely healthy, with no persisting anemia or lymphopenia observed over time as reported in other contexts10,11,16 (Extended Data Fig. 1a). Similar to autophagy inactivation in fetal HSCs11, Atg12cKO mice showed increased cellularity in the peripheral blood (PB) and spleen, leading to a skewed ratio of circulating myeloid vs. lymphoid cells resembling the myeloid-bias observed in old mice (Fig. 1b, Extended Data Fig. 1b–f). In contrast, Atg12cKO mice maintained normal numbers of phenotypic HSCs (Lin−/c-Kit+/Sca-1+/Flk2−/CD48−/CD150+) over time, with expanded multipotent progenitor (MPP) and granulocyte/macrophage progenitor (GMP) compartments contributing to the myeloid expansion observed in Atg12cKO mice (Extended Data Fig. 1g–k). These phenotypes were conserved in a distinct Atg5flox/flox:Mx1-Cre conditional knockout (Atg5cKO) model (Extended Data Fig. 2a–e), and demonstrated features of premature blood aging in adult autophagy-deficient mice.
Figure 1. Accelerated blood aging phenotypes in autophagy-deficient mice.
a, Scheme for deleting Atg12 in the adult blood system. b, Neutrophil counts in peripheral blood (PB) of control (Cnt) and Atg12cKO (cKO) mice post-pIC (left), and young (Y) and old (O) mice (right); mo: month. c, Serial transplantations (tplx) of Cnt and cKO HSCs showing donor chimerism (left) and lineage distribution (center) in PB, and HSC chimerism (right) at the indicated times post-tplx in primary (top row) and secondary (bottom row) recipients. d, Atg12 deletion in recipients transplanted with 2×10⁶ BM cells from 2mo-old non-pIC treated Cnt and cKO donors showing donor chimerism in PB post-pIC (left; ± S.EM.) and lineage distribution at 61d (pre-pIC) and 291d (post-pIC) post-tplx (right). Data are mean ± S.D. except when indicated. *p ≤ 0.05, **p ≤ 0.01, ***p ≤ 0.001.
To investigate the regenerative capacity of Atg12cKO HSCs, we first performed classical transplantation experiments with purified HSCs to directly measure their self-renewal and multilineage reconstitution activity (Extended Data Fig. 2f). Transplantation of 250 Atg12cKO HSCs into lethally irradiated recipients led to significantly impaired engraftment, with reduced overall chimerism, myeloid-biased lineage distribution, and decreased numbers of regenerated HSCs (Fig. 1c). These features were further exacerbated upon secondary transplantation of 500 re-isolated Atg12cKO HSCs, and directly demonstrated defective self-renewal activity in autophagy-deficient HSCs that closely resembles the functional impairment of oHSCs (Extended Data Fig. 2g). To address whether the need for autophagy changed with age, we next transplanted 2×10⁶ BM cells from non-pIC treated animals into lethally irradiated mice, induced Atg12 deletion 2 months after transplantation, and followed the recipients for up to 16 months post-pIC treatment (Extended Data Fig. 2h). Of note, Atg12cKO mice could not be aged past 8 months post-pIC due to hepatomegaly from off-target deletion in the liver. Importantly, hematopoietic-specific deletion of Atg12 in transplanted mice led to a progressive age-related decline in donor-chimerism and myeloid-biased lineage distribution (Fig. 1d), thus confirming the cell-intrinsic nature of these defects. These aging features were further exacerbated upon deletion of autophagy in mice transplanted with BM cells from 24 month-old animals (Extended Data Fig. 2i). Collectively, these results indicate striking similarities between autophagy-deficient HSCs and oHSCs with defective self-renewal activity and myeloid-biased differentiation potential, and demonstrate that autophagy is most critical for HSC function during aging and in conditions of intense regenerative stress like transplantation.
Autophagy regulates HSC metabolism
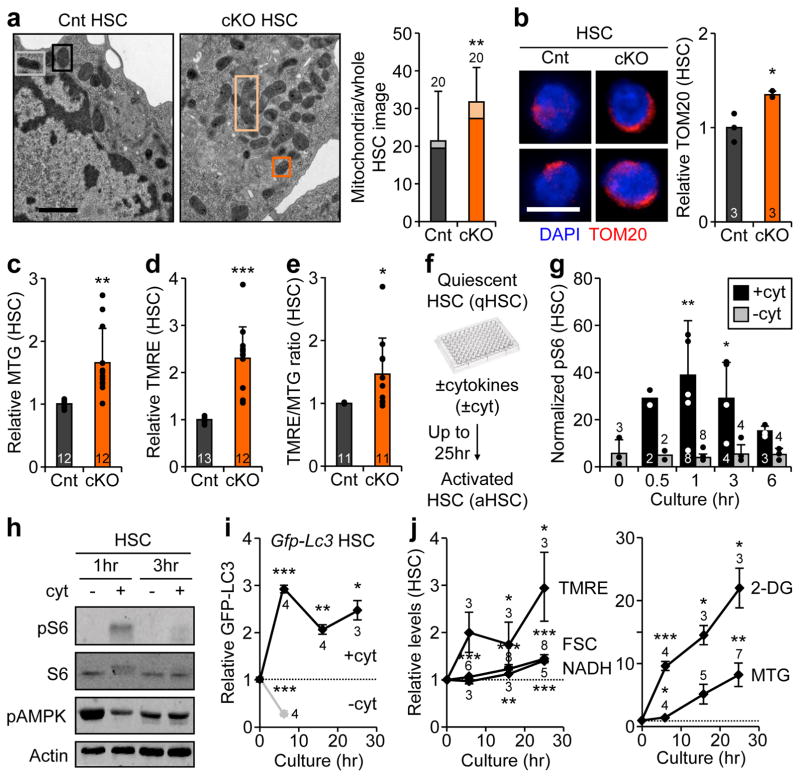
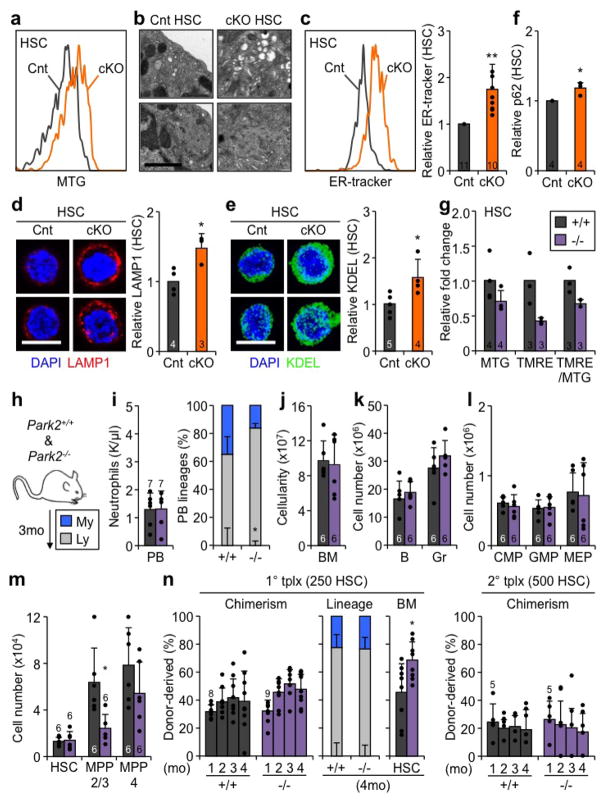
We next investigated how loss of autophagy impacts HSC function. Electron microscopy (EM) analyses revealed increased numbers of total and elongated, fused mitochondria in Atg12cKO HSCs, which was directly confirmed by immunofluorescence (IF) staining for the mitochondria protein TOM20 and flow cytometry (FC) measurements of mitochondria mass with Mitotracker Green (MTG) (Fig. 2a–c, and Extended Data Fig. 3a). Atg12cKO HSCs also had expanded endoplasmic reticulum and golgi compartments, and increased numbers of small vesicles and lysosomes, confirmed by IF staining and FC dye measurements (Extended Data Fig. 3b–e). These cellular features, together with elevated levels of p62 (Extended Data Fig. 3f) confirmed the loss of bulk autophagy in Atg12cKO HSCs, and suggest activation of alternative mechanisms of cellular recycling17 to allow HSC maintenance at steady state. Autophagy is known to degrade mitochondria through several pathways including the PINK1/PARK2 stress mitophagy pathway18, which specifically clears damaged mitochondria. HSCs from Park2−/− mice19 showed decreased levels of MTG, mitochondrial membrane potential dye tetramethylrhodamine-ethyl-ester (TMRE) and TMRE/MTG ratio, likely reflecting damaged mitochondria (Extended Data Fig. 3g). In contrast, Atg12cKO HSCs had increased TMRE levels and TMRE/MTG ratio, indicating more active mitochondria (Fig. 2d, e). Further characterization of Park2−/− mice also revealed no similarities to the phenotypes of Atg12cKO mice, and normal function of Park2−/− HSCs in transplantation experiments (Extended Data Fig. 3h–n). These results indicate that autophagy is most important for the clearance of healthy, active mitochondria in HSCs, as opposed to stress-induced specific removal of damaged mitochondria via mitophagy as recently studied20,21.
Figure 2. Mitochondrial characteristics in autophagy-deficient and activated HSCs.
a, Representative EM micrographs and quantification of total, normal (dark box) and elongated (light box) mitochondria in Cnt and cKO HSCs; scale bar, 1 μm. Statistical significance is for all three parameters, n indicate cell numbers. b, Representative TOM20 IF staining and quantification of mitochondria in Cnt and cKO HSCs. c–e, Mitochondria parameters in Cnt and cKO HSCs: (c) MTG levels, (d) TMRE levels, and (e) TMRE/MTG ratio. f–j, in vitro HSC activation: (f) experimental scheme (hr: hour); (g) pS6 levels measured by flow cytometry (results are normalized to IgG levels); (h) pS6, total S6, and pAMPK levels measured by Western blot (actin is used as loading control); (i) GFP-LC3 levels (n = 6 for 0hr; ± S.E.M.); and (j) mitochondrial parameters (n = 6 (TMRE), 10 (FSC), 7 (NADH), 4 (2-DG) and 7 (MTG) at 0hr; ±S.E.M.). Data are mean ± S.D. except when indicated, and are expressed relative to Cnt HSC (a-e) or 0hr HSC (g, i, j) levels. *p ≤ 0.05, **p ≤ 0.01, ***p ≤ 0.001.
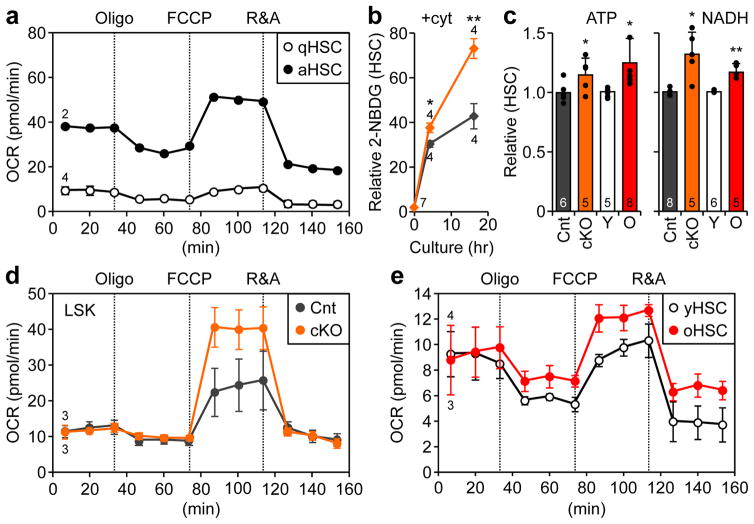
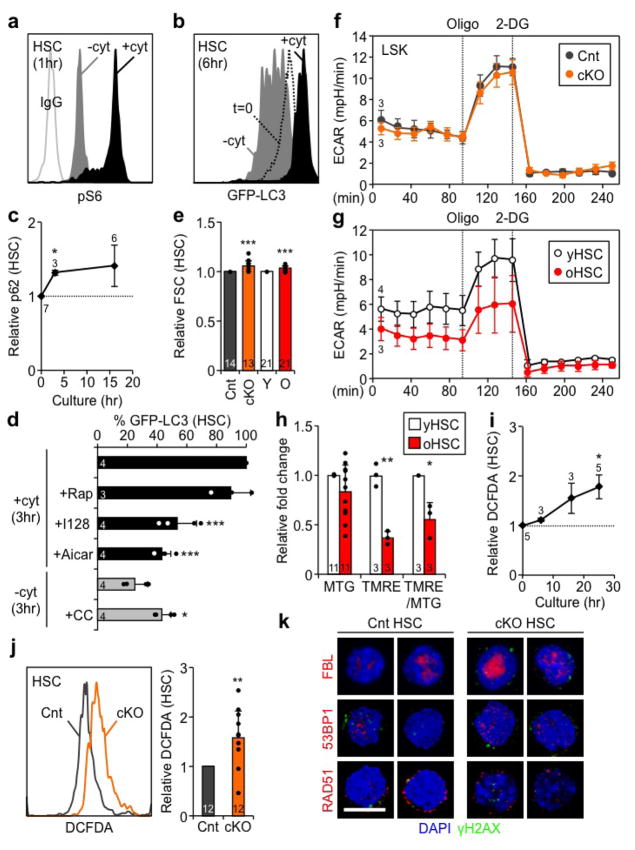
To understand the link between autophagy regulation and mitochondrial activity, we next grew wild type HSCs or HSCs isolated from autophagy-reporter Gfp-Lc3 mice22 in cytokine-rich (+cyt) conditions to force them out of quiescence and investigate their activated state before their first cell division (Fig. 2f). As expected, mTOR was rapidly activated in +cyt conditions, whereas it remained inactive in cytokine-starved (−cyt) conditions, while AMPK was transiently induced (Fig. 2g, h, and Extended Data Fig. 4a). This was accompanied by a rapid reduction of GFP-LC3 levels reflecting autophagy activation in –cyt conditions, and increased GFP-LC3 and p62 levels indicating autophagy inhibition in +cyt conditions (Fig. 2i, Extended Data Fig. 4b, c). Furthermore, pharmacological mTOR inhibition or AMPK activation directly induced autophagy in Gfp-Lc3 HSCs grown in +cyt conditions, while AMPK inhibition reduced autophagy induction grown in –cyt conditions (Extended Data Fig. 4d). In +cyt conditions, we also found a steady increase in mitochondrial mass and membrane potential, reflecting mitochondrial activation, and cell size, NADH levels and glucose uptake suggesting increased metabolic activity (Fig. 2j). Seahorse metabolic flux analyses measuring oxygen consumption rates (OCR) confirmed dramatically increased OXPHOS levels in activated HSCs (aHSC) grown for 21hr in +cyt conditions compared to freshly isolated, quiescent HSCs (qHSC) (Fig 3a). Collectively, these results demonstrate that quiescent HSCs switch from a normally low OXPHOS state to a high mitochondria-driven OXPHOS state during activation.
Figure 3. Loss of autophagy and aging cause metabolic activation in HSCs.
a, OXPHOS levels measured by oxygen consumption rates (OCR) in freshly isolated, quiescent HSCs (qHSC, same as yHSC in e) or activated HSCs (aHSC; 21hr +cyt culture); oligo: oligomycin; R&A: rotenone and antimycin; min: minute. b, glucose uptake in Cnt and cKO HSCs cultured as indicated. Results are expressed relative to 0hr Cnt HSC levels. c, ATP and NADH levels in the indicated HSC populations (± S.D.). d, OXPHOS levels in Cnt and cKO LSK cells. e, OXPHOS levels in yHSCs and oHSCs. Data are mean ± S.E.M. except when indicated. *p ≤ 0.05, **p ≤ 0.01, ***p ≤ 0.001.
Strikingly, Atg12cKO HSCs also exhibited these features of an activated HSC state, with increased cell size, NADH, ATP, and glucose uptake (Fig. 3b, c, Extended Fig. 4e). Furthermore, freshly isolated HSC-enriched Atg12cKO LSK cells (Lin−/c-Kit+/Sca-1+) displayed increased OXPHOS levels, specifically maximum capacity, with unchanged glycolysis levels measured by extracellular acidification rate (ECAR) (Fig. 3d, Extended Data Fig. 4f). Similar to Atg12cKO LSKs, oHSCs also exhibited increased cell size, NADH and ATP levels, and elevated OXPHOS with decreased glycolysis (Fig. 3c, e, Extended Data Fig. 4e, g), suggesting an overactive oxidative metabolism. However, in contrast to Atg12cKO HSCs, oHSCs had decreased TMRE levels and TMRE/MTG ratios (Extended Data Fig. 4h), which could indicate the presence of some damaged mitochondria23. Collectively, these results demonstrate that HSC activation is directly associated with metabolic activation and increased mitochondrial OXPHOS, and that in the absence of autophagy, HSCs are kept in an activated state reminiscent of the alert state recently described for muscle stem cells24. They also show that oHSCs, like autophagy-deficient HSCs, are metabolically more active than young HSCs (yHSC).
Autophagy controls HSC quiescence and myeloid differentiation
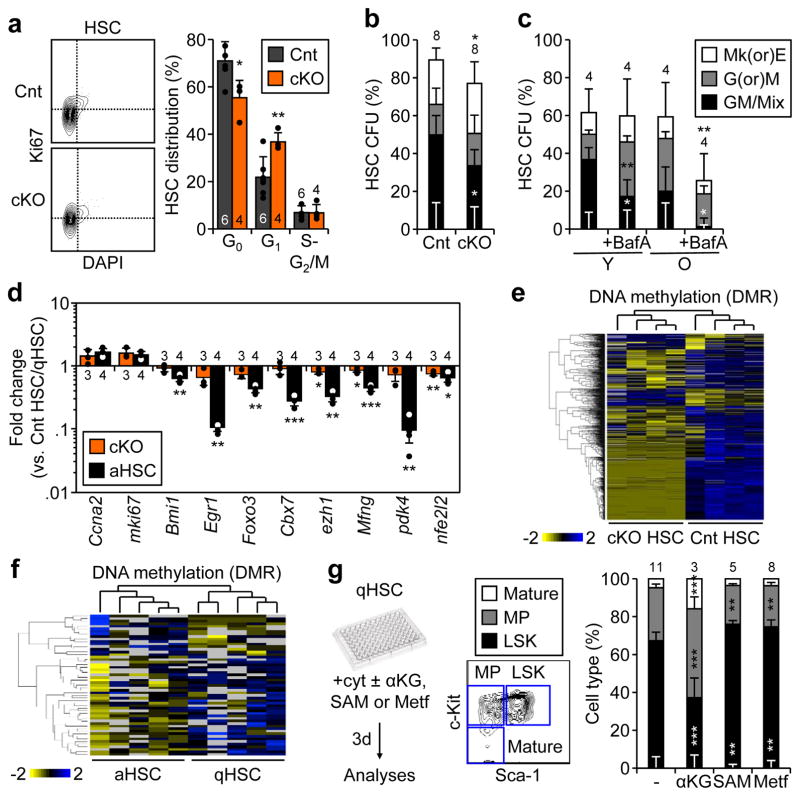
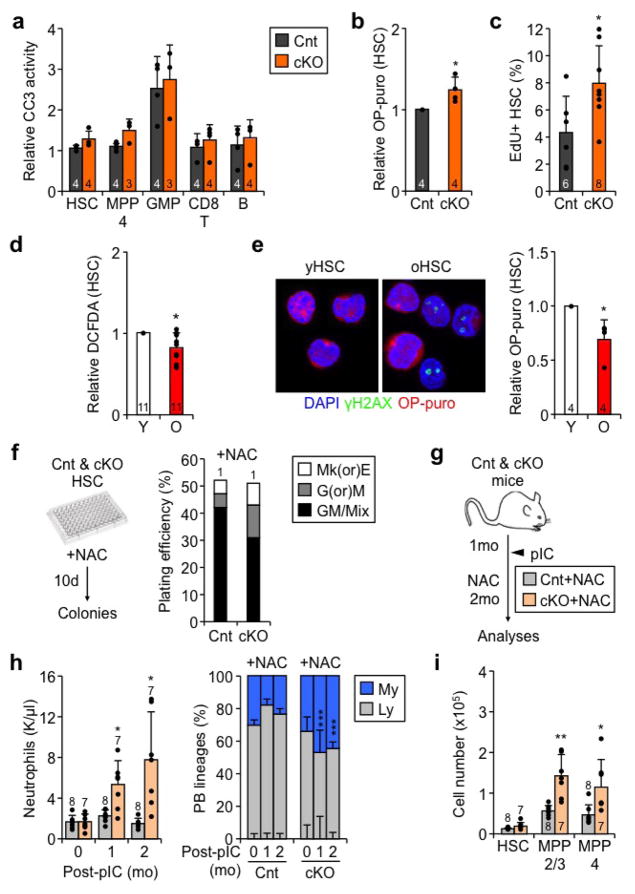
We then explored the consequences of increased oxidative metabolism for Atg12cKO HSC fate decisions. Similar to aHSCs, Atg12cKO HSCs showed increased levels of reactive oxygen species (ROS), which did not cause DNA damage or apoptosis (Extended Data Fig. 4i–k, 5a). As expected for more metabolically activated cells, Atg12cKO HSCs also had elevated protein synthesis rates and increased cell cycle activity (Extended Data Fig. 5b, c). In contrast, oHSCs showed reduced ROS levels and decreased protein synthesis rates, which contrasted with their OXPHOS-activated status, but is likely influenced by their replication stress features25 (Extended Data Fig. 5d, e). However, both Atg12cKO HSCs and oHSCs25 displayed a similar loss of quiescence and pro-myeloid differentiation associated with increased unipotent mature colonies and decreased multipotent immature colonies formed in methylcellulose (Fig. 4a, b). Strikingly yHSCs treated with the autophagy inhibitor Bafilomycin A (BafA) and untreated oHSCs showed a matching reduction in multipotent colonies, which was greatly exacerbated in BafA-treated oHSCs (Fig. 4c). Interestingly, treatment with the antioxidant N-acetylcysteine (NAC), which is known to ameliorate many ROS-mediated phenotypes26, did not rescue the precocious myeloid differentiation of Atg12cKO HSCs in methylcellulose, nor limit the myeloid expansion in Atg12cKO mice treated in vivo (Extended Data Fig. 5f–i). These data demonstrate that the non-cytotoxic increase in ROS levels observed in metabolically activated Atg12cKO HSCs has no major role in driving precocious myeloid differentiation in autophagy-deficient HSCs, in contrast to what has been shown in myeloid progenitors27. Altogether, these results indicate that the overactive metabolic state caused by loss of autophagy results in loss of quiescence and accelerated myeloid differentiation, which closely mirrors the deregulations observed in oHSCs.
Figure 4. Loss of autophagy affects HSC fate through epigenetic deregulation.
a, Representative FACS plots and quantification of cell cycle distribution in Cnt and cKO HSCs. b, c, Colony formation in methylcellulose from (b) Cnt and cKO HSCs, and (c) yHSCs and oHSCs ± BafA; CFU: colony-forming unit; Mk(or)E and G(or)M: mature megakaryocyte, erythroid, granulocyte or macrophage colonies; GM/Mix: immature GM or GMMkE colonies. Results are expressed as percent of plated cells. d, Selected genes from Fluidigm analyses of cKO HSCs and aHSCs. Results are expressed as fold change compared to levels in Cnt HSCs and qHSCs, respectively (3 technical pools of 100 cells are averaged per biological replicate). e, f, Heatmap of differentially methylated regions (DMRs) in (e) cKO vs. Cnt HSCs (n = 4) and (j) aHSCs vs. qHSCs (n = 5) ERBBS analyses. g, Impact of αKG, SAM and metformin (Metf) on HSC differentiation with scheme for in vitro treatment (left), gating strategy (middle) and quantification after 3 days culture. Data are means ± S.D. *p ≤ 0.05, **p ≤ 0.01, ***p ≤ 0.001.
Loss of autophagy perturbs HSC epigenetic poising
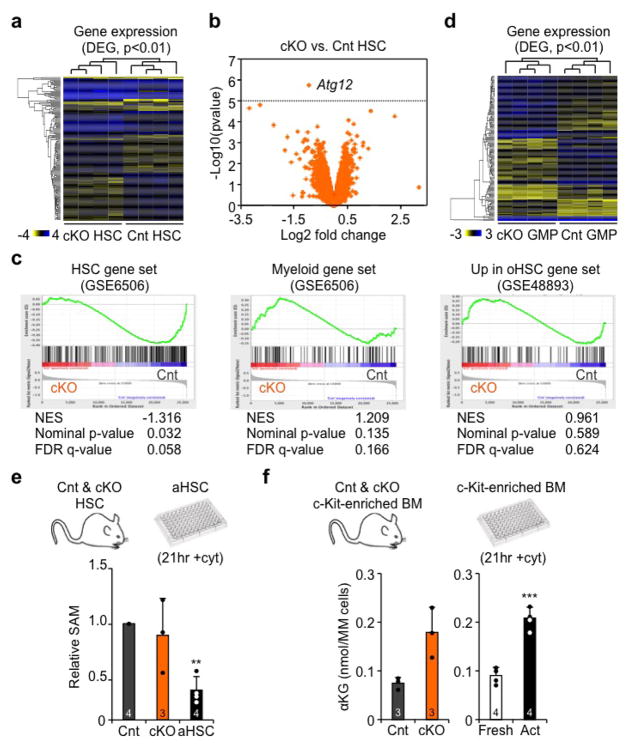
To gain a better understanding of the mechanisms affected by the loss of autophagy, we performed gene expression microarray analyses on HSCs and GMPs. While significant transcriptional differences were observed in Atg12cKO HSCs using a p-value < 0.01, surprisingly, apart from Atg12, no individual genes were significantly differentially expressed using a false discovery rate of 0.05 (Supplementary Table 1, Extended Data Fig. 6a, b). However, gene set enrichment analyses (GSEA) revealed reduced expression of HSC-identity genes28 and increased expression of both myeloid genes28 and genes elevated in oHSCs25 (Extended Data Fig. 6c). Complementary Fluidigm qRT-PCR analyses confirmed limited transcriptional changes in Atg12cKO HSCs, but also identified a small set of significantly downregulated genes that render them more similar to downstream MPPs (Fig. 4d, Supplementary Table 2 and 3). DAVID analyses also showed changes in mitochondrial and other metabolic terms in Atg12cKO GMPs, confirming more significant gene expression alterations in progenitor cells (Extended Data Fig. 6d, Supplementary Table 1). Since metabolism has become increasingly linked to epigenetic regulation26, we also performed enhanced reduced-representation bisulfite sequencing (ERRBS) analyses of DNA methylation. Strikingly, Atg12cKO HSCs showed a significantly altered DNA methylation profile, with 162 hypermethylated and 783 hypomethylated differentially methylated regions (DMR) (Fig. 4e). DAVID analyses identified phosphoproteins as the most enriched class of genes in hypomethylated DMRs (Supplementary Table 4). Taken together, these results are consistent with the idea that changes in fate decisions observed at steady state in autophagy-deficient HSCs are the consequence of an epigenetic reprograming that begins to alter gene expression in HSCs, with amplification of transcriptional changes in downstream progenitors.
Metabolic activation directly leads to epigenetic remodeling and changes HSC fate
To gain a better understanding of the link between metabolic activation, epigenetic reprograming and control of HSC fate decisions, we conducted a more extensive analysis of 21hr +cyt aHSCs vs. freshly isolated qHSCs, and performed both ERBBS analyses and Fluidigm qRT-PCR analyses. Strikingly, we also observed an altered DNA methylation profile, which was more restricted than in Atg12cKO HSCs, but also mainly consisted of hypomethylation events with 38 hypomethylated and 17 hyermethylated DMRs (Fig. 4f). Gene ontology (GO) analyses indicated enrichment for Stat3 regulation (Supplementary Table 5). Moreover, we found a clear overlap between the changes in gene expression in aHSCs and Atg12cKO HSCs suggesting activation of similar mechanisms of fate decision (Fig. 4d, Supplementary Table 2). To directly test the importance of metabolic-driven epigenetic remodeling in aHSCs, we added α-ketoglutarate (αKG), a necessary co-factor for many demethylases29, s-adenosylmethionine (SAM), a methyl donor cosubstrate for methylases30, and metformin (Mtf), an inhibitor of mitochondrial complex I31, to differentiating HSCs grown in +cyt conditions for 3 days, and analyzed lineage commitment. Strikingly, addition of αKG enhanced myeloid differentiation, while addition of SAM or Mtf preserved stemness in +cyt HSCs (Fig. 4g). These results indicate that even in the context of strong differentiation stimuli, the epigenetic remodeling associated with metabolic activation directly affects HSC fate decisions. Finally, we measured SAM and αKG cellular levels (Extended Data Fig. 6e, f). While only trending in Atg12cKO HSCs, we observed a strong reduction in SAM levels in aHSCs, and found a large increase in αKG levels in both Atg12cKO and 21hr +cyt c-Kit-enriched BM cells. These results suggest that epigenetic remodeling and DNA demethylation are early consequences of increased oxidative metabolism, and play a direct role in HSC loss of stemness and accelerated myeloid differentiation. Collectively, they demonstrate an essential role for autophagy in clearing metabolically activated mitochondria and allowing HSCs to maintain a mostly glycolytic, quiescent state.
Autophagy levels define distinct subsets of old HSCs
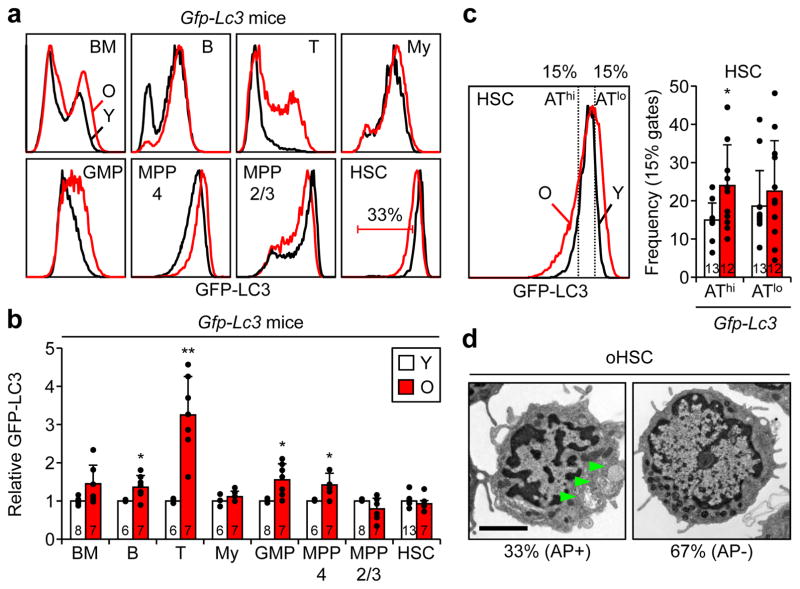
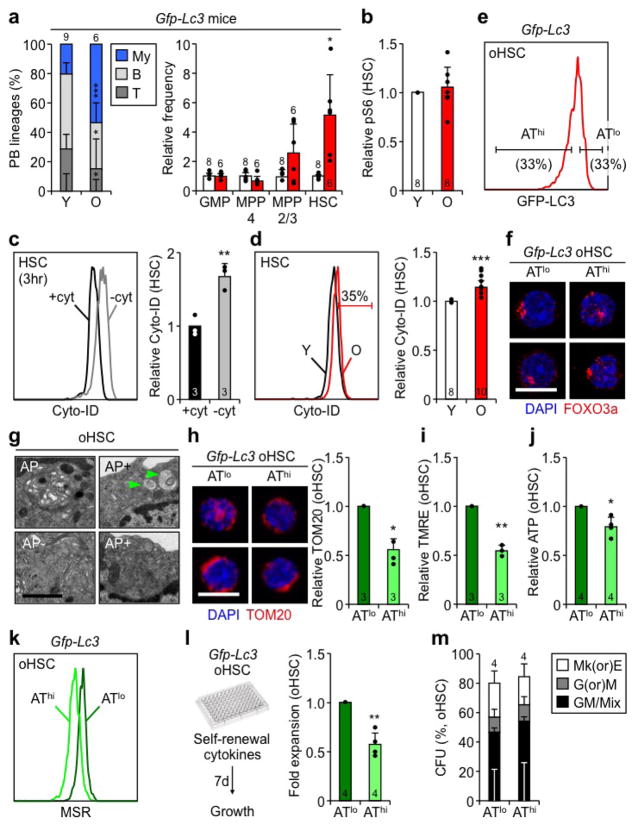
While oHSCs share many deregulated features with Atg12cKO HSCs, we previously reported increased basal autophagy in oHSCs13. To address this discrepancy and to determine its significance, we profiled GFP-LC3 expression in various hematopoietic populations of young and old Gfp-Lc3 mice as a surrogate of autophagy levels. In unfractionated BM cells, mature B and T cells, and most of the progenitor populations including GMPs and MPP4, GFP-LC3 levels were increased with age indicating an overall decrease in autophagy activity, as already reported for T cells32 (Fig. 5a, b). Interestingly, this corresponded to populations that were either unchanged or decreased in number in old mice (Extended Data Fig. 7a). In contrast, expanded myeloid cells did not have altered GFP-LC3 levels, and the enlarged MPP2/3 and HSC compartments both contained subsets with decreased GFP-LC3 expression. While the average GFP-LC3 expression and overall mTOR activity did not significantly change between young and old HSCs (Extended Data Fig. 7b), careful examination of oHSCs revealed an increase in cells with both lower and higher GFP-LC3 levels reflecting the appearance of subsets with either high autophagy (AThi) or low autophagy (ATlo), respectively (Fig. 5c). Re-analysis of EM pictures13 (Fig. 5d) and measurement of autophagy with Cyto-ID dye (Extended Data Fig. 7c, d) also indicated that ~ 1/3 of oHSCs had autophagosomes and activated autophagy. Thus, while most of the blood cells including the majority of the HSC compartment show no activation or a decline in autophagy with age, a fraction of oHSCs have increased autophagy levels.
Figure 5. Different autophagy activity in aged hematopoietic populations.
a, b, Autophagy levels measured in young and old Gfp-Lc3 mice: (a) representative FACS plots, and (b) quantification of GFP-LC3 expression. Results are expressed relative to the respective young populations. c, Representative FACS plots and frequency of young and old HSCs within the 15% GFP-LC3 low/autophagy high (AThi) and 15% GFP-LC3 high/autophagy low (ATlo) yHSC gates. d, Representative EM micrographs and percent of oHSCs ± autophagosomes (AP, arrowheads) (58 cells total); scale bar, 2 μm. Data are means ± S.D. *p ≤ 0.05, **p ≤ 0.01, ***p ≤ 0.001.
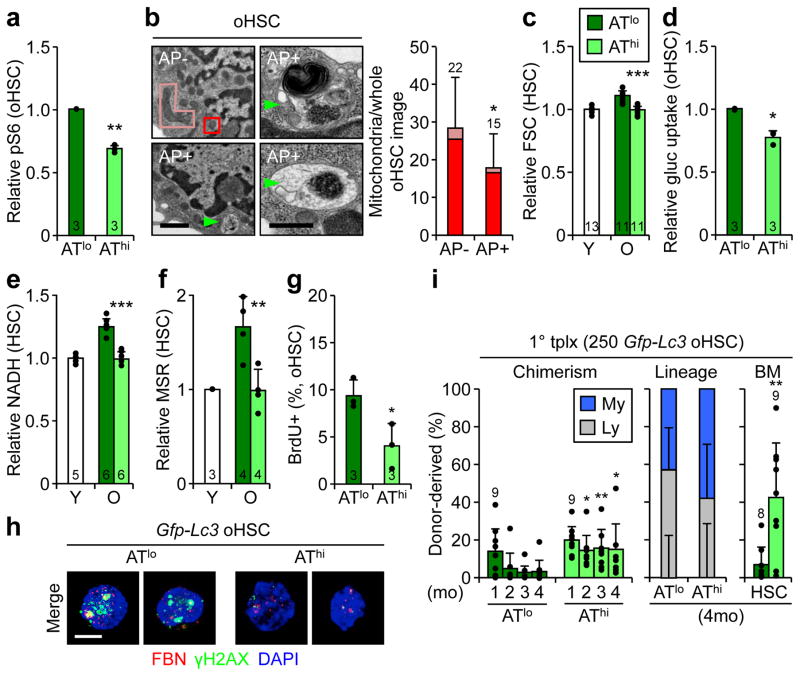
To study the differences between AThi and ATlo oHSCs, we isolated cells with the 33% lowest and 33% highest GFP-LC3 levels, respectively (Extended Data Fig. 7e). This sub-fractionation revealed no changes in nuclear FoxO3a, but uncovered decreased mTOR activity specifically in AThi oHSCs (Fig. 6a, Extended Data Fig. 7f), thus identifying the cause for autophagy induction in this subset. By EM analyses, oHSCs with autophagosomes displayed normal youthful organelle biology, while oHSCs without autophagosomes showed almost identical features to Atg12cKO HSCs, with expanded ER, Golgi and small vesicle compartments, and increased numbers of total and elongated mitochondria, that was confirmed by TOM20 IF staining in ATlo oHSCs (Fig. 6b, Extended Fig. 7g, h). ATlo oHSCs also had increased cell size and elevated TMRE, NADH, ATP, glucose uptake, and ROS levels (Fig. 6c–f, Extended Data Fig. 7i–k), remarkably similar to the overactive metabolic features of Atg12cKO HSCs. This resulted in increased cell cycling, over-proliferation in self-renewal conditions, and pro-myeloid differentiation specifically in ATlo oHSCs (Fig. 6g, Extended Data Fig. 7l, m). Strikingly, nucleolar γH2AX foci that are hallmarks of replication stress in oHSCs25 were almost exclusively found in ATlo oHSCs (Fig. 6h). In contrast, AThi oHSCs closely resembled healthy yHSCs for all of these characteristics. Taken together, these results indicate that by preventing entry into an activated state, autophagy preserves a subset of oHSCs from replication stress and associated cellular aging. This is actually very different from the functions of autophagy in muscle stem cell activation33 and prevention of senescence15.
Figure 6. Autophagy-activated old HSCs are healthier stem cells.
a, pS6 levels in ATlo and AThi oHSCs. b, Representative EM micrographs and quantification of total, normal (dark box) and elongated (light box) mitochondria in oHSCs ± autophagosomes (AP, arrowheads); scale bars, 1 μm. Statistical significance is for all three parameters, n indicate cell numbers. c–f, Metabolic parameters in ATlo and AThi oHSCs: (c) cell size, (d) glucose uptake, (e) NADH and (f) ROS levels. g, Cycling activity in ATlo and AThi oHSCs. h, Representative examples of 3 independent experiments showing IF images of fibrillarin (FBN)/γH2AX replication stress foci in ATlo and AThi oHSCs; scale bar, 5 μm. i, Transplantation of ATlo and AThi oHSC subsets with donor chimerism (left) and lineage distribution (center) in PB, and HSC chimerism (right) at the indicated times in primary recipients. Data are mean ± S.D., and are expressed relative to ATlo oHSCs (a, d, g) or yHSCs (c, e, f). *p ≤ 0.05, **p ≤ 0.01, ***p ≤ 0.001.
Autophagy activation maintains healthier old HSCs
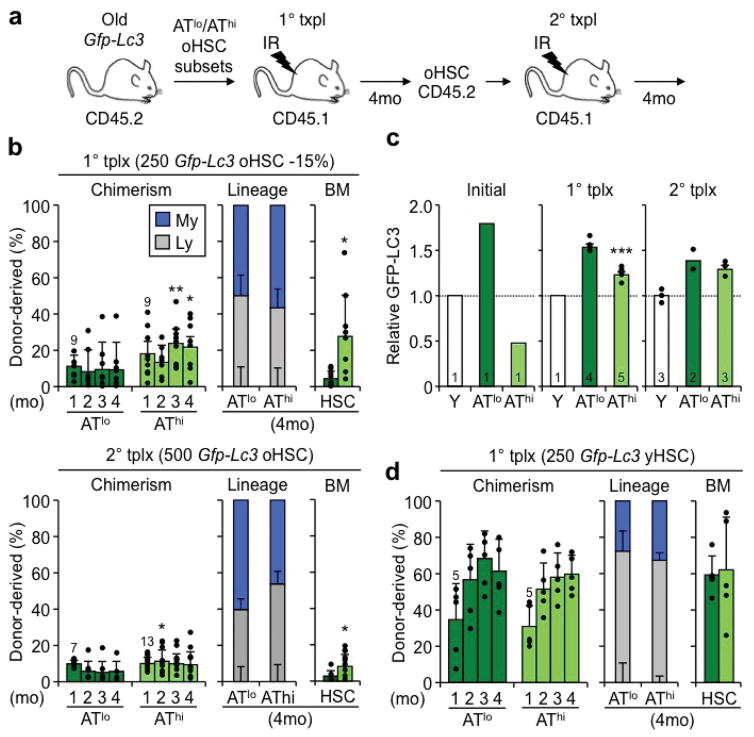
We next probed the functionality of these subsets and transplanted 250 ATlo or AThi oHSCs into lethally irradiated recipients (Extended Data Fig. 8a). While both subsets initially engrafted at similar levels, ATlo oHSCs rapidly declined and were unable to maintain efficient long-term reconstitution and HSC numbers (Fig. 6i). In contrast, AThi oHSCs exhibited a surprisingly robust long-term reconstitution and HSC regeneration. These functional differences persisted with a more restrictive 15% GFP-LC3 AThi/lo oHSC cutoff and upon secondary transplantation, although they became attenuated, perhaps due to normalization of autophagy levels in re-isolated oHSC subsets, potentially as a consequence of repeated exposure to a young BM microenvironment (Extended Data Fig. 8b, c). They were also specific to oHSCs, as ATlo and AThi yHSCs isolated with the same 33% GFP-LC3 cutoffs had no differences in regenerative abilities (Extended Data Fig. 8d). Collectively, these results demonstrate that ATlo and AThi oHSCs are functionally distinct subsets, with autophagy-activated oHSCs being the fittest aged stem cells responsible for the majority of the repopulation potential, and autophagy-inactivated oHSCs driving most of the blood aging phenotypes.
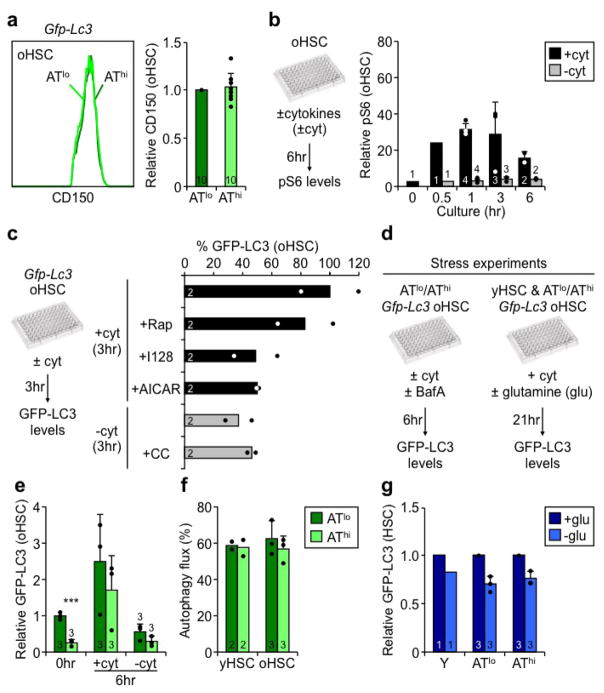
We also investigated the reversibility between ATlo and AThi oHSC subsets. Strikingly, there were no discernible differences in CD150 expression between these two subsets, and oHSCs were almost identical to yHSCs for both mTOR activation in +cyt conditions and pharmacological modulation of autophagy levels (Extended Data Fig. 9a–c). In fact, ATlo and AThi oHSCs, despite initial differences in GFP-LC3 levels, were able to repress and activate autophagy to similar extents in ±cyt conditions, and upon glutamine starvation (Extended Data Fig. 9d–g). Furthermore, both ATlo and AThi oHSCs had equivalent autophagy flux, which was comparable to yHSCs (Extended Data Fig. 9f). These results demonstrate that while subsets of oHSCs with different mTOR and autophagy levels exist in vivo, they both maintain the ability to upregulate and downregulate autophagy upon strong stimulation.
Discussion
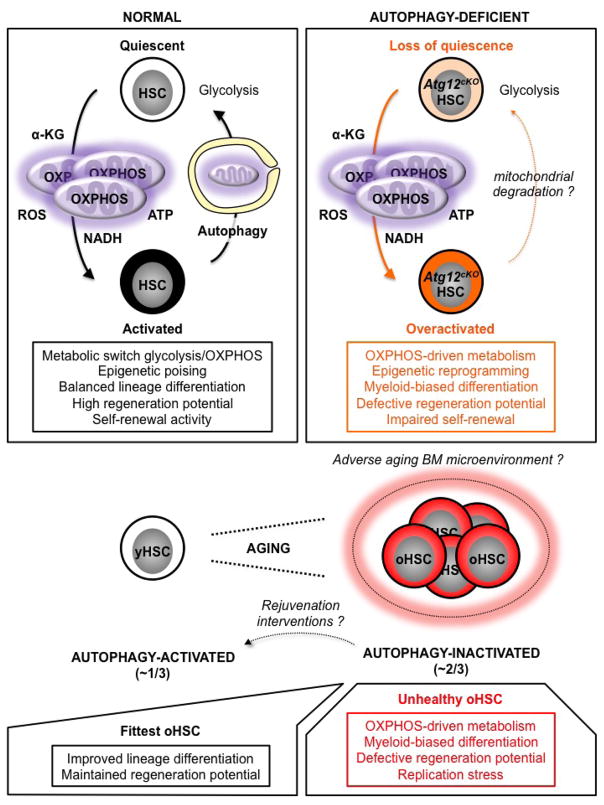
Our results demonstrate an essential function for autophagy in removing activated mitochondria and controlling oxidative metabolism, thereby maintaining HSC stemness and regenerative potential (Extended Data Fig. 10). They link metabolic reprogramming with epigenetic modifications in the control of HSC fate, and establish autophagy as one of the essential gatekeepers of HSC quiescence. This role becomes even more important during aging as the inability of the majority of oHSCs to activate autophagy in vivo results in an overactive OXPHOS metabolism that drives most of the aging blood phenotypes, including impaired engraftment and replication stress. While all oHSCs remain competent for autophagy induction, only ~ 1/3 of them activate autophagy in the aging BM microenvironment7,8, and maintain a low metabolic state with robust regeneration potential akin to yHSCs. Our findings have exciting implications for rejuvenation therapies as they identify a cellular characteristic that can be directly targeted to improve oHSC function and preserve the health of an aging blood system. In this context, understanding why some old stem cells activate autophagy and others do not, as well as identifying the environmental drivers for this differential adaptive response will help further our understanding of cellular aging, and develop more targeted approaches for improving organismal health during aging.
Online Methods
Mice
Young (6–12 weeks) and old (24–28 months) wild type C57Bl/6 mice of both genders were either bred and aged in house, or obtained from the National Institute on Aging (NIA) aged rodent colonies. Mx1-Cre34, Atg12flox/flox:Mx1-Cre [13], Atg5flox/flox [35], Park2−/− [19] and Gfp-Lc3 [22] and were all on a pure C57Bl/6 background and have been described previously. Atg5flox/flox:Mx1-Cre mice were generated by crossing Atg5flox/flox with Mx1-Cre mice. Old (24–31 months) Gfp-Lc3 mice were aged in house. For Mx1-Cre-mediated deletion, 4-week-old mice were injected intraperitoneally (i.p.) three times 2 days apart with 125 μg poly(I/C) (pIC, GE Healthcare) in 100 μl PBS. pIC-injected Atg12flox/flox or Atg5flox/flox mice were used as controls (Cnt). pIC-injected Atg12flox/flox:Mx1-Cre and Atg5flox/flox:Mx1-Cre conditional knock-out (cKO) mice were used 2–3 months post-pIC injection, unless otherwise indicated. For deletion in transplanted mice, recipients were injected 2 months after transplantation with pIC as described above. For mouse studies, no specific randomization or blinding protocol was used, animals of both genders were utilized, and all experiments were performed in accordance with UCSF IACUC approved protocols.
In vivo assays
For 5-fluorouracil (5-FU; Sigma-Aldrich) treatment, mice were injected i.p. with 150 mg/kg 5-FU or vehicle (PBS) for four times once a month and analysed for blood parameters by regular bleeding every 3–5 days. For in vivo starvation experiments, mice were deprived of food for 24hr with free access to water. For transplantations experiments, 8–12 week old CD45.1 C57Bl/6-Boy/J recipient mice were lethally irradiated (11Gy, delivered in split doses 3hr apart) using a Cs137 source (J.L. Shepherd), and injected retro-orbitally with either 250–1000 purified CD45.2 HSCs delivered together with 250,000 Sca-1-depleted helper CD45.1 BM cells, or just with 2×10⁶ unfractionated CD45.2 BM cells. Transplanted mice were kept on antibiotic-containing water for 4 weeks, and analyzed for donor-derived chimerism by monthly bleeding. Peripheral blood (PB) was obtained via retro-orbital bleeding, and collected in 4 ml of ACK (150 mM NH4Cl/10 mM KHCO3) containing 10 mM EDTA for flow cytometry analyses, or in EDTA-coated tubes (Becton Dickenson) for complete blood counts (CBC). CBC analyses were performed using a Hemavet hematology system (Drew Scientific). For EdU incorporation, mice were injected with 100 μl of 1 mg/ml 5-ethynyl-2 deoxyuridine (EdU, Thermo Fisher Scientific, A00144) 3hr before sacrifice. For N-acetylcysteine (NAC) treatments, mice were given water containing 1 mg/ml NAC (Sigma-Aldrich, A7250-100G) for 8 weeks starting on the day of the final pIC treatment.
Flow cytometry
Hematopoietic stem and progenitor cells were analysed and/or isolated as described36. BM cells were obtained by crushing leg, arm and pelvic bones (with eventually sternum and spines for some experiments) in Hanks’ Buffered Saline Solution (HBSS) containing 2% heat-inactivated FBS (staining media, SM), and single cell suspensions of splenocytes by mechanical dissociation between two slides of whole spleens. Erythrocytes were removed by ACK lysis, and single cell suspensions of BM cells were purified on a Ficoll gradient (Histopaque 1119, Sigma-Aldrich). BM cells were then enriched for c-Kit+ cells using c-Kit microbeads (Miltenyi Biotec, 130-091-224) and an AutoMACS cell separator (Miltenyi Biotec) or MACS Separation LS Columns (Miltenyi Biotec, 130-042-401). For cell analyses, unfractionated BM cells were incubated with purified rat anti-mouse lineage antibodies (CD3 from BioLegend, and CD4, CD5, CD8, B220, Ter119, Mac-1 and Gr-1 from eBioscience) followed by goat anti-rat-PE-Cy5 (Invitrogen, A10691) and subsequently blocked with purified rat IgG (Sigma-Aldrich). Cells were then stained with c-Kit-APC-eFluor780 (eBioscience, 47-1171-82), Sca-1-PB (BioLegend, 108120), CD48-A647 (BioLegend, 103416), CD150-PE (BioLegend, 115904) and Flk2-bio (eBioscience, 13-1351-82) followed by either SA-PeCy7 (eBioscience, 25-4317-82) or SA-Qdot605 (Invitrogen, Q10101MP) for HSC staining, or together with CD34-FITC (eBioscience, 11-0341-85) and FcγR-PerCP-eFluor710 (eBioscience, 46-0161-82) for combined HSC/myeloid progenitor staining. For Gfp-Lc3 mice analyses and dye staining requiring FITC and/or PE channels, HSCs were stained instead with Lin/PE-Cy5, Sca-1-PE-Cy7 (BioLegend, 108114), CD48-PB (BioLegend, 1103418), CD150-APC (BioLegend, 1115910), and Flk2-Bio followed by SA-PeCy7. For myeloid progenitor analyses in Gfp-Lc3 mice, cells were separately stained with Lin/PE-Cy5, c-Kit-APC-eFluor780, Sca-1-PB, FcγR-PerCP-eFluor710 and CD34-Bio (Biolegend, 119304) followed by SA-Qdot605. For HSC chimerism analyses, HSCs were stained with Lin/PE-Cy5, c-Kit-APC-eFluor780, Sca-1-PB, CD48-A647, CD150-PE, and Flk2-bio followed by SA-Qdot605, together with CD45.2-FITC (eBioscience, 11-0454-85) and CD45.1-PE-Cy7 (eBioscience, 25-0453-82). For mature cell analyses, unfractionated BM cells were stained with Mac-1-PE-Cy7 (eBioscience, 25-0112-82), Gr-1-PB (eBioscience, 57-5931-82), B220-APC-Cy7 (eBioscience, 47-0452-82), CD19-PE (eBioscience, 12-0193-82), CD4-FITC (BD Biosciences, 553729) and CD8-PE (Biolegend, 100908). For PB chimerism analyses, cells were stained with Mac-1-PE-Cy7, Gr-1-PB, B220-APC-Cy7, CD3-APC (eBioscience, 17-0032-82) and Ter-119-PE-Cy5 (eBioscience, 15-5921-83) together with either CD45.2-FITC or CD45.2-Bio follows by SA-Qdot605 and CD45.1-PE (eBioscience, 12-0453). Stained cells were re-suspended in SM with 1 μg/ml propidium iodide (PI) to exclude dead cells. Sorted or gated HSCs were analysed for cell size and NADH autofluorescence using forward scatter (FSC) and UV450/50 channels, respectively. For ROS, mitochondrial mass and ER analyses, sorted HSCs were washed with HBSS, incubated for 15 min at 37°C with dichlorofluorescin diacetate (DCFDA, 10 μM, Invitrogen, C400), Mitosox Red (MTR, 5uM, Thermo Fisher Scientific, M36008), Mitotracker Green (MTG, 100 nM, Thermo Fisher Scientific, M7514), or ER-Tracker Green (100 nM, Thermo Fisher Scientific, E34251) in HBSS. For mitochondrial membrane potential or autophagy analyses, sorted HSCs were incubated for 15 min at 37°C with tetramethylrhodamine-ethyl-ester (TMRE, 200 nM, Enzo, enz-52309) or Cyto-ID (1:1000, Enzo, ENZ-51031-0050) in SM. HSCs were then washed with SM, re-suspended in SM containing 1 μg/ml PI, and analyzed for dye fluorescence in the FITC or PE channels. For intracellular staining, sorted HSCs were washed in PBS, fixed in Cytofix/Cytoperm buffer (BD Biosciences), washed in PermWash (BD Biosciences), permeabilized with CytoPerm Plus (BD Biosciences) for 10 min at room temperature (RT), re-fixed in Cytofix/Cytoperm buffer for 10 min at 4°C, washed in PermWash and incubated in PermWash overnight at 4°C with the following primary antibodies: rabbit anti-phospho-S6 (Cell Signaling, 2211) or anti-phospho-S6 A488 (Cell Signaling, 4854), and guinea pig anti-p62 (Progen, GP62-C). Cells were then washed in PermWash and incubated in PermWash for 2hr at 4°C with the appropriate secondary antibody: anti-rabbit A488 (Invitrogen, A21206) or A594 (Invitrogen, A11037) and anti-guinea pig A488 (Invitrogen, A11073) or A647 (Abcam, ab150187). Cells were washed once more in PermWash and re-suspended in PermWash for analyses. For intracellular bromodeoxyuridine (BrdU) staining, Cytofix/Cytoperm treated HSCs were incubated for 30 min with 0.5 U/μl DNAseI in 3% BSA/0.2x PBS/5mM MgCl2/2mM CaCl2 at RT, washed in PermWash, incubated with mouse anti-BrdU primary antibody for 30 min at RT, washed in PermWash, incubated with APC-conjugated goat anti-mouse (Thermo Fisher Scientific, A21241) secondary antibody for 30 min at RT, washed once more in PermWash and re-suspended for analyses. For intracellular Ki67 and 4′,6-diamidino-2-phenylindole (DAPI, Sigma-Aldrich, 32670-5MG-F) staining, unfractionated BM cells were first stained with Lin/PE-Cy5, c-Kit-APC-eFluor780, Sca-1-PE-Cy7, CD150-PE and CD48-A647 as described above, and then stained with anti-Ki67 (eBioscience, 11-5698-80) in PermWash for 2hr at 4°C. Cells were then washed with PermWash, re-suspended in PBS/3% FBS containing 1 μg/ml DAPI, and incubated for 20 min prior to analysis. Cell isolation was performed on a FACSAria III (Becton Dickenson) using double sorting, and cell analyses were performed using a FACSAria or FACS LSR II using DIVA software (Becton Dickenson).
Cell culture
All cultures were performed at 37°C in a 5% CO2 water jacket incubator (Thermo Fisher Scientific). Cells were grown in StemPro34 medium (Invitrogen) supplemented with penicillin (50 U/ml)/streptomycin (50 μg/ml) and L-glutamine (2 mM), and with or without the following cytokines (±cyt): SCF (25 ng/ml), Flt3L (25 ng/ml), IL-11 (25 ng/ml), IL-3 (10 ng/ml), GM-CSF (10 ng/ml), Epo (4 U/ml) and Tpo (25 ng/ml) (Peprotech). For self-renewal cultures, only SCF, IL11, and Flt3L were used. Bafilomycin A (BafA, 5 nM, Sigma, B1793-2UG), rapamycin (Rapa, 200 nM, EMD Millipore, CAS 53123-88-9), Ink128 (200 nM, gift from Dr. D. Ruggero), AICAR (5mM, Sigma, A9978), Compound C (CC, 40 μM, EMD Millipore, 171260) or corresponding vehicles (i.e., DMSO or water) were added to the ±cyt media when indicated. For glutamine starvation experiments, L-glutamine was omitted from the +cyt medium. For apoptosis and ATP assays, HSCs (400 cells per well) were sorted directly into 40 μl of SM media in 384-well solid white luminescence plates and 40 μl of either Caspase-Glo 3/7 (Promega, G8091) or CellTiter-Glo (Promega, G7570) was then directly added to each well. Both assays were performed according to manufacturer’s instructions and read on a luminometer (Synergy2, BioTek). For colony forming unit (CFU) assays, unfractionated BM cells (10,000 cells per 1 ml in 3 cm dish) or sorted HSCs (100 cells per 1 ml in 3 cm dish, or 1 cell in 100 μl per well of a 96-well plate) were cultured in methylcellulose (Stem Cell Technologies, M3231) supplemented with L-Glutamine, Penicillin/Streptomycin and the cytokines described above, together with BafA when indicated. Three 3 cm dishes or 60–72 individual cells in 96-well plate were scored per condition after 8 to 12 days of culture. For measurement of glucose uptake, HSCs (400–2000 cells) were grown in +cyt media containing 100 μM 2-(n-(7-nitrobenz-2-oxa-1,3-diazol-4-yl)amino)-2-deoxyglucose (2-NBD glucose, Invitrogen, N13195). Cells were then washed once in SM, re-suspended in SM containing 1 μg/ml PI, and analyzed for 2-NBD glucose fluorescence in the FITC channel. For measurement of glucose uptake in GFP-LC3 HSCs, 6000 HSCs were cultured with 100 μM 2-deoxyglucose (2-DG) for 4hr and then processed according to manufacturer’s instructions (Glucose Uptake-Glo Assay, Promega, J1341). For BrdU incorporation assays, HSCs (1000–2000 cells) were directly sorted into 96-well plates, cultured for 3hr with 60 μM BrdU (Sigma, B5002) and analysed by flow cytometry as described above. For measurement of nascent protein synthesis, HSCs were cultured with 20 μM O-propargyl-puromycin (OP-puro, Thermo Fisher Scientific, C10457) for 30 min in +cyt media, processed according to the manufacturer’s instructions, and analysed by immunofluorescence staining as described below. For replication stress assays, cells were cultured with the same cocktail of cytokines and aphidicolin (50 ng/ml, Sigma, A4487) in Iscove’s modified Dulbecco’s media (IMDM) supplemented with 5% FBS (StemCell Technology, 06200), 1x penicillin/streptomycin, 0.1 mM non-essential amino acids, 1 mM sodium pyruvate, 2 mM L-glutamine and 50 μM 2-mercaptoethanol.
Immunofluorescence staining
HSCs (400–1500 cells) were sorted directly onto poly-lysine coated slides (VWR International, P-4981) and fixed in PBS/4% PFA for 10 min at RT. Slides were permeabilized in PBS/0.15% Triton-X100 for 2 min at RT and blocked in PBS/1% BSA for 1hr at RT. Slides were then incubated in PBS/1% BSA with either rabbit anti-FoxO3a (Millipore, 07-1719), mouse anti-phospho-H2AX (Ser139) (Millipore, 05-636), rabbit anti-53BP1 (Novus Biologicals, NB100-904), rabbit anti-FBL (Cell Signaling, 2639), mouse anti-RAD51 (Abcam, ab1837), mouse anti-LAMP1 (Developmental Studies Hybridoma Bank, 1D4B), mouse anti-KDEL (Abcam, ab12223) or rabbit anti-TOM20 (Santa Cruz Biotechnology, sc-11415) for 1hr at 37°C. Slides were then washed three times in PBS and incubated for 1hr at 37°C in PBS/1% BSA with appropriate secondary antibodies (all from Life Technologies): A488-conjugated goat anti-mouse (A-11029), A594-conjugated goat anti-rabbit (A-11037), A594- or A488-conjugated goat anti-rat (A-11007, A-10528), and A488-conjugated donkey anti-mouse (A-21202). Slides were finally washed three times in PBS and mounted using VectaShield (Vector Laboratories) containing 1 μg/ml DAPI. EdU incorporation was detected using A594-labeled azide click chemistry according to the manufacturer’s instruction (Life Technologies, Click-iT® EdU imaging assay, C10339). For OP-puro analysis, after processing, slides were stained with anti-phospho-H2AX and then A488-conjugated goat anti-mouse. Cells were imaged on a SP5 Leica Upright Confocal Microscope (20× or 63× objective), and images were processed using Volocity software (v.4.4, Improvision, Waltham, MA, USA) and ImageJ. Between 5 to 8 z-stacks were taken per image, and total fluorescence per cell was measured using Volocity on ≥ 20 cells per condition.
In vitro assays
For Western blot analyses, sorted HSCs (~30,000-cells per condition) were lysed in RIPA buffer, run on standard 12% SDS-page gels, transferred onto nitrocellulose membranes (Bio-Rad, 162-0232) and blocked with 5% bovine serum albumin (BSA) in blocking buffer (Li-COR Biosciences, 927–40000) containing 0.1% Tween (BBT) for 1hr at RT according to standard protocols. Membranes were incubated for overnight at 4°C in BBT with primary antibodies in BBT, washed once with BBT, incubated for 1hr at 4°C in BBT with appropriate secondary antibodies, and detected on an Odyssey Infrared Imaging System (Li-COR Biosciences). Membranes were eventually stripped with NewBlot Stripping Buffer Nitro (Li-COR Biosciences, 928–40030) according to manufacturer’s instructions before being re-incubated with another primary antibody. Rabbit anti-phospho-AMPKα (Cell Signalling, 2535), rabbit anti-phospho-S6 (Cell Signalling, 2215), mouse anti-S6 (Cell Signalling, 2317), and rabbit anti-actin (Sigma-Aldrich, A2066) were used as primary antibodies and IRDye 800CW Goat Anti-Rabbit IgG (Li-COR Biosciences, 926-32211) or IRDye 800CW Goat Anti-Mouse IgG (Li-COR Biosciences, 926-32210) as secondary antibodies. For Seahorse metabolic flux experiments, oxygen consumption rates (OCR) and extracellular acidification rates (ECAR) were measured using a 96-well Seahorse Bioanalyzer XF 96 according to manufacturer’s instructions (Agilent Technologies). In brief, HSCs or LSK cells (75,000 cells per well) were sorted directly into 96-well plates pre-coated for 3hr with poly-lysine (Sigma-Aldrich, P4707) and containing cyt+ media. Plates were then centrifuged for 5 min at 1200 rpm and media was replaced with 175 μl of temperature/CO2 pre-adjusted +cyt media. Plates were either immediately analyzed or cultured for 22hr prior analysis done according to manufacturer’s instructions with the following exceptions. For glycolysis assays, the starting +cyt media already contained glucose and 2 μM Oligoymycin followed by 1 M 2-DG were used. For OXPHOS assays, 1 μM Oligomycin followed by 2 μM FCCP were used. For both assays, mix and read times were also extended to 7 min and 4 min, respectively. For electron microscopy (EM) analyses, cells (40,000–75,000 per condition) were pelleted for 5 min at 4°C at 600 g, fixed on ice for 30 min in 0.1M NaCacodylate, pH 7.4, containing 2% Glutaraldehyde and 1% PFA, and pelleted at 3000 g for 10 min at 4°C. Samples were then submitted to the Gladstone Institute (UCSF) Electron Microscopy Core Facility for standard transmission electron microscopy ultrastructural analyses. Mitochondria numbers and morphology were visually scored. For aKG measurements, 106 c-kit-enriched BM cells were processed according to manufacturer’s instructions (Biovision, K677-100). For SAM measurements, 15,000 HSCs were processed according to manufacturer’s instructions (Mediomics, 1-1-1004).
Gene expression analyses
For microarray analyses, RNA was purified from sorted HSCs and GMPs (7,000–20,000 cells obtained from individual mice) using the Arcturus PicoPure RNA Isolation Kit, amplified using Ovation Pico WTA System V2 (NuGEN, 3302-12), fragmented and biotinylated using the Encore Biotin Module (NuGEN, 4200-12), and hybridized on Affymetrix Gene ST 1.0 microarrays according to manufacturers’ instructions. Transcriptome profiling was performed at the Gladstone Institute Genomics Core (UCSF). Gene expression was first measured at the probe set level (n = 241,619) using the RMA (Robust Multi-array Average) methodology followed by quantile normalization37. Quality of the data was assessed using principal component analysis (PCA) as well as unsupervised hierarchical clustering. Probe set annotation for the MoGene1.0st v1 array was downloaded from Affymetrix’s website and the 241,619 probe sets were mapped to the 28,853 main transcript set (excluding controls). This data set was used for all analyses. We used a family of generalized, linear models implemented with the R package, LIMMA, to assess differential expression between groups of interest38. Nominal p-values were corrected for multiple comparisons using a false discovery rate (FDR) cutoff of 0.05. Gene Set Enrichment Analyses (GSEA) were performed according to standard procedures on curated gene sets from previous publications. Normalized expression values for each replicate were used to generate an expression data set file, and GSEA was run using the weighted enrichment score. DAVID was used to functionally annotate the differentially expressed or methylated genes to GO terms. For Fluidigm analyses, the Fluidigm 96.96 Dynamic Array IFC were performed as previously described36. Briefly, HSCs or MPPs (100 cells/well) were directly sorted into 96 well-plates containing CellsDirect lysis buffer (Invitrogen, 11753-100), reverse-transcribed and pre-amplified for 18 cycles using Superscript III Platinum Taq DNA polymerase (Invitrogen, 18080-044) using a custom-made set of 96 proprietary target-specific primers (Fluidigm). The resulting cDNAs were analyzed on a Biomark system (Fluidigm) using EvaGreen Sybr dye (Bio-Rad, 172-5211). Data were collected with Biomark Data Collection Software (Fluidigm) and analyzed using Biomark qPCR analysis software with a quality threshold of 0.65 and linear baseline correction. Melt curves and Tm values for each assay reaction were checked individually, and reactions with melt curves showing multiple peaks or poor quality were discarded, leaving 69 genes for further analyses. For gene expression quantification, data were exported as an Excel .csv file and analyzed by the ΔΔCt method using Actb normalization.
Methylation analyses
DNA was isolated from sorted HSCs (4,000–24,000 cells obtained from individual mice) using the Allprep DNA/RNA Mini Kit (Qiagen, 80204) and used for library preparation. Enhanced reduced-representation bisulfite sequencing (ERRBS) was performed as previously described39, except for gel size selection as only fragments of 150–450 bp were excised due to the low input amount of starting DNA. Libraries were sequenced on an Illumina HiSeq 2500. Reads were aligned against a bisulfite-converted mouse genome (mm10) using Bowtie and Bismark (versions 2.2.6 and 0.14.5, respectively). After filtering and normalizing by coverage, differentially methylated cytosines (DMC) were identified using MethylKit (version 0.9.4) and R statistical software (version 3.2.1)40. Significant differentially methylated regions (DMR) were identified with eDMR (version 0.6.3.1) using the following parameters ≥ 2 DMC, ≥ 3 CpG, mean methylation difference ≥ 20, and DMR q-value ≥ 0.05. DMRs were annotated to the RefSeq genes as previously described41. DAVID was used to functionally annotate the differentially methylated genes to GO terms, SP_PIR_KEYWORDS, and KEGG Pathways with an FDR cutoff of 0.1. ChIP-enrich was used to functionally annotate the differentially methylated genes to GO terms and KEGG Pathways with an FDR cutoff of 0.05. Maximum gene set size was limited to 500, and DMR were annotated to the nearest gene
Statistics
All experiments were repeated as indicated. N indicates the numbers of independent biological repeats. Numbers of independent experiments are reported in the supplementary data. Data were expressed as means ± standard deviation (S.D.), or standard error of the mean (S.E.M.) as indicated when a group within an experiment had less than 3 independent repeats, and for all line graph visualization of results. Mice for transplantation were randomized, samples were alternated whenever possible, and no blinding protocol was used. No statistical method was used to predetermine sample size. P-values were generated using two-tailed student’s t-test, and were considered significant when ≤ 0.05. All experiments were repeated as indicated. N indicates the numbers of independent biological repeats which are distinct individual or pooled mice, except when indicated otherwise in the figure legends. Pooled mice were used for Fig. 2a, f–j, Fig. 3a, d, e, Fig. 4a, 4g, Fig. 5d, Fig. 6b and Extended Data Fig. 1k, Fig. 3b, Fig. 4d, f, g, i, Fig. 5a, e, Fig. 6a–d, Fig. c, g, Fig. 9b,c.
Data availability
Datasets that support the findings of this study have been deposited online with the GEO accession numbers GSE81721 and GSE81721. Source data for all the figures are provided with the paper.
Extended Data
Extended Data Fig. 1. Characterization of autophagy-deficient Atg12cKO mice.
a, CBC analyses of lymphocytes and hematocrit in control (Cnt) and Atg12cKO (cKO) mice post-pIC treatment. b, Lineage distribution in PB of Ctrl and cKO mice at 2 months post-pIC, and in young and old mice; My: myeloid; Ly: lymphoid. c, Total cell numbers in PB, spleen (Spl), and BM of Ctrl and cKO mice at 2 months post-pIC. d, Gating strategy for mature populations; ImGr: imature granulocytes/monocytes; Gr: granulocyte; B: B cells. e, f, Mature populations in (e) BM and (f) spleen of Ctrl and cKO mice at 2 months post-pIC. g, Gating strategy for imature BM populations; Lin: lineage negative; MP: myeloid progenitors; CMP: common myeloid progenitor; MEP: megakaryocyte/erythrocyte progenitor. h, Quantification of immature BM populations in Ctrl and cKO mice at 2 months post-pIC; CLP: common lymphoid progenitor. i, HSC frequency over time in Ctrl and cKO mice post-pIC. j, Quantification of MP BM populations in Ctrl and cKO mice at 2 months post-pIC. k, Colony formation in methylcellulose from Cnt and cKO BM at 2 months post-pIC. Data are mean ± S.D.*p ≤ 0.05, **p ≤ 0.01, ***p ≤ 0.001.
Extended Data Fig. 2. Characterization of autophagy-deficient Atg5cKO mice and regenerative capacity of Atg12cKO HSCs.
a–e, Hematopoietic features of control (Cnt-5) and Atg5cKO (cKO-5) mice post-pIC treatment: (a) scheme for deleting Atg5 in the adult blood system, and (b) neutrophil counts in PB, (c) total cell numbers in BM and spleen, and quantification of (d) MP and (e) immature BM populations at 2 months post-pIC. f, Scheme for Cnt and cKO HSC primary and secondary transplantation (tplx). g, Engraftment of young (Y) and old (O) HSCs with donor chimerism in PB over time (left), and lineage distribution in PB (center) with HSC chimerism (right) at the indicated time post-tplx. h, Scheme for aging recipients transplanted with non-pIC treated Cnt and cKO BM cells and subsequently deleted for Atg12. i, Atg12 deletion in recipients transplanted with 2x10⁶ BM cells from 2mo or 24mo-old non-pIC treated cKO donors with donor chimerism in PB post-PBS or pIC (left, ± S.E.M), and lineage distribution in PB at 125d post-tplx (right). Data are mean ± S.D. except where indicated. *p ≤ 0.05, **p ≤ 0.01, ***p ≤ 0.001.
Extended Data Fig. 3. Altered biology of Atg12cKO HSCs and characterization of Park2−/− mice.
a, Representative FACS plot of MTG staining in Cnt and cKO HSCs. b, Representative EM micrographs depicting expanded small vesicles (top) and ER/Golgi (bottom) in Cnt and cKO HSCs; scale bar, 1 μm. c, Representative FACS plot and quantification of ER mass measured by ER-tracker FC staining in Cnt and cKO HSCs. d, e, Representative IF images and quantification of (d) LAMP1 and (e) KDEL staining in Cnt and cKO HSCs; scale bars, 10 μm. f, p62 levels in Cnt and cKO HSCs. g, Mitochondria parameters in Park2+/+ and Park2−/− HSCs. h–m, Characterization of Park2−/− mice: (h) Scheme for analyses, (i) CBC parameters (left) and lineage distribution in PB (right), (j) BM total cell numbers, (k) BM mature populations and (l, m) BM immature populations. n, Transplantation (tplx) of Park2−/− HSCs showing donor chimerism (left) and lineage distribution (center) in PB, and HSC chimerism (right) at the indicated time post-tplx in primary and secondary recipients. Data are mean ± S.D. *p ≤ 0.05, **p ≤ 0.01, ***p ≤ 0.001.
Extended Data Fig. 4. Comparison between activated HSCs, Atg12cKO HSCs and old HSCs.
a, Representative FACS plot of pS6 levels in HSC cultured for 1 hour (hr) ± cytokines (cyt). b, Representative FACS plot of GFP-LC3 in freshly isolated HSCs (t=0) and HSCs cultured for 6hr ±cyt. c, Inactivation of autophagy in +cyt measured by p62 levels. d, Drug modulation of autophagy levels in Gfp–Lc3 HSCs cultured for 3hr ±cyt; Rap: rapamycin; I128: Ink128; CC: compound-C. Results are expressed as percent GFP-LC3 levels upon 3hr culture in +cyt conditions. e, Cell size measured by forward scatter (FSC) in Cnt and cKO HSCs, and young and old HSCs. f, g, Glycolysis activity measured by extracellular acidification rate (ECAR) in (f) Cnt and cKO LSKs, and (g) young and old HSCs; Oligo: oligomicyn; 2-DG: 2-deoxy-d-glucose. h, Mitochondria parameters in young and old HSCs. i, ROS levels in activated HSCs. j, Representative FACS plot and quantification of ROS levels in Cnt and cKO HSCs. k, Representative examples of 3 independent experiments showing IF co-staining of γH2AX with fibrillarin (FBN), 53BP1 and RAD51 in Cnt and cKO HSCs; scale bar: 10 μm. Data are mean ± S.D. except for line graphs, and are expressed relative to 0hr HSCs (c, i), Cnt HSC (e, j), or young HSC (e, h) levels.*p ≤ 0.05, **p ≤ 0.01, ***p ≤ 0.001.
Extended Data Fig. 5. Properties of autophagy-deficient and old HSCs, and effect of ROS scavenging in Atg12cKO mice.
a–c, Characteristics of Cnt and cKO HSCs: (a) apoptosis measured by cleaved caspase 3 (CC3) activity, (b) protein synthesis measured by O-propargyl-puromycin (OP-puro) IF staining, and (c) cycling activity measured by EdU incorporation. d, e, Characteristics of young and old HSCs: (d) ROS levels, and (e) protein synthesis with representative OP-puro IF staining (left) and quantification (right). f, Scheme for N-acetylcysteine (NAC) in vitro treatment and representative example of colony formation in methylcellulose from NAC-treated Cnt and cKO HSCs; CFU: colony-forming unit; Mk(or)E and G(or)M: mature megakaryocyte, erythroid, granulocyte or macrophage colonies; GM/Mix: immature GM or GMMkE colonies. Results are expressed as percent of plated cells. g–i, Scavenging ROS levels in Atg12cKO mice: (g) scheme for NAC in vivo treatment after pIC deletion of Atg12, (h) neutrophil counts (left) and lineage distribution (right) in PB, and (i) quantification of immature BM populations. Data are mean ± S.D., and are expressed relative to Cnt HSC (a, b), or young HSC (d, e) levels.*p ≤ 0.05, **p ≤ 0.01.
Extended Data Fig. 6. Differential gene expression in Atg12cKO HSCs and GMPs, and regulation of DNA methylation in HSCs.
a, Heatmap of differentially expressed genes (DEG) in cKO vs. Cnt HSC microarrays (n = 4). b, Volcano plot of DEGs in cKO vs. Cnt HSCs. c, Gene set enrichment analyses (GSEA) of DEGs in cKO vs Cnt HSCs: NES: normalized enrichment score. d, Heatmap of DEGs in cKO vs. Cnt GMP microarrays (n = 4). e, SAM levels in Cnt and cKO HSCs, and activated HSCs. f, aKG levels in c-kit-enriched Cnt and cKO BM (left), and freshly isolated and activated c-kit-enriched BM (right). Data are means ± S.D. *p ≤ 0.05, ***p ≤ 0.001.
Extended Data Fig. 7. Additional analyses of old Gfp-Lc3 HSCs.
a, Lineage distribution in PB (left) and frequency of the indicated populations (right) in young and old Gfp-Lc3 mice (related to Fig. 5a, b). b, pS6 levels in young and old HSCs. c, d, Representative FACS plots and quantification of Cyto-ID dye levels in (c) HSCs cultured for 3hr ± cyt, and (d) young and old HSCs. e, Representative FACS plots of autophagy low (ATlo) and autophagy high (AThi) oHSC subsets. f, Representative examples of 3 independent experiments showing IF staining of FOXO3a in ATlo and AThi oHSCs; scale bar, 10 μm. g, Representative EM micrographs of oHSCs ± autophagosomes (AP) showing vesicles (top) and ER/Golgi (bottom) compartments; scale bar, 1 μm. h, Representative IF staining and quantification of TOM20 in ATlo and AThi oHSCs; scale bar, 10 μm. i–j, Characteristics of ATlo and AThi oHSCs: (i) TMRE levels, (j) ATP levels, and (k) ROS levels measured by Mitosox Red (MSR) staining. l, Expansion of ATlo and AThi oHSCs in self-renewal culture conditions. m, Colony formation in methylcellulose from ATlo and AThi oHSCs; CFU: colony-forming unit; Mk(or)E and G(or)M: mature megakaryocyte, erythroid, granulocyte or macrophage colonies; GM/Mix: immature GM or GMMkE colonies. Results are expressed as percent of 100 plated cells. Data are mean ± S.D., and are expressed relative to +cyt HSC (b), yHSC (c, e), or ATlo oHSC (h–j, l) levels. *p ≤ 0.05, **p ≤ 0.01, ***p ≤ 0.001.
Extended Data Fig. 8. Functionality of ATlo and AThi old HSC subsets.
a, Scheme for primary and secondary transplantations (tplx) of ATlo or AThi young and old HSCs. b, Transplantation of ATlo and AThi oHSC subsets with 15% GFP-LC3 high/low expression cutoff showing donor chimerism (left) and lineage distribution (center) in PB, and HSC chimerism (right) at the indicated times post-tplx in primary (top row) and secondary (bottom row) recipients. c, GFP-LC3 levels in ATlo and AThi oHSCs before transplantation, and in primary and secondary recipients. Results are expressed relative to GFP-LC3 levels in young HSCs (± S.E.M.). d, Transplantation of ATlo and AThi yHSC subsets with 33% GFP-LC3 high/low expression cutoff showing donor chimerism (left) and lineage distribution (center) in PB, and HSC chimerism (right) at the indicated times post-tplx in primary recipients. Data are mean ± S.D. except when indicated. *p ≤ 0.05, **p ≤ 0.01, ***p ≤ 0.001.
Extended Data Fig. 9. Autophagy capability of ATlo and AThi old HSC subsets.
a, Representative FACS plot and quantification of CD150 levels in ATlo and AThi oHSCs. b, pS6 levels measured by FC in HSCs cultured ±cyt for the indicated times. Results are normalized to IgG levels. c, Drug modulation of autophagy levels in Gfp–Lc3 oHSCs cultured for 3hr ±cyt; Rap: rapamycin; I128: Ink128; CC: compound-C. Results are expressed as percent GFP-LC3 levels upon 3hr culture in +cyt conditions. d, Scheme for the stress experiments assessing the autophagy capability of ATlo and AThi oHSCs. e, f, Response to cytokine starvation with (e) GFP-LC3 levels in freshly isolated (t=0) and upon 6hr culture in ±cyt conditions, and (f) autophagy flux after 6hr culture in ±cyt ±BafA conditions. Percent of flux is calculated as [100 × (1 − (−BafA:+BafA))]. g, Response to glutamine (glu) deprivation. Data are means ± S.D. (a, b, e, f, g) or ± S.E.M. (c), and are expressed relative to ATlo oHSC (a, e) or freshly isolated (t=0) oHSC (b) levels, or relative to +glu conditions (g). ***p ≤ 0.001.
Extended Data Fig. 10. Model for the role of autophagy in HSC function and HSC aging.
HSC activation is accompanied by mitochondria activation and a shift in metabolic activity from glycolysis to OXPHOS, which provides energy and increases the production of mitochondrial metabolites such as α-ketoglutarate (α-KG) that act as substrates/co-factors for epigenetic enzymes. Metabolically activated HSCs are poised to undergo lineage priming and produce differentiated progeny to regenerate the blood system. However, activated HSCs must also return to quiescence to maintain the stem cell pool. In this context, autophagy plays an essential role by clearing activate mitochondria to allow OXPHOS-driven HSCs to efficiently revert to a mostly glycolysis-based metabolic quiescence. Without autophagy, HSCs display an overactive OXPHOS-driven metabolism that promotes myeloid-biased differentiation and loss of stemness as a consequence of epigenetic reprogramming. Other mechanisms of mitochondria elimination likely allow some autophagy-deficient HSCs to return to quiescence during homeostasis, but they do not substitute for autophagy in maintaining HSC function in conditions of intense regeneration stress like transplantation. This role of autophagy becomes even more important with age as the inability of ~ 2/3 of oHSCs to activate autophagy results in an overactive OXPHOS metabolism that impairs self-renewal, promotes proliferation and myeloid differentiation, and contributes to replication stress. These unhealthy oHSCs drive most of the aging blood phenotypes. In contrast, ~ 1/3 of oHSCs activate autophagy, control their metabolic activity, and are the fittest old stem cells that retain functional abilities in an adverse aging BM microenvironment. As all oHSCs remain competent for autophagy induction, it will be exciting to test whether rejuvenation interventions aimed at activating autophagy in unhealthy autophagy-inactivated oHSCs will improve the health of the aging blood system.
Supplementary Material
Acknowledgments
We thank Dr. J. Debnath (UCSF) for his help with these studies, Dr. A. Brunet (Stanford) and Dr. S. Villeda (UCSF) for providing some old C57Bl/6 mice, Drs. J. Cox and D. Ruggero (UCSF) for the gift of Park2−/− mice and Ink128, respectively, S.Y. Zhang for overall assistance, Dr. J. Wong for help with Seahorse studies, J. Wong (Gladstone/UCSF) for electron microscopy analyses, J. Pollack for assistance with bioinformatics, P. Nyugen for contribution to confocal imaging, M. Lee for management of the Flow Cytometry Core Facility, and all members of the Passegué laboratory for insights and suggestions. T.T.H. is supported by an AHA Predoctoral Fellowship and T32GM008284, M.R.W by a LLS Special Fellow Award, E.A. by T32AG000114, E.V. by a NWO Rubicon Fellowship and a BD Biosciences Stem Cell grant. This work was supported by NIH R01HL126947 to M.E.F. and NIH R01CA184014 and P30DK063720, PBBR NFR Award, Glenn Foundation Research Award and LLS Scholar Award to E.P.
Footnotes
Supplementary Information. See accompanying document.
Author Contributions. T.T.H. performed all of the experiments with help from M.R.W. for the initial Atg12cKO mice analyses, E.A. and M.E.F for DNA methylation studies, O.L. and E.V. for technical assistance, and J.F. for OP-puro experiments. T.T.H., M.R.W, and E.P. designed the experiments and interpreted the results. T.T.H. and E.P. wrote the manuscript.
Author Information. The authors declare no competing financial interests.
References
- 1.Niccoli T, Partridge L. Ageing as a risk factor for disease. Curr Biol. 2012;22:R741–752. doi: 10.1016/j.cub.2012.07.024. [DOI] [PubMed] [Google Scholar]
- 2.Rando TA. Stem cells, ageing and the quest for immortality. Nature. 2006;441:1080–1086. doi: 10.1038/nature04958. [DOI] [PubMed] [Google Scholar]
- 3.López-Otín C, Blasco MA, Partridge L, Serrano M, Kroemer G. The hallmarks of aging. Cell. 2013;153:1194–1217. doi: 10.1016/j.cell.2013.05.039. [DOI] [PMC free article] [PubMed] [Google Scholar]
- 4.Orkin SH, Zon LI. Hematopoiesis: an evolving paradigm for stem cell biology. Cell. 2008;132:631–644. doi: 10.1016/j.cell.2008.01.025. [DOI] [PMC free article] [PubMed] [Google Scholar]
- 5.Kohli L, Passegué E. Surviving change: the metabolic journey of hematopoietic stem cells. Trends Cell Biol. 2014;24:479–487. doi: 10.1016/j.tcb.2014.04.001. [DOI] [PMC free article] [PubMed] [Google Scholar]
- 6.Geiger H, de Haan G, Florian MC. The ageing haematopoietic stem cell compartment. Nat Rev Immunol. 2013;13:376–389. doi: 10.1038/nri3433. [DOI] [PubMed] [Google Scholar]
- 7.Ergen AV, Boles NC, Goodell MA. Rantes/Ccl5 influences hematopoietic stem cell subtypes and causes myeloid skewing. Blood. 2012;119:2500–2509. doi: 10.1182/blood-2011-11-391730. [DOI] [PMC free article] [PubMed] [Google Scholar]
- 8.Kusumbe AP, et al. Age-dependent modulation of vascular niches for haematopoietic stem cells. Nature. 2016;532:380–384. doi: 10.1038/nature17638. [DOI] [PMC free article] [PubMed] [Google Scholar]
- 9.He C, Klionsky DJ. Regulation mechanisms and signaling pathways of autophagy. Annu Rev Genet. 2009;43:67–93. doi: 10.1146/annurev-genet-102808-114910. [DOI] [PMC free article] [PubMed] [Google Scholar]
- 10.Liu F, et al. FIP200 is required for the cell-autonomous maintenance of fetal hematopoietic stem cells. Blood. 2010;116:4806–4814. doi: 10.1182/blood-2010-06-288589. [DOI] [PMC free article] [PubMed] [Google Scholar]
- 11.Mortensen M, et al. The autophagy protein Atg7 is essential for hematopoietic stem cell maintenance. J Exp Med. 2011;208:455–467. doi: 10.1084/jem.20101145. [DOI] [PMC free article] [PubMed] [Google Scholar]
- 12.Leveque-El Mouttie L, et al. Autophagy is required for stem cell mobilization by G-CSF. Blood. 2015;125:2933–2936. doi: 10.1182/blood-2014-03-562660. [DOI] [PubMed] [Google Scholar]
- 13.Warr MR, et al. FOXO3A directs a protective autophagy program in haematopoietic stem cells. Nature. 2013;494:323–327. doi: 10.1038/nature11895. [DOI] [PMC free article] [PubMed] [Google Scholar]
- 14.Rubinsztein DC, Marino G, Kroemer G. Autophagy and aging. Cell. 2011;146:682–695. doi: 10.1016/j.cell.2011.07.030. [DOI] [PubMed] [Google Scholar]
- 15.Garcia-Prat L, et al. Autophagy maintains stemness by preventing senescence. Nature. 2016;529:37–42. doi: 10.1038/nature16187. [DOI] [PubMed] [Google Scholar]
- 16.Levine B, Mizushima N, Virgin HW. Autophagy in immunity and inflammation. Nature. 2011;469:323–335. doi: 10.1038/nature09782. [DOI] [PMC free article] [PubMed] [Google Scholar]
- 17.Codogno P, Mehrpour M, Proikas-Cezanne T. Canonical and non-canonical autophagy: variations on a common theme of self-eating? Nat Rev Mol Cell Biol. 2012;13:7–12. doi: 10.1038/nrm3249. [DOI] [PubMed] [Google Scholar]
- 18.Youle RJ, Narendra DP. Mechanisms of mitophagy. Nat Rev Mol Cell Biol. 2011;12:9–14. doi: 10.1038/nrm3028. [DOI] [PMC free article] [PubMed] [Google Scholar]
- 19.Goldberg MS, et al. Parkin-deficient mice exhibit nigrostriatal deficits but not loss of dopaminergic neurons. J Biol Chem. 2003;278:43628–43635. doi: 10.1074/jbc.M308947200. [DOI] [PubMed] [Google Scholar]
- 20.Vannini N, et al. Specification of haematopoietic stem cell fate via modulation of mitochondrial activity. Nature Commun. 2016;7:13125. doi: 10.1038/ncomms13125. [DOI] [PMC free article] [PubMed] [Google Scholar]
- 21.Ito K, et al. Self-renewal of a purified Tie2+ hematopoietic stem cell population relies on mitochondrial clearance. Science. 2016 doi: 10.1126/science.aaf5530. pii: aaf5530 [Epub ahead of print] [DOI] [PMC free article] [PubMed] [Google Scholar]
- 22.Mizushima N, Yamamoto A, Matsui M, Yoshimori T, Ohsumi Y. In vivo analysis of autophagy in response to nutrient starvation using transgenic mice expressing a fluorescent autophagosome marker. Mol Biol Cell. 2004;15:1101–1111. doi: 10.1091/mbc.E03-09-0704. [DOI] [PMC free article] [PubMed] [Google Scholar]
- 23.Mohrin Mary, et al. Science. 2015;347:1374–1377. doi: 10.1126/science.aaa2361. [DOI] [PMC free article] [PubMed] [Google Scholar]
- 24.Rodgers JT, et al. mTORC1 controls the adaptive transition of quiescent stem cells from G0 to GAlert. Nature. 2014;510:393–396. doi: 10.1038/nature13255. [DOI] [PMC free article] [PubMed] [Google Scholar]
- 25.Flach J, et al. Replication stress is a potent driver of functional decline in ageing haematopoietic stem cells. Nature. 2014;512:198–202. doi: 10.1038/nature13619. [DOI] [PMC free article] [PubMed] [Google Scholar]
- 26.Chandel NS, Jasper H, Ho TT, Passegué E. Metabolic regulation of stem cell function in tissue homeostasis and organismal ageing. Nat Cell Biol. 2016;18:823–832. doi: 10.1038/ncb3385. [DOI] [PubMed] [Google Scholar]
- 27.Owusu-Ansah E, Banerjee U. Reactive oxygen species prime Drosophila haematopoietic progenitors for differentiation. Nature. 2009;461:537–541. doi: 10.1038/nature08313. [DOI] [PMC free article] [PubMed] [Google Scholar]
- 28.Chambers SM, et al. Hematopoietic fingerprints: an expression database of stem cells and their progeny. Cell Stem Cell. 2007;1:578–591. doi: 10.1016/j.stem.2007.10.003. [DOI] [PMC free article] [PubMed] [Google Scholar]
- 29.Kohli RM, Zhang Y. TET enzymes, TDG and the dynamics of DNA demethylation. Nature. 2013;502:472–479. doi: 10.1038/nature12750. [DOI] [PMC free article] [PubMed] [Google Scholar]
- 30.Fuso A, et al. Gene silencing by S - adenosylmethionine in muscle differentiation. FEBS lett. 2001;508:337–340. doi: 10.1016/s0014-5793(01)03030-7. [DOI] [PubMed] [Google Scholar]
- 31.Owen MR, Doran E, Halestrap AP. Evidence that metformin exerts its anti-diabetic effects through inhibition of complex 1 of the mitochondrial respiratory chain. Biochemical Journal. 2000;348:607–614. [PMC free article] [PubMed] [Google Scholar]
- 32.Puleston DJ, et al. Autophagy is a critical regulator of memory CD8+ T cell formation. Elife. 2014;3:e03706. doi: 10.7554/eLife.03706. [DOI] [PMC free article] [PubMed] [Google Scholar]
- 33.Tang AH, Rando TA. Induction of autophagy supports the bioenergetic demands of quiescent muscle stem cell activation. EMBO J. 2014;33:2782–2797. doi: 10.15252/embj.201488278. [DOI] [PMC free article] [PubMed] [Google Scholar]
- 34.Kuhn R, Schwenk F, Aguet M, Rajewsky K. Inducible gene targeting in mice. Science. 1995;269:1427–1429. doi: 10.1126/science.7660125. [DOI] [PubMed] [Google Scholar]
- 35.Hara T, et al. Suppression of basal autophagy in neural cells causes neurodegenerative disease in mice. Nature. 2006;441:885–889. doi: 10.1038/nature04724. [DOI] [PubMed] [Google Scholar]
- 36.Pietras E, et al. Functionally distinct subsets of lineage-biased multipotent progenitors control blood production in normal and regenerative conditions. Cell Stem Cell. 2015;17:35–46. doi: 10.1016/j.stem.2015.05.003. [DOI] [PMC free article] [PubMed] [Google Scholar]
- 37.Bolstad BM, Irizarry RA, Astrand M, Speed TP. A comparison of normalization methods for high density oligonucleotide array data based on variance and bias. Bioinformatics. 2003;19:185–193. doi: 10.1093/bioinformatics/19.2.185. [DOI] [PubMed] [Google Scholar]
- 38.Ritchie ME, et al. Limma powers differential expression analyses for RNA-sequencing and microarray studies. Nucleic Acids Res. 2015;43:e47. doi: 10.1093/nar/gkv007. [DOI] [PMC free article] [PubMed] [Google Scholar]
- 39.Akalin A, et al. Base-pair resolution DNA methylation sequencing reveals profoundly divergent epigenetic landscapes in acute myeloid leukemia. PLoS genetics. 2012;8:e1002781. doi: 10.1371/journal.pgen.1002781. [DOI] [PMC free article] [PubMed] [Google Scholar]
- 40.Akalin A, et al. MethylKit: a comprehensive R package for the analysis of genome-wide DNA methylation profiles. Genome biology. 2012;13:R87. doi: 10.1186/gb-2012-13-10-r87. [DOI] [PMC free article] [PubMed] [Google Scholar]
- 41.Meldi K, et al. Specific molecular signatures predict decitabine response in chronic myelomonocytic leukemia. J Clin Invest. 2015;125:1857–1872. doi: 10.1172/JCI78752. [DOI] [PMC free article] [PubMed] [Google Scholar]
Associated Data
This section collects any data citations, data availability statements, or supplementary materials included in this article.
Supplementary Materials
Data Availability Statement
Datasets that support the findings of this study have been deposited online with the GEO accession numbers GSE81721 and GSE81721. Source data for all the figures are provided with the paper.


