Abstract
Background
Cognitive impairment (CI) cannot be diagnosed by MRI. Functional MRI (fMRI) paradigms such as the immediate/delayed memory task (I/DMT), detect varying degrees of working memory. Preliminary findings using I/DMT, showed differences in Blood Oxygenation Level Dependent (BOLD) activation between impaired (MSCI, n=12) and non-impaired (MSNI, n=9) MS patients.
Objectives
To confirm CI detection based on I/DMT’ BOLD activation in a larger cohort of MS patients. The role of T2 lesion volume (LV) and EDSS in magnitude of BOLD signal were also sought.
Methods
Fifty patients [EDSS mean (m) = 3.2, DD m =12 yr., age m =40yr.] underwent the Minimal Assessment of Cognitive Function in MS (MACFIMS) and the I/DMT. Working-memory activation (WMa) represents BOLD signal during DMT minus signal during IMT. CI was based on MACFIMS.
Results
10 MSNI, 30 MSCI and 4 borderline patients were included in analyses. ANOVA showed MSNI had significantly greater WMa than MSCI, in the left (L) prefrontal cortex and L supplementary motor area (p = 0.032). Regression analysis showed significant inverse correlations between WMa and T2 LV/EDSS in similar areas (p = 0.005, 0.004 respectively).
Conclusion
I/DMT-based BOLD activation detects CI in MS, larger studies are needed to confirm these findings.
Keywords: cognitive impairment, multiple sclerosis, working memory, BOLD, fMRI, MACFIMS
Introduction
MS is the most common non-traumatic, disabling CNS disease of young adults.1,2 Cognitive impairment (CI) affects a large proportion of these patients and is an important cause of permanent disability.3,4 However, full understanding of the pathophysiological mechanisms underlying MS-related CI remains incomplete.
Conventional and non-conventional MRI techniques have been correlated with CI in MS.5–8 MRI has improved our understanding of the relationship between lesions and disease manifestations,9–11 but its role in the diagnosis of CI is not defined. Functional (f) MRI studies, have shown significant correlations between abnormal signals and cognitive function across MS phenotypes compared to healthy controls (HC). Mainero et al., reported that “changes in functional organization of the cerebral cortex have been seen with fMRI studies comparing activation patterns during cognitive tasks, in patients with MS and HC”. A study by Rocca on 17 primary progressive patients, did not show structural MRI differences but found activation differences between those with CI and those intact;12 another study using the go-no go task, was able to confirm adaptive changes of neuronal activation with progressing relapsing forms of MS.10 Together these provide evidence for the compensatory nature of the Blood Oxygenation Level Dependent (BOLD) activation patterns.6,10,12
Recognizing that CI is not routinely assessed in the clinical setting, an international panel created The Minimal Assessment of Cognitive Function in MS (MACFIMS) battery, which evaluates all sensitive domains in CI, including working memory (WM), attention and information processing (IP), the former and latter being the most commonly involved.8,13 Nevertheless, such specialized batteries are not routinely used in clinical practice. Recently, a short battery called the Brief International Cognitive Assessment for Multiple Sclerosis (BICAMS)14 was recommended for CI screening in the clinical setting; despite its ease of administration, BICAMS is not used routinely. Reliable MRI metrics to screen for early CI may facilitate interventions that could reverse, slow or halt its progression, decreasing the burden of CI on MS patients.
fMRI is a useful tool to understand CI’ pathophysiology.15 Sweet et al., using the 2-back test evaluated verbal WM in MS,19 concluding that high functioning patients showed greater activation in regions associated with verbal WM.16 Chiaravalloti et al. using the Paced Auditory Serial Addition Test (PASAT), confirmed that WM dysfunction is associated with activation in cognition related areas .17 In a review, Filippi et al., concluded that fMRI has great potential to provide insight into cortical reorganization following damage from MS.4
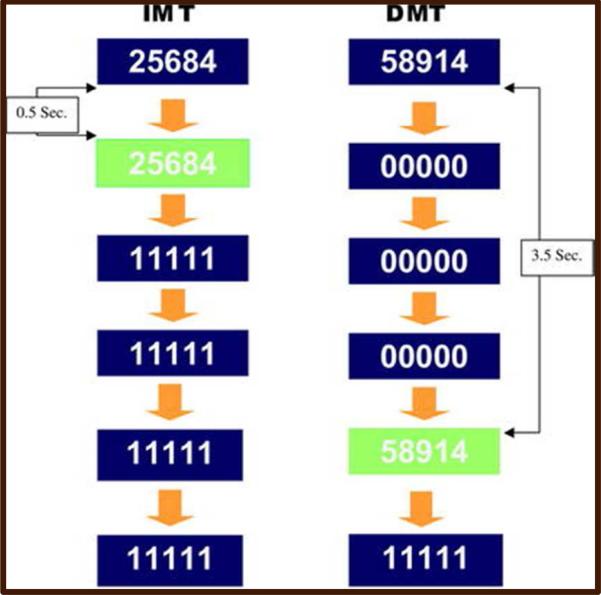
Although fMRI provides a better understanding of the cognitive constructs that underlie pathologic processes in CI, most paradigms do not evaluate varying degrees of WM, nor have been validated by complete neuropsychological (NP) batteries. The immediate/delayed memory task (I/DMT) paradigm yields more detailed information related to WM (which encompasses attention and IP), by detecting different degrees of impairment. It does so by alternating 3 levels of complexity of visual stimuli (3-, 5- and 7-digit strings of numbers) for both immediate (0.5 s) and delayed (3.5 s) memory recall tasks (figure 1). Variation in task difficulty allows for comparison of the parametric levels within a single fMRI session, to enable determination of the relationship between task difficulty and BOLD activation. Moeller et al. using I/DMT, demonstrated less thalamic BOLD activation in cocaine-dependent subjects as compared to HC.18 This and other studies suggest that I/DMT may offer advantages in studying the effects of manipulating cognitive load on sustained attention when comparing HC and cognitively impaired patients. Although attention, IP and WM are affected in MS-related CI, I/DMT has not been used to assess CI in this population.
Figure 1.
I/DMT creates variation in working memory demands by changing the number of digits per stimulus (3, 5 or 7) to alter task difficult, in addition to changing the working memory delay (0.5 vs. 3.5 Sec.). Both are varied parametrically.
In this cross-sectional study, ten non-impaired MS patients (MSNI) and forty patients with CI (MSCI) underwent MACFIMS and an fMRI session performing I/DMT. The objective was to evaluate the capability of I/DMT to detect CI based on BOLD activation, specifically with respect to WM, and to correlate results with those of MACFIMS. We hypothesized that I/DMT’ based BOLD activation would differ between MSCI and MSNI patients and that classification into MSNI or MSCI by BOLD signal and I/DMT scores would correlate with MACFIMS’ classification.
Measures of T2 lesion load correlate with CI, but its role in BOLD activation has rarely been evaluated, therefore the role of T2 lesion volume (LV) in the magnitude of BOLD signal was assessed. Correlations between disability and BOLD signal were also sought.
Materials and Methods
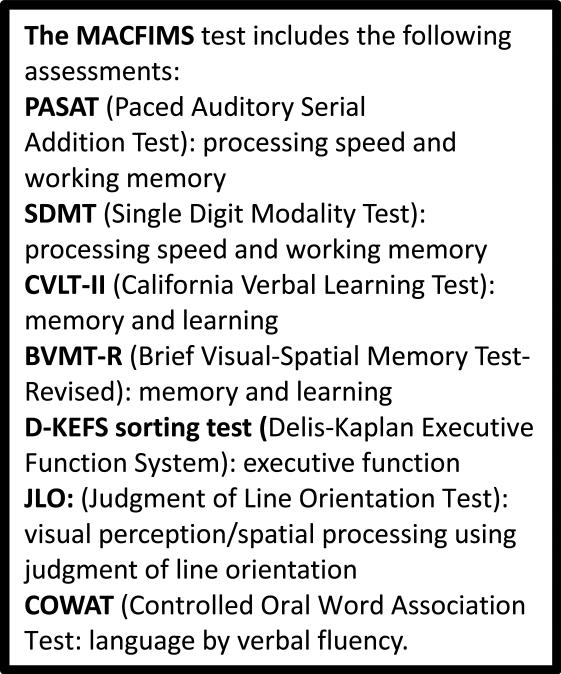
Ten relapsing remitting (RR) MSNI and forty MSCI patients [31 RR, 1 progressive relapsing and 8 secondary progressive; age 40.80±11.26 (18-58) years (y), education 14.17±2.34 y, disease duration (DD) y 13.29±9.21, and Expanded Disability Status Scale (EDSS) 3.51±2.03 (0-7)] were enrolled (Table 1). Prior to enrollment, the presence of CI was established by either screening with the MSNQ19,20 or formal NP evaluation within 2 years of enrollment. Written informed consent was obtained from each patient following institutional review and approval of the research protocol. Patients underwent the MACFIMS battery21 (Figure 2), followed by one fMRI session, which took place within 2-7 days from the MACFIMS. For exclusion criteria please see supplementary material.
Table 1.
Patients Demographics
| N | Age | Gender | DD (y) | EDSS | Education(y) | MS Type | II | MACFIMS | Exclusions |
|---|---|---|---|---|---|---|---|---|---|
| 1 | 39 | M | 5 | 0 | 18 | RR | 0.05 | MSNI | |
| 2 | 47 | F | 20 | 1 | 20+ | RR | 0.05 | MSNI | |
| 3 | 24 | F | 10 | 2 | 16 | RR | 0.15 | MSNI | |
| 4 | 58 | F | 25 | 1.5 | 16 | RR | 0.1 | MSNI | |
| 5 | 40 | M | 4 | 1.5 | 16 | RR | 0.05 | MSNI | |
| 6 | 37 | M | 17 | 1 | 16 | RR | 0 | MSNI | |
| 7 | 23 | F | 5 | 1 | 16 | RR | 0.1 | MSNI | |
| 8 | 27 | M | 7 | 1 | 18 | RR | 0 | MSNI | |
| 9 | 36 | F | 2 | 3 | 12 | RR | 0.1 | MSNI | |
| 10 | 36 | F | 1.5 | 1 | 12 | RR | 0.15 | MSNI | |
| 11 | 48 | F | 23 | 2.5 | 16 | RR | 0.3 | BD | |
| 12 | 46 | F | 18 | 3 | 16 | RR | 0.45 | MSCI | |
| 13 | 51 | M | 23 | 2.5 | 18 | SP | 0.5 | MSCI | |
| 14 | 34 | F | 10 | 3 | 16 | RR | 0.6 | MSCI | |
| 15 | 53 | M | 30 | 3 | 16 | RR | 0.6 | MSCI | |
| 16 | 27 | M | 13 | 6.5 | 12 | RR | 0.6 | MSCI | |
| 17 | 46 | F | 12 | 2 | 12 | RR | 0.8 | MSCI | No I/DMT |
| 18 | 29 | F | 3 | 2.5 | 12 | RR | 0.75 | MSCI | |
| 19 | 52 | F | 30 | 6 | 16 | RR | 0.45 | MSCI | |
| 20 | 54 | 21 | 2.5 | 16 | RR | 0.6 | MSCI | No I/DMT | |
| 21 | 20 | F | 3 | 2.5 | 12 | RR | 0.65 | MSCI | |
| 22 | 53 | F | 14 | 6 | 12 | SP | 0.85 | MSCI | |
| 23 | 54 | F | 37 | 4.5 | 12 | RR | 0.55 | MSCI | |
| 24 | 53 | F | 12 | 3 | 16 | PR | 0.4 | MSCI | |
| 25 | 46 | F | 20 | 7 | 12 | SP | MSCI | No I/DMT | |
| 26 | 53 | F | 11 | 6 | 12 | SP | 1 | MSCI | |
| 27 | 47 | F | 12 | 6 | 12 | RR | 0.3 | BD | No I/DMT |
| 28 | 18 | M | 4 | 2.5 | 10 | RR | 0.75 | MSCI | |
| 29 | 55 | F | 8 | 4 | 12 | RR | 0.7 | MSCI | |
| 30 | 55 | F | 33 | 6 | 16 | SP | 0.75 | MSCI | |
| 31 | 53 | F | 23 | 3 | 12 | RR | 0.5 | MSCI | |
| 32 | 29 | F | 12 | 1.5 | 16 | RR | 0.25 | BD | |
| 33 | 45 | F | 17 | 6 | 16 | RR | 0.45 | MSCI | |
| 34 | 22 | F | 9 | 2 | 12 | RR | 0.35 | MSCI | |
| 35 | 49 | M | 24 | 6 | 16 | RR | 0.9 | MSCI | |
| 36 | 52 | F | 8 | 2 | 16 | RR | 0.45 | MSCI | |
| 37 | 38 | M | 20 | 6.5 | 16 | SP | 0.55 | MSCI | |
| 38 | 45 | F | 24 | 4 | 18 | SP | 0.95 | MSCI | No I/DMT |
| 39 | 42 | F | 22 | 2.5 | 14 | RR | 0.75 | MSCI | |
| 40 | 50 | F | 9 | 3 | 12 | RR | 0.3 | BD | |
| 41 | 36 | F | 11 | 6 | 14 | SP | 0.65 | MSCI | |
| 42 | 37 | F | 1 | 6 | 14 | RR | 0.6 | MSCI | |
| 43 | 28 | M | 12 | 2.5 | 12 | RR | 0.6 | MSCI | |
| 44 | 49 | F | 11 | 2.5 | 16 | RR | 0.45 | MSCI | |
| 45 | 38 | F | 4 | 6.5 | 12 | RR | 0.45 | MSCI | |
| 46 | 51 | F | 12 | 7 | 14 | SP | 0.5 | MSCI | |
| 47 | 40 | F | 6 | 2 | 12 | RR | 0.35 | MSCI | |
| 48 | 45 | F | 23 | 6 | 12 | RR | 0.55 | MSCI | |
| 49 | 34 | F | 1 | 6 | 12 | RR | 0.8 | MSCI | No I/DMT |
| 50 | 24 | F | 6 | 2 | 12 | RR | 0.3 | BD |
DD= disease duration, II= impairment index, N= Number, y= years, EDSS= expanded disability status scale.
Figure 2.
Components of MACFIMS; in this study the D-KEFS was replaced with the Wisconsin Card Sorting Test (WCST)
fMRI session
Prior to imaging, patients underwent a 45-minute practice session in a “mock” scanner to familiarize themselves with the I/DMT. This paradigm has a parametric block design. The number of digits in the stimulus string can be 3, 5 or 7, and the number of digits per stimulus is held constant within each block. Likewise, the type of memory delay condition is held constant within each block (Figure 1). All 3 levels of the digit-load condition and 2 levels of the memory-delay condition are presented within each run. An IMT block is always followed by a DMT block with the same number of digits per stimulus. For more details on the I/DMT task, please see supplementary material.
fMRI acquisition
Studies were performed using the In Vivo Eloquence System. The session included acquisition of a high-resolution T1 weighted 3D-magnetizaion prepared rapid acquisition gradient echo (MPRAGE) followed by 3 runs of the I/DMT. Spin-echo EPI rather than gradient echo EPI was used, in order to avoid signal losses caused by strong susceptibility gradients (through slice de-phasing) in regions such as the medial orbitofrontal cortex 22–24 which is a sensitive area for evaluation of cognitive function by fMRI at 3T23 based on the BOLD effect.25 Each patient also underwent an MRI of the brain according to standard protocol (Table 2).
Table 2.
Image acquisition parameters for anatomical and fMRI pulse sequences
| Sequence | Plane | TR ms | TE ms | TI ms | Image matrix | FOV mm | Slice mm | SENSE |
|---|---|---|---|---|---|---|---|---|
| PSIR | axial | 4300 | 13 | 400 | 256 × 256 | 240 | 3 | no |
| DIR | axial | 15000 | 25 | 3400/325 | 512 × 512 | 240 | 3 | 2 |
| T1W | axial | 600 | 9.2 | – | 256 × 256 | 240 | 3 | no |
| Dual-e-FSE | axial | 6800 | 10/90 | – | 256 × 256 | 240 | 3 | 1.5 |
| FLAIR | axial | 10,000 | 80 | 2600 | 256 × 256 | 240 | 3 | 2 |
| SE EPI | axial | 2200 | 75 | – | 240/240 | 240 | 3.75/gap1.25 | 2.5 |
| 3D MPRAGE | sagittal | 8.1 | 3.7 | – | 256 × 256 | 240 | 1 | 2 |
PSIR, phase sensitive inversion recovery; DIR, double inversion recovery; W, weighted; FSE, fast spin echo; e, echo; EPI echo planar image; FLAIR, fluid attenuated inversion recovery.
fMRI processing and analysis
AFNI and SPM8 software (Mathworks Inc. Sherborn MA, USA) were used. Please see supplementary material for details.
Quantitative MRI analysis
Image segmentation for tissue quantification was performed using software developed in-house26 In brief, all images acquired were retrospectively aligned27 and stripped of extrameningeal tissues,28 then filtered using the anisotropic diffusion filter corrected for the bias field,29 and intensity normalized.30 Segmentation of GM, WM, T2 and T1 LV were based on the dual echo and FLAIR images using the hidden Markov random field–expectation maximization algorithm and Parzen window classification.26
Statistical Analysis
For the block design I/DMT protocol, the IMT and DMT conditions for each digit-load condition were modeled by boxcar functions convolved with the SPM8 canonical hemodynamic response function. Parameters for each condition were estimated using the general linear model (GLM) at each voxel. The fMRI time series was high-pass filtered with a cut-off period of 330 s determined by Fourier transformation of each condition's time model. The WM activation (“WMa”) for each digit-load condition was defined as the DMT parameter estimate for that digit-load condition minus the IMT parameter estimate for that digit-load condition. Comparison of activation between groups was conducted at the second level of analysis by entering one contrast image per subject into the SPM8 Random Effects procedure. This was implemented within the GLM using the SPM8 non-sphericity correction to correct for between-group heterogeneity of variance. Statistical significance was computed by SPM8, to correct for multiple comparisons over all the voxels in the brain. Areas of statistically significant differences in BOLD activation were identified using 2-tailed family wise error (FWE)-corrected cluster-level, p < 0.05. Approximate anatomical labels for regions of activation were determined using the Anatomical Automatic Labeling toolbox.31
Regression analyses were conducted using the SPM8 second-level Multiple Regression module: (a) I/DMT activation on T2LV, (b) I/DMT activation on DMT A'scores, and (c) I/DMT activation on EDSS scores. For each regression analyses, the contributions of age, sex, education, DD, and disability were examined using stepwise multiple regression with forward selection, with p less than 0.10 as the criterion for a variable to enter the regression model at each step, and p greater than 0.15 to leave the regression model at each step. In addition, the correlation of each of these individual variables with I/DMT activation was determined in a separate analysis.
The Accuracy prime (A′) score
It is an accuracy measure from the I/DMT responses entered by each subject, they range from 0.5 (chance) to 1.0 (perfect discriminability). Recall failures or errors, as well as correct responses, are taken into account in the formula for calculating the A′ score.32
MACFIMS scoring
20 MACFIMS parameters were identified in an a priori manner as most pertinent in the measurement of CI 3,21. Based on validated methodology,33 an impairment index (ii) was derived as follows: patients were classified as MSCI if performance was more than one standard deviation below the mean on 40% of the 20 pre-identified parameters, for an ii of > 0.35. Patients were classified as MSNI if performance was more than 1 standard deviation below the mean on less than 40% (less than 8 of 20) of the parameters, for an ii of < 0.2. Patients with ii scores between 0.2 and 0.35 were considered borderline (MSBD).
Results
The final sample consisted of 10 MSNI, 30 MSCI and 4 MSBD patients. Since MSBD are partially impaired, analyses were performed both including and excluding MSBD. 6 MSCI were excluded from analyses due to lack of responses or head motion during I/DMT.
I/DMT scoring by A′
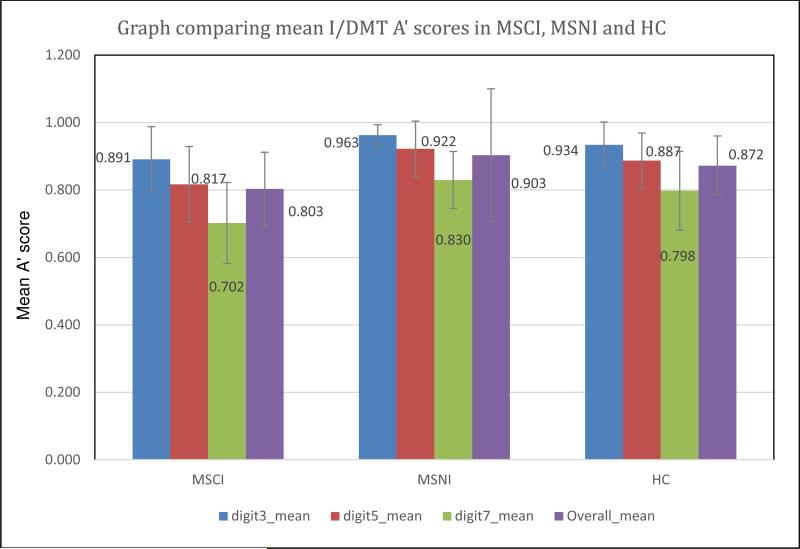
MSNI patients had a mean A′ score similar to a previously evaluated medically healthy group (N = 31) with a mean (m) A′ score of 0.872 ± 0.093.18 Expected differences were seen; the MSCI group showed lower m A′ scores in all tasks compared to the MSNI group (Figure 3). Differences were also seen in m DMT7 A′ score, DD and T2LV between groups (Table 3).
Figure 3.
Expected differences were seen between MSNI and MSCI patients. The MSCI group showed lower mean A′ scores in all tasks compared to the MSNI group. MSNI scores were consistent with those seen in a group of previously evaluated healthy, non-MS subjects.
Table 3.
Mean A’ scores and DMT 7 A’ Scores (highest difficulty task), were significantly higher in MSNI vs. MSCI. These differences were also seen with DD, T2LV and ii between the MSNI and MSCI groups.
| Patients | T2 LV (ml) | Impairment Index | Mean EDSS | Mean A’ score | DMT7 A’ score | |
|---|---|---|---|---|---|---|
| MSNI | Mean | 6.0072 | 0.0750 | 1.30 | 0.903 | 0.8375 |
| 10 | SD | 6.5200 | 0.0540 | 0.79 | 0.061 | 0.0791 |
| MSCI | Mean | 24.9589 | 0.5900 | 4.25 | 0.803 | 0.6878 |
| 30 | SD | 19.7622 | 0.1610 | 1.80 | 0.076 | 0.1183 |
A=accuracy, DMT=delayed memory task, LV=lesion volume, EDSS=expanded disability status scale.
A′ vs. ii scores
I/DMT A′ scores and MACFIMS’ ii were compared among patients and were in 100% agreement in classifying patients as MSNI vs. MSCI.
BOLD activation and CI
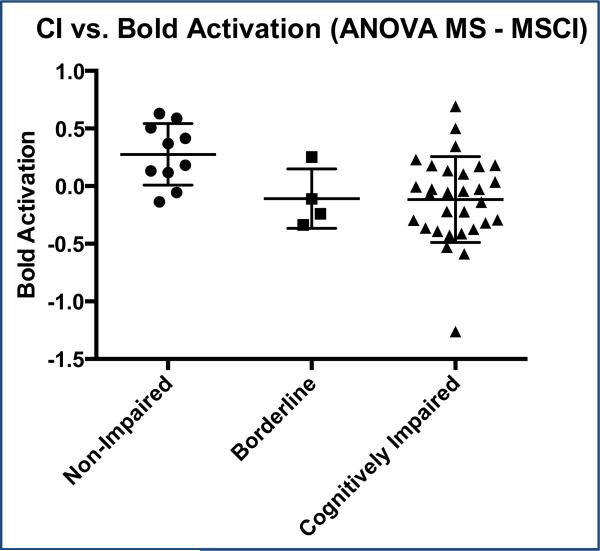
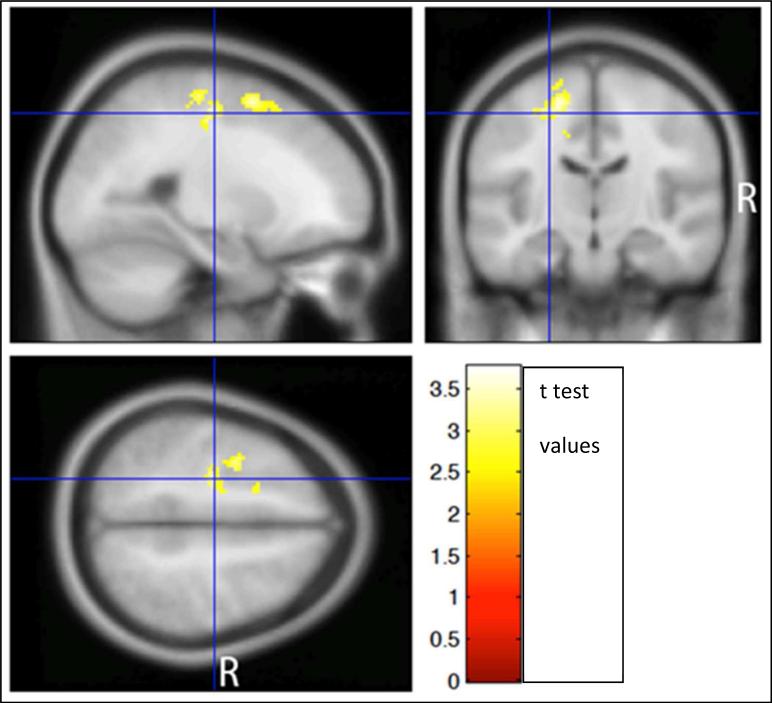
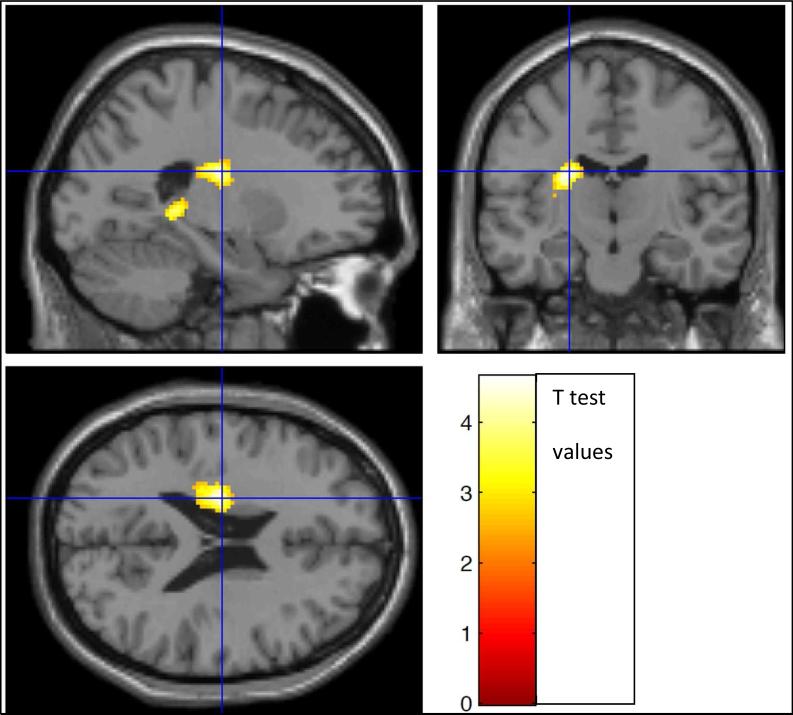
In a 3-group ANOVA comparing I/DMT activation between the three groups (10 MSNI, 30 MSCI and 4 MSBD), MSNI patients in comparison to MSCI had significantly greater DI7 activation [BOLD signal during 7 digit I/DMT task, 2-tailed FWE-corrected cluster, p = 0.032; cluster extent = 529 voxels(v)] in portions of the Left (L) middle frontal gyrus (g), L superior frontal g, L superior medial frontal g, and L supplementary motor area (SMA), (figures 4 and 5). There were no significant differences in DI7 activation between MSNI and MSBD. There were no significant positive or negative correlations of DI3, DI5, or DI7 activations with ii.
Figure 4.
Significantly greater BOLD activation was seen in MSNI subjects (ii = < 0.2) compared to MSCI (ii = > 0.35). Only 4 subjects were identified as BDMS (ii = 0.20-0.34)
Figure 5.
MSNI subjects had significantly greater DI7 WMa than MSCI in portions of the L supplementary motor area (SMA), L middle frontal gyrus (g), L superior frontal g and L superior medial frontal g (2-tailed FWE-corrected cluster, p = 0.032; cluster extent = 529 voxels). Clusters are shown in color, overlayed on a standard MNI template brain image (in gray). Three orthogonal planes are shown through the same voxel depicted by the crosshairs. Color scale depicts the t-test values of the correlation analysis. Left brain hemisphere is on the reader's left hand side of the axial and coronal views.
Regression of I/DMT activation and T2LV
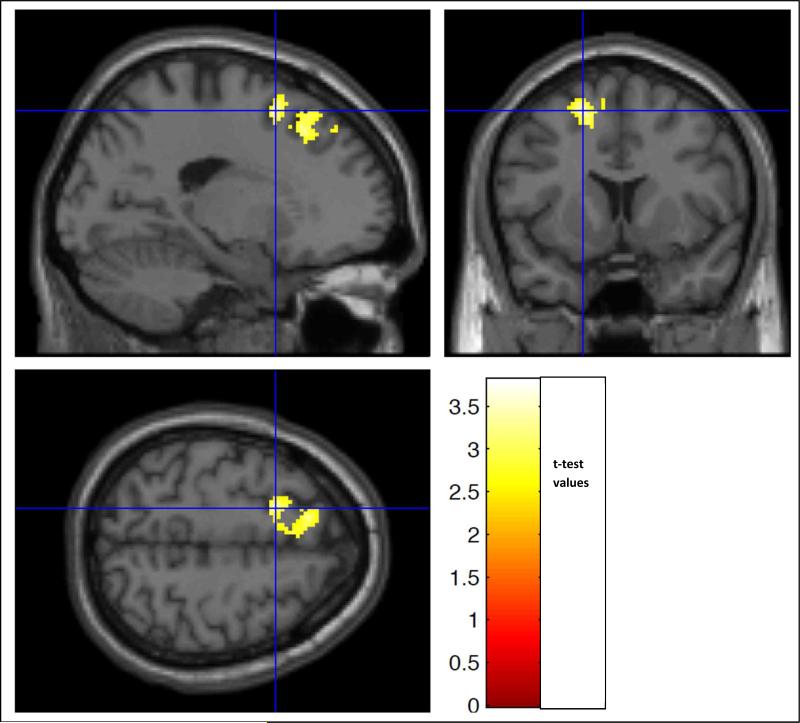
In the group of 40 patients (30 MSCI +10 MSNI), there was a significant inverse correlation of DI7 activation with T2LV in portions of L middle and superior frontal g, L paracentral lobule, L post and precentral g and L SMA (p = 0.005; cluster extent = 657 v; average correlation coefficient within the significant cluster was r = −0.42) (Figure 6, Table 4). 34. This inverse correlation had 22 voxels in the L superior frontal g which are also voxels in which MSNI subjects had significantly greater DI7 activation than MSCI subjects. When the 4 MSBD were included in the analysis, there was also a significant inverse correlation of DI7 activation with T2LV in the same areas (p = 0.002, cluster extent = 798 v, r = −0.40). There were no brain regions that showed a positive correlation between T2LV and DI7 activation. There were no significant positive or negative (inverse) correlations with T2LV and activation during DI3 or DI5.
Figure 6.
Regression analysis showed a significant inverse correlation between BOLD signal during DI7 and T2LV in portions of the L middle and superior frontal gyrus (g), L para, post and pre-central lobule, and L SMA in the combined group of 30 MSCI + 10 MSNI subjects (p = 0.01, cluster extent = 657 voxels). The color scale indicates the t-test values of the analysis.
Table 4.
SPM8 second level regression analysis of 7-digit working memory activation on LESION VOLUME scores in the combined group consisting of 10 MS subjects and 30 MSCI subjects.
| Regression direction (positive or negative) | Cluster label | Two-tailed FWE corrected cluster p | Mean regression coefficient across all voxels in cluster (± 90% CI) | Number of voxels in cluster | Relative maximal voxel t | X | Y | Z | Location |
|---|---|---|---|---|---|---|---|---|---|
| POSITIVE | p >0.05 | No significant clusters. | |||||||
| NEGATIVE | 1 | p <0.01 | −0.0079 (0.0033) | 657 | 3.77 | −24 | −16 | 52 | L Pre-central gyrus, white matter* |
| 3.71 | −16 | −14 | 60 | L Pre-central gyrus, white matter* | |||||
| 3.69 | −30 | 2 | 58 | L Middle Frontal Gyrus |
Significance criterion = Family-Wise Error rate (FWE) corrected two-tailed cluster p < 0.05. Within the significant cluster, the 3 relative maximal voxel t values that are greater than 8 mm apart and their approximate anatomical locations within 3 mm radius are listed. Cluster-defining threshold t = 2.50. X, Y, and Z=MNI standard atlas coordinates (mm). Voxel dimensions = (2 2 2) mm. Negative X=Left hemisphere. L=Left. G=Gyrus. Smoothness of residual field full width at half maximum = (11.1 10.9 9.6) mm. Search volume = 94,712 voxels = 589.5 resolution elements. Degrees of freedom of t test = 38.0.
Harvard-Oxford Cortical Structural Atlas (Desikan et al., 2006).
The regression of I/DMT activation on T2 LV separately within the MSNI group (N=10) showed a significant positive correlation in the following two clusters. Cluster 1: portions of L and R cingulate g, R precentral g, L SMA, R superior frontal g, and R postcentral g (p=0.006; cluster extent = 1097v, r = 0.73). Cluster 2: portions of R middle and superior temporal g, R thalamus, R hippocampus, R insula, R rolandic operculum, R putamen, R Heshl's g, R parahippocampal g, and R middle temporal pole (p=0.036; cluster extent = 819 v, r = 0.72). There were no areas which showed a significant inverse association of I/DMT activation on T2 LV within the MSNI group.
The regression of I/DMT activation on T2 LV separately within the MSCI group (N=30) showed an inverse association (p=0.05; cluster extent = 496 v, r = −0.48) for one cluster, in portions of L pre and postcentral g, L superior and middle frontal g, L paracentral lobule, L precuneus, and L SMA. There was no significant positive association of I/DMT activation on T2 LV within the MSNI group.
Regression of I/DMT activation on DMT A′ scores
In the group of 40, there was a significant positive correlation of DI7 activation with DMT 7 A′ scores in portions of the L superior and middle frontal g, L SMA, and L medial superior frontal g (p = 0.002; cluster extent = 837 v, r = 0.41) (Figure 7). No significant inverse correlation was found. No significant positive or inverse correlations were found between DI3 or DI5 WMa with mean A′ scores. In the group of 44, there was also a significant positive correlation of DI7 activation with DMT 7 A′ scores in similar areas (p = 0.002; cluster extent = 1280 v, r = 0.40). This positive correlation had 264 voxels in the L superior frontal g which are also voxels in which MSNI subjects had significantly greater DI7 activation than MSCI subjects.
Figure 7.
Regression analysis showed a positive correlation between of DI7 activation (highest complexity task) and DMT 7 A′ scores in portions of the L superior and middle frontal g, L SMA, and L medial superior frontal g (p = 0.002; cluster extent = 837 v, r = 0.41).
Regression of 7-digit I/DMT activation on EDSS scores
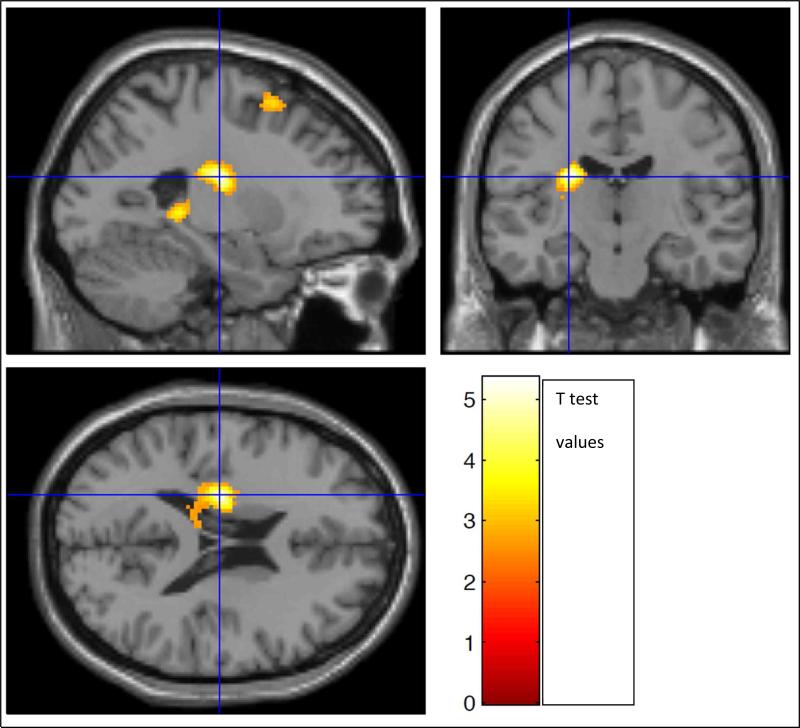
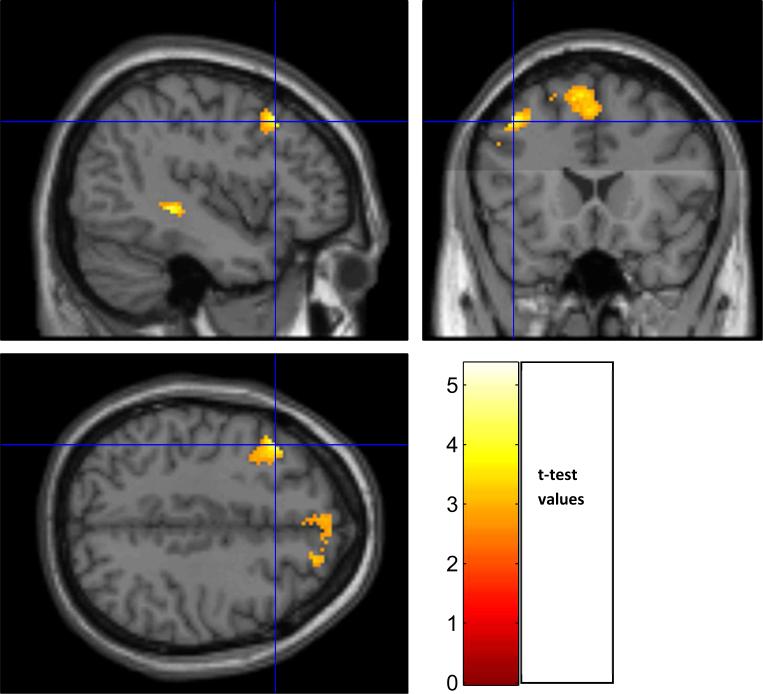
In the group of 40 patients, there was a significant inverse correlation of DI7 activation with EDSS scores in the following clusters. Cluster 1: portions of L hippocampus, L thalamus, L caudate, L putamen, and L lingual g (p = 0.002; cluster extent = 843 v, r = −0.44) (Figure 8). Cluster 2: portions of L middle and inferior frontal g, L and R superior medial frontal g, L and R superior frontal g, L precentral g, and pars opercularis (p < 0.002; cluster extent 1168 v, r = −0.42) (Figure 9). In the group of 44, there was a significant inverse correlation of DI7 activation with EDSS scores in portions of L caudate, L hippocampus, L lingual g, and L thalamus (p=004; cluster extent = 742 v, r = −0.42) (Figure 10). No correlations were found between DI5 or DI3 and EDSS
Figure 8.
In the combined group of 40 patients, there was a significant inverse correlation of DI7 activation with EDSS scores in two clusters. Cluster 1 (above): in portions of L hippocampus, L thalamus, L caudate, L putamen, and L lingual g ((p = 0.002; cluster extent = 843 v, r = −0.44)
Figure 9.
Correlation of DI7 activation with EDSS scores (N=40). Cluster 2: portions of L middle and inferior frontal g, L and R superior medial frontal g, L and R superior frontal g, L precentral g, and pars opercularis (p < 0.002; cluster extent 1168 v, r = −0.42).
Figure 10.
In the combined group of 44 subjects, there was a significant inverse correlation of DI7 activation with EDSS scores in portions of L caudate, L hippocampus, L lingual g, and L thalamus (p=004; cluster extent = 742 v, r = −0.42)
None of the variables age, sex, education, or DD met criteria for entering the stepwise multiple regression model for DI7 activation on EDSS scores.
In separate analyses, none of these variables showed a significant individual correlation with DI7 activation (2-tailed FWE-corrected cluster p was greater than 0.10 for each of these correlations). These variables as well as EDSS scores failed to enter the final model for I/DMT activation on T2 LV or on DMT A′ scores.
Retrospective analysis by order of enrollment
The group of the first 15 MSCI patients enrolled, showed greater BOLD activation during DI5 compared to the group of 10 MSNI. This was explained by a higher mean T2LV, ii and DD than the rest of the MSCI enrolled later (table 5).
Table 5.
BOLD signal and CI.
| Subjects by order of enrollment | 1-10 (1 excluded) MSNI (n9) |
11-30 (5 excluded) MSCI (n15) |
31-50 (5 excluded) MSCI (n15) |
|---|---|---|---|
| T2 Lesion volume mean and SD | 6.007 (6.520) | 29.085 (20.591) | 20.833 (18.668) |
| T2 Lesion volume (ml) median | 3.063 | 17.877 | 18.744 |
| Disease duration (y) mean and SD | 9.65 (8.192) | 16.6 (11.356) | 13.533 (7.501) |
| Disease duration median | 7 | 13 | 12 |
| EDSS mean and SD | 1.3 (0.788) | 4.066 (1.591) | 4.433 (2.042) |
| EDSS median | 1 | 3 | 6 |
| ii mean | 0.075 (0.054) | 0.64 (0.1638) | 0.54 (0.1466) |
| ii median | .05 | 0.6 | 0.5 |
Preliminary analysis between 10 MSNI vs. the first 15 MSCI patients (by order of enrollment), showed significantly greater BOLD signal in MSCI during DI5 (unlike final analysis), this was explained by differences between the MSCI groups; the first group of 15 patients enrolled had higher LV, DD and ii than the second group of 15 enrolled (4 MSBD and 6 MSCI excluded). This supports that I/DMT may detect various degrees of CI.
Discussion
The combination of NP and fMRI studies provides a new insight for understanding the biological mechanisms responsible for the clinical manifestation of CI in MS. Our results suggests that CI can be detected by the I/DMT in MS. The accurate performance of this paradigm requires intact cognitive abilities for processing of visual information, IP, sustained attention and WM.
In this study, greater BOLD activation during I/DMT was seen in several brain regions, mainly the prefrontal cortex, in the MSNI compared to the MSCI group, during the 7-digit but not during the 3 or 5 digit tasks. Our findings are consistent with results from a recent multicenter trial by Rocca et al., where 42 RRMS patients were evaluated during the N-back load condition, showing that the 22 cognitively preserved patients had increased recruitment of the right dorsolateral prefrontal cortex during the cognitive task.35 In this study, the greater BOLD activation seen in MSNI, also correlated with I/DMT performance (based on A′ scores), with T2LV and with EDSS, supporting the notion the higher lesion load not only correlates with higher disability but may interfere with connections/input from different brain regions involved in cognition. As T2LV increases, there seems to be a decrease in the brain's ability to compensate (by either increasing activation or activating additional regions) for the disruption of input to areas involved in performing a cognitive task
These results extend previous evidence that MS patients consistently recruit additional functional brain areas resulting in increased connectivity and thus show greater BOLD activation, 7 supporting that enhancement of effective neuronal connectivity may provide a compensatory mechanism, and lack of this capability, reflects CI. Of interest, preliminary analysis between the first 9 MSNI and 12 MSCI patients enrolled in the study, showed differences in BOLD activation during DI5 but not DI7, with greater activation seen in the MSCI In a retrospective analysis to clarify this issue, the first 15 MSCI patients enrolled, were found to have a higher m ii, m T2 LV and m DD compared to the rest of the MSCI patients (Table 5), supporting that I/DMT detects different degrees of CI, as this group of MSCI patient was unable to perform at the DI7 level.
In MS, an increase in task-related BOLD activation has been proposed as a compensatory mechanism that may delay the onset of CI and that exhausts as disease progresses.10 Our results show that higher T2LV was associated with less task related BOLD signal during the highest complexity task, suggesting that an increase in T2LV may be an underlying mechanism for eventual exhaustion of compensatory activation. The negative correlation found between BOLD activation and EDSS supports the notion that with increased disability, compensatory mechanisms decrease, but task complexity plays a role.
Limitations of this study are the small number of patients, the lack of age/sex matched HC, lack of test re-tests reliability and the complexity of I/DMT, which was not feasible to obtain in severe CI. Two patients with severe CI were unable to provide correct answers above the 3-digit task; which did not prove useful for CI detection.
In conclusion, the I/DMT fMRI paradigm detects CI in MS based on differences in BOLD activation between MSCI and MSNI patients in brain areas related to WM, attention and IP. This was supported by concordance in classification as MSNI or MSCI by ii from MACFIMS and A′ scores from I/DMT. These findings support that this technique can improve our understanding of CI and may potentially be used in evaluating interventions to improve cortical function and brain plasticity.
Supplementary Material
Acknowledgments
Special thanks to Vipulkumar “Vips” Patel MRI technician for excellent technical support
Footnotes
Conflict of interest
The author(s) declared no potential conflicts of interest with respect to the research, authorship, and/or publication of this article. Authors had access to the study data, access is on-going.
References
- 1.Nylander A, Hafler DA. Multiple sclerosis. J Clin Invest. 2012;122(4):1180–1188. doi: 10.1172/JCI58649. doi:10.1172/JCI58649.The. [DOI] [PMC free article] [PubMed] [Google Scholar]
- 2.Noseworthy JH, Lucchinetti C, Rodriguez M, Weinshenker BG. Multiple sclerosis. N Engl J Med. 2000;343(13):938–952. doi: 10.1056/NEJM200009283431307. [DOI] [PubMed] [Google Scholar]
- 3.Amato MP, Ponziani G, Pracucci G, Bracco L, Siracusa G, Amaducci L. Cognitive impairment in early-onset multiple sclerosis. Arch Neurol. 1995;52:168–172. doi: 10.1001/archneur.1995.00540260072019. [DOI] [PubMed] [Google Scholar]
- 4.Filippi M, Rocca MA, Benedict RHB, et al. The contribution of MRI in assessing cognitive impairment in multiple sclerosis. Neurology. 2010;75(23):2121–2128. doi: 10.1212/WNL.0b013e318200d768. doi:10.1212/WNL.0b013e318200d768. [DOI] [PMC free article] [PubMed] [Google Scholar]
- 5.Nelson F, Datta S, Garcia N, et al. Intracortical lesions by 3T magnetic resonance imaging and correlation with cognitive impairment in multiple sclerosis. Mult Scler. 2011;17(9):1122–1129. doi: 10.1177/1352458511405561. doi:10.1016/j.micinf.2011.07.011.Innate. [DOI] [PMC free article] [PubMed] [Google Scholar]
- 6.Mainero C, Pantano P, Caramia F, Pozzilli C. Brain reorganization during attention and memory tasks in multiple sclerosis: insights from functional MRI studies. J Neurol Sci. 2006;245(1-2):93–98. doi: 10.1016/j.jns.2005.08.024. doi:10.1016/j.jns.2005.08.024. [DOI] [PubMed] [Google Scholar]
- 7.Guimarães J, Sá MJ. Cognitive dysfunction in multiple sclerosis. Front Neurol. 2012;3(May):1–8. doi: 10.3389/fneur.2012.00074. doi:10.3389/fneur.2012.00074. [DOI] [PMC free article] [PubMed] [Google Scholar]
- 8.Rao SM, Leo GJ, Bernardin L, Unverzagt F. Cognitive dysfunction in multiple sclerosis. I. Frequency, patterns, and prediction. Neurology. 1991;41(5):685–691. doi: 10.1212/wnl.41.5.685. doi:10.1212/WNL.41.5.685. [DOI] [PubMed] [Google Scholar]
- 9.Kutzelnigg A, Lucchinetti CF, Stadelmann C, et al. Cortical demyelination and diffuse white matter injury in multiple sclerosis. Brain. 2005;128(11):2705–2712. doi: 10.1093/brain/awh641. doi:10.1093/brain/awh641. [DOI] [PubMed] [Google Scholar]
- 10.Loitfelder M, Fazekas F, Petrovic K, et al. Reorganization in cognitive networks with progression of multiple sclerosis: insights from fMRI. Neurology. 2011;76(6):526–533. doi: 10.1212/WNL.0b013e31820b75cf. doi:10.1212/WNL.0b013e31820b75cf. [DOI] [PubMed] [Google Scholar]
- 11.Kinsinger SW, Lattie E, Mohr DC. Relationship between depression, fatigue, subjective cognitive impairment, and objective neuropsychological functioning in patients with multiple sclerosis. Neuropsychology. 2010;24(5):573–580. doi: 10.1037/a0019222. doi:10.1037/a0019222.Relationship. [DOI] [PMC free article] [PubMed] [Google Scholar]
- 12.Rocca MA, Riccitelli G, Rodegher M, et al. Functional MR imaging correlates of neuropsychological impairment in primary-progressive multiple sclerosis. AJNR Am J Neuroradiol. 2010;31(7):1240–1246. doi: 10.3174/ajnr.A2071. doi:10.3174/ajnr.A2071. [DOI] [PMC free article] [PubMed] [Google Scholar]
- 13.DeLuca J, Johnson SK, Natelson BH. Information processing efficiency in chronic fatigue syndrome and multiple sclerosis. Arch Neurol. 1993;50(3):301–304. doi: 10.1001/archneur.1993.00540030065016. doi:10.1001/archneur.1993.00540030065016. [DOI] [PubMed] [Google Scholar]
- 14.Langdon DW, Amato MP, Boringa J, et al. Recommendations for a brief international cognitive assessment for multiple sclerosis (BICAMS). Mult Scler J. 2012;18(6):891–898. doi: 10.1177/1352458511431076. doi:10.1177/1352458511431076. [DOI] [PMC free article] [PubMed] [Google Scholar]
- 15.Bastianello S, Giugni E, Amato M, et al. Changes in magnetic resonance imaging disease measures over 3 years in mildly disabled patients with relapsing-remitting multiple sclerosis receiving interferon β-1a in the COGnitive Impairment in MUltiple Sclerosis (COGIMUS) study. BMC Neurol. 2011;11(1):125. doi: 10.1186/1471-2377-11-125. doi:10.1186/1471-2377-11-125. [DOI] [PMC free article] [PubMed] [Google Scholar]
- 16.Sweet LH, Rao SM, Primeau M, Mayer AR, Cohen RA. Functional magnetic resonance imaging of working memory among multiple sclerosis patients. J Neuroimaging. 2004;14(2):150–157. doi:10.1177/1051228403262695. [PubMed] [Google Scholar]
- 17.Chiaravalloti N, Hillary F, Ricker J, et al. Cerebral activation patterns during working memory performance in multiple sclerosis using fMRI. J Elinical Exp Neuropsychol. 2005;27(1):33–54. doi: 10.1080/138033990513609. doi:10.1080/138033990513609. [DOI] [PubMed] [Google Scholar]
- 18.Moeller FG, Steinberg JL, Schmitz JM, et al. Working memory fMRI activation in cocaine depenent subjects: association with treatment response. Psychiatry Res. 2010;181(3):174–182. doi: 10.1016/j.pscychresns.2009.11.003. doi:10.1021/ja8019214.Optimization. [DOI] [PMC free article] [PubMed] [Google Scholar]
- 19.Benedict RHB, Munschauer F, Linn R, et al. Screening for multiple sclerosis cognitive impairment using a self-administered 15-item questionnaire. Mult Scler. 2003;9(1):95–101. doi: 10.1191/1352458503ms861oa. doi:10.1191/1352458503ms861oa. [DOI] [PubMed] [Google Scholar]
- 20.Benedict RHB, Cox D, Thompson LL, Foley F, Weinstock-Guttman B, Munschauer F. Reliable screening for neuropsychological impairment in multiple sclerosis. Mult Scler. 2004;10(6):675–678. doi: 10.1191/1352458504ms1098oa. doi:10.1191/1352458504ms1098oa. [DOI] [PubMed] [Google Scholar]
- 21.Benedict RHB, Zivadinov R. Reliability and validity of neuropsychological screening and assessment strategies in MS. J Neurol. 2007;254(Suppl 2):II22–II25. doi: 10.1007/s00415-007-2007-4. doi:10.1007/s00415-007-2007-4. [DOI] [PubMed] [Google Scholar]
- 22.Krüger G, Kastrup A, Glover GH. Neuroimaging at 1.5 T and 3.0 T: comparison of oxygenation-sensitive magnetic resonance imaging. Mangetic Reson Med. 2001;45(4):595–604. doi: 10.1002/mrm.1081. [DOI] [PubMed] [Google Scholar]
- 23.Norris DG, Zysset S, Mildner T, Wiggins CJ. An investigation of the value of spin-echo-based fMRI using a Stroop color-word matching task and EPI at 3 T. Neuroimage. 2002;15(3):719–726. doi: 10.1006/nimg.2001.1005. doi:10.1006/n. [DOI] [PubMed] [Google Scholar]
- 24.Wang J, Li L, Roc AC, et al. Reduced susceptibility effects in perfusion fMRI with single-shot spin-echo EPI acquisitions at 1.5 Tesla. Magn Reson Imaging. 2004;22(1):1–7. doi: 10.1016/S0730-725X(03)00210-8. doi:10.1016/S0730-725X(03)00210-8. [DOI] [PubMed] [Google Scholar]
- 25.Ogawa S, Lee TM, Kay AR, Tank DW. Brain magnetic resonance imaging with contrast dependent on blood oxygenation. Proc Natl Acad Sci U S A. 1990;87(24):9868–9872. doi: 10.1073/pnas.87.24.9868. [DOI] [PMC free article] [PubMed] [Google Scholar]
- 26.Sajja BR, Datta S, He R, et al. Unified approach for multiple sclerosis lesion segmentation on brain MRI. Ann Biomed Eng. 2006;34(1):142–151. doi: 10.1007/s10439-005-9009-0. doi:10.1016/j.micinf.2011.07.011.Innate. [DOI] [PMC free article] [PubMed] [Google Scholar]
- 27.He R, Narayana PA. Global optimization of mutual information: application to three-dimensional retrospective registration of magnetic resonance images. Comput Med Imaging Graph. 2002;26(4):277–292. doi: 10.1016/s0895-6111(02)00019-8. doi: http://dx.doi.org/10.1016/S0895-6111(02)00019-8. [DOI] [PubMed] [Google Scholar]
- 28.Datta S, Sajja BR, He R, Gupta RK, Wolinsky JS, Narayana PA. Segmentation of gadolinium-enhanced lesions on MRI in multiple sclerosis. J Magn Reson Imaging. 2007;25(5):932–937. doi: 10.1002/jmri.20896. doi:10.1002/jmri.20896. [DOI] [PubMed] [Google Scholar]
- 29.Perona P, Malik J. Scale-space and edge detection using anisotropic diffusion. IEEE Trans Pattern Anal Mach Intell. 1990;12(7):629–639. [Google Scholar]
- 30.Nyúl LG, Udupa JK, Zhang X. New variants of a method of MRI scale standardization. IEEE Trans Pattern Anal Mach Intell. 2000;19(2):143–150. doi: 10.1109/42.836373. [DOI] [PubMed] [Google Scholar]
- 31.Tzourio-Mazoyer N, Landeau B, Papathanassiou D, et al. Automated anatomical labeling of activations in SPM using a macroscopic anatomical parcellation of the MNI MRI single-subject brain. Neuroimage. 2002;15(1):273–289. doi: 10.1006/nimg.2001.0978. doi:10.1006/n. [DOI] [PubMed] [Google Scholar]
- 32.Donaldson W. Measuring recognition memory. J Exp Psychol Gen. 1992;121:275–277. doi: 10.1037//0096-3445.121.3.275. [DOI] [PubMed] [Google Scholar]
- 33.Reitan RM, Wolfson D. Theoretical, methodological, and validational bases of the Halstead-Reitan neuropsychological test battery. Comprehensive Handbook of Psychological Assessment. 2004:105–133. [Google Scholar]
- 34.Desikan R, Ségonne F, Fischl B, et al. An automated labeling system for subdividing the human cerebral cortex on MRI scans into gyral based regions of interest. Neuroimage. 2006;31(3):968–980. doi: 10.1016/j.neuroimage.2006.01.021. [DOI] [PubMed] [Google Scholar]
- 35.Rocca MA, Valsasina P, Hulst HE, et al. Functional Correlates of Cognitive Dysfunction in Multiple Sclerosis: A Multicenter fMRI Study. Hum Brain Mapp. 2014;35:5799–5814. doi: 10.1002/hbm.22586. [DOI] [PMC free article] [PubMed] [Google Scholar]
Associated Data
This section collects any data citations, data availability statements, or supplementary materials included in this article.


