

Abstract
Non-Small Cell Lung Cancer (NSCLC) demonstrates remarkable molecular diversity. With the completion of The Cancer Genome Atlas (TCGA), there is opportunity for systematic analyses of the entire TCGA NSCLC cohort, including comparisons and contrasts between different disease subsets. On the basis of multidimensional and comprehensive molecular characterization (including DNA methylation and copy, and RNA and protein expression), 1023 NSCLC cases—519 from TCGA adenocarcinoma (AD) project and 504 from TCGA squamous cell (SQCC) project—were classified using a “cluster-of-clusters” analytic approach. Patterns from TCGA NSCLC subsets were examined in independent external databases, including the PROSPECT (Profiling of Resistance patterns and Oncogenic Signaling Pathways in Evaluation of Cancers of the Thorax) NSCLC dataset. Nine genomic subtypes of NSCLC were identified, three within SQCC and six within AD. SQCC subtypes were associated with transcriptional targets of SOX2 or p63. One predominately AD subtype (with a large proportion of SQCC) shared molecular features with neuroendocrine tumors. Two AD subtypes manifested a CpG island methylator phenotype (CIMP). Three AD subtypes showed high p38 and mTOR pathway activation. AD subtypes associated with low differentiation showed relatively worse prognosis. SQCC subtypes and two of the AD subtypes expressed cancer-testis antigen genes, while three AD subtypes expressed several immune checkpoint genes including PDL1 and PDL2, corresponding with patterns of greater immune cell infiltration. Subtype associations for several immune-related markers—including PD1, PDL1, CD3, and CD8—were confirmed in the PROSPECT cohort using immunohistochemistry. NSCLC molecular subtypes have therapeutic implications and lend support to a personalized approach to NSCLC management based on molecular characterization.
INTRODUCTION
Non-small-cell lung cancers (NSCLCs) represent a heterogeneous set of diseases with diverse pathological, genetic, and cellular features, with the two predominant NSCLC histological phenotypes being adenocarcinoma (AD, representing ~50% of cases) and squamous cell carcinoma (SQCC, ~40%)1. Lung ADs often have glandular histology and are believed to originate from the distal lung, while SQCCs are characterized by squamous differentiation, similar to the pseudostratified columnar epithelium lining the trachea and upper airways1. ADs and SQCCs frequently differ in their responses to therapy2. Gene expression profiling also reveals widespread molecular differences between AD and SQCC, as well as distinct disease subsets existing within AD or SQCC that may transcend current pathological classifications3–7.
Recently, The Cancer Genome Atlas (TCGA) carried out separate studies of lung AD and lung SQCC—to comprehensively profile each of these diseases at the molecular level, uncovering insights into the molecular basis of each subtype of NSCLC6, 7. Although for a large proportion of TCGA lung cancer cases an identifiable driver oncogene was not found, transcriptional and epigenetic profiling revealed disease subtypes thought to reflect the downstream consequences of oncogenic processes7. Less than half of the >1000 lung cancers cases now represented in TCGA were analyzed in the first TCGA-led lung cancer studies, with additional cases having data generated subsequent to the earlier studies. With the recent conclusion of the data generation phase of TCGA, there is opportunity for systematic analyses of the entire TCGA NSCLC cohort, allowing for comparisons and contrasts to be made between the different diseases, as well as offering a much larger dataset for increased power in detecting significant molecular patterns. In addition, molecular profiling datasets external to TCGA lung datasets can be leveraged, in order to bring meaningful context or validation to the diverse molecular patterns represented by the various NSCLC subtypes.
METHODS
TCGA Datasets
Multiplatform genomics datasets were generated by TCGA Research Network (http://cancergenome.nih.gov/). In total, 1023 NSCLC cases assayed on at least three different molecular profiling platforms (RNA sequencing, DNA methylation arrays, miRNA sequencing, Affymetrix SNP arrays, whole exome sequencing, Reverse Phase Protein Arrays) were included in the analysis. Sequence files are available from CGHub (https://cghub.ucsc.edu/). All other molecular, clinical and pathological data are available through the TCGA Data Commons (https://gdc.nci.nih.gov/). Informed consent was obtained from all subjects6, 7. For TCGA cohort, the median follow-up time for alive patients was 1.9 years (compared to 4.1 years for PROSPECT cohort), which was found to be insufficient for survival analyses.
Multiplatform-based subtype discovery
As described in Supplementary Methods, NSCLC cases were subtyped according to each of the individual data platforms for DNA methylation, DNA copy alteration, mRNA expression, miRNA expression, and protein expression. Subtypes defined from each platform were coded into a series of indicator variables for each subtype, with the matrix of 1 and 0s then clustered by a Cluster of Cluster Analysis (COCA)8, 9 to define integrated subtypes. For the k=7 COCA subtype solution, we defined the top differential genes associated with each subtype; we first computed the two-sided t-test for each gene, comparing each subtype with the rest of the tumors, then selected the top 100 genes with the lowest p-value for each subtype.
Immune Cell Signature Analysis
To computationally infer the infiltration level of specific immune cell types using RNA-seq data, we used a set of 501 genes specifically overexpressed in one of 24 immune cell types from Bindea et al.10. For scoring TCGA cancer samples for each of these immune cell signatures, the average of the z-normalized gene expression values (transformed to standard deviations from the median of the TCGA NSCLC samples) was used. In addition, samples were scored for expression of Antigen Presentation MHC class I (APM1) genes (HLA-A/B/C, B2M, TAP1/2, TAPBP) and for Antigen Presentation MHC class II (APM2) genes.
Analysis of External Lung Cancer Datasets
We examined two external gene expression profiling datasets of lung cancers11, 12, classifying each external tumor profile by genomic subtype as defined by TCGA data. Genes within each dataset were logged and centered. For each subtype, a classifier based on the top 700 COCA-associated mRNAs was constructed as follows: for each gene, the associated value for the classifier was either “0” if the gene was not in the 100 mRNAs most specific to the subtype, “1” if the gene was relatively higher in the subtype and “−1” if the gene was relatively lower. For each profile in the external dataset, the Pearson’s correlation with each of the seven subtype-specific classifiers was calculated, and the highest correlation was used to select the genomic subtype to assign to the profile.
Immunohistochemistry
Four-micron-thick sequential histological tumor sections were obtained from a representative formalin-fixed, paraffin-embedded tumor block and used for immunohistochemistry (IHC) analysis. IHC was performed using an automated staining system as described in the Supplementary Methods. To measure the IHC expression of the different markers and quantify the inflammatory cells expressing, the slides, containing whole tumor sections, were digitally scanned at ×200 magnification. The images were visualized and analyzed as described in Supplementary Methods.
RESULTS
Multiplatform analysis uncovers nine major genomic subtypes of NSCLC
TCGA collected a total of 1023 primary NSCLC specimens (Table S1), for which data were generated for at least three of the following molecular platforms: whole exome sequencing, DNA copy by SNP array, RNA-seq, microRNA-seq, DNA methylation array, and Reverse Phase Protein Array (RPPA). These specimens were divided between two TCGA-sponsored projects: “LUSC”, corresponding to the study of lung SQCC, and “LUAD”, corresponding to lung AD. Of the 1023 cases, 179 LUSC cases and 230 LUAD cases were analyzed previously by TCGA in two separate studies focusing respectively on lung SQCC6 and lung AD7.
In this present study, the 1023 TCGA NSCLC cases were subtyped according to each of the data platforms for DNA methylation, DNA copy alteration, mRNA expression, miRNA expression, and protein expression, with the various subtype calls for each sample then being consolidated to define multiplatform-based molecular subtypes. Each individual platform was used to define six different subtypes of NSCLC spanning LUAD and LUSC projects (Figure S1a), consistent with previous analyses that indicated on the order of three to four molecular subtypes existed within each of lung SQCC and lung AD disease groups6, 7. To provide an integrated level of assessment of NSCLC molecular-based subtypes, subtype calls made by the different molecular platforms were combined by a “cluster of clusters analysis” (COCA)8 approach (Figure 1a) to form seven different integrated subtypes (Figures S1b–S1d). For each of the COCA-based subtypes, the top 100 genes most differentially expressed in the given subtype versus the rest of the tumors were identified (Figure 1b and Table S2). On the basis of DNA methylation (Figure 1c), two of the COCA-based subtypes were each further divided into two separate subtypes with similar expression patterns but distinctive methylation patterns, resulting in a total of nine molecular-based NSCLC subtypes (Table 1).
Figure 1. Genomic subtypes of NSCLC in TCGA cohort by analysis of multiple data platforms.
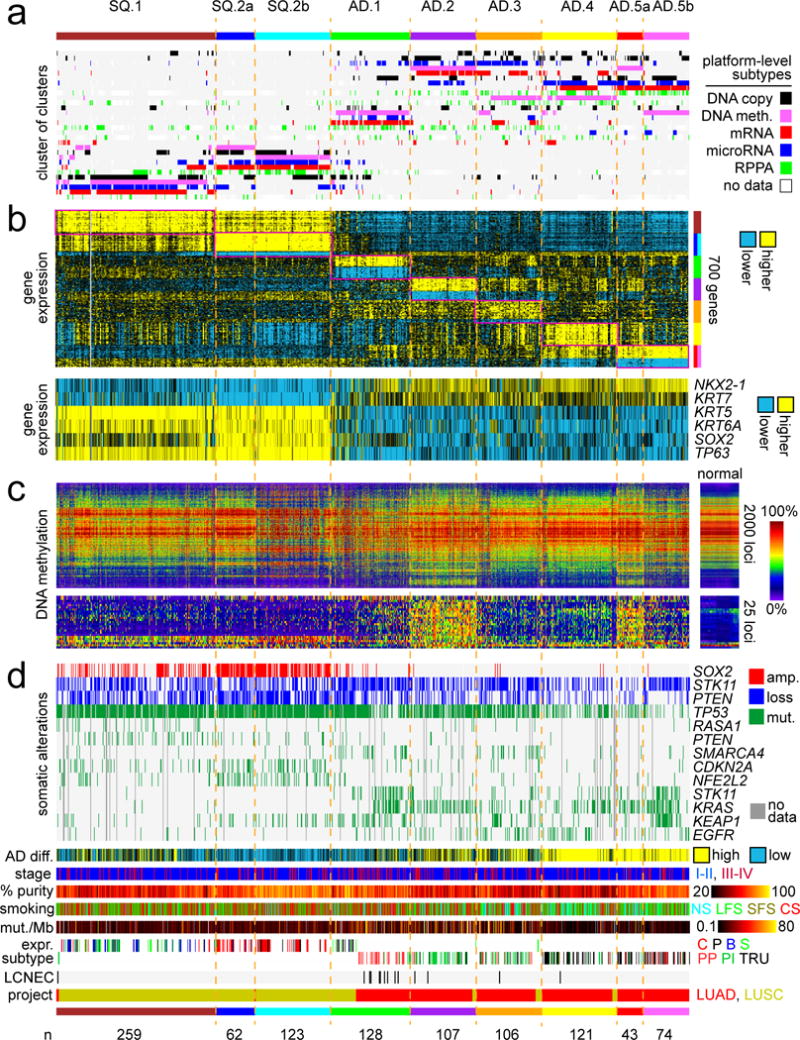
(a) Integration of subtype classifications from five “omic” data platforms identified nine major lung cancer groups represented in TCGA (n=1023 cases). Three of these subtypes—SQ.1, SQ.2a, SQ.2b—are enriched for lung Squamous Cell Carcinoma (SQCC) cases; five other subtypes—AD.1, AD.2, AD.3, AD.4, AD.5a, AD.5b—are enriched for lung Adenocarcinoma (AD) cases. The heat map displays the subtypes defined independently by DNA methylation (pink), Chromosomal copy alteration (black), mRNA expression (red), microRNA expression (blue), and protein (RPPA) expression (green); each row in this heat map denotes membership within a specific subtype defined by the indicated platform. (b) Differential gene expression patterns, with the first heat map representing a set of genes that help to distinguish between the nine subtypes (for each subtype, showing the top 100 genes most differentially in the given subtype versus the rest of the tumors, with SQ.2a and SQ.2b showing homogeneous global expression patterns but differing methylation patterns, as is also the case with AD.5a and AD.5b), and with the second heat map representing well-established markers distinguishing lung SQCC from lung AD. (c) DNA methylation patterns, with the first heat map representing the top 2000 genomic loci with the highest variability in DNA methylation patterns across tumors, and with the second heat map representing probes in CpG island promoter regions used previously to identify CIMP lung AD cases7. (d) Specific copy number and nonsilent somatic mutation features, transcriptional signature of high AD differentiation4, patient stage, estimated tumor sample purity25, patient smoking status (NS, lifelong never-smokers; LFS, longer-term former smokers greater than 15 years; SFS, shorter-term former smokers; CS, current smokers), mutation rate, mRNA expression-based subtype6, 7 (LUSC: C, classical; P, primitive; B, basal; S, secretory; LUAD: PP, Proximal proliferative; PI, Proximal inflammatory; TRU, Terminal respiratory unit), LCNEC (large cell neuroendocrine carcinoma) cases, and TCGA project designation. See also Figures S1 and S2 and Tables S1 and S2.
Table 1.
Multiplatform-based genomic subtypes of NSCLC in TCGA cohort.
| Subtype | AD/SQCC | Description | Associated mRNA subtypes | Therapeutic implications |
|---|---|---|---|---|
| SQ.1 | SQCC | high SOX2 (but lower compared to SQ.2a/SQ.2b); CT antigen expression | B, S | immunotherapy (CT) |
| SQ.2a | SQCC | higher SOX2 compared to SQ.1; CT antigen expression; better OS association | C | immunotherapy (CT) |
| SQ.2b | SQCC | higher SOX2 compared to SQ.1; distinct methylation patterns from those of SQ.2a; CT antigen expression; better OS association | C, P | immunotherapy (CT) |
| AD.1 | mixed (32% LUSC) | LCNEC-associated; poor AD differentiation; CT antigen expression | P, PP | platinum-based drugs; immunotherapy (CT) |
| AD.2 | AD | CIMP; high immune cell infiltrates; immune checkpoint pathway activation | PI | immune checkpoint |
| AD.3 | AD | high immune cell infiltrates; CT antigen expression; immune checkpoint pathway activation | PI | immunotherapy (CT); immune checkpoint |
| AD.4 | AD | high immune cell infiltrates; immune checkpoint pathway activation; lower neoepitope count and mutation rate; better OS association | TRU | p38; mTOR; immune checkpoint |
| AD.5a | AD | high proportion of never-smoker/long-term non-smoker patients; lower mutation rate; high p38 and mTOR pathway activation; better OS association | TRU | p38; mTOR |
| AD.5b | AD | CIMP; high proportion of never-smoker/long-term non-smoker patients; lower mutation rate; high p38 and mTOR pathway activation; better OS association | PP, TRU | p38; mTOR |
CIMP, CpG island methylator phenotype; CT, cancer-testis; LCNEC, large cell neuroendocrine carcinoma; OS, overall survival; LUAD, TCGA lung AD project; LUSC, TCGA lung SQCC project. Associated mRNA subtypes (Figures 1d and S2a): C, LUSC classical; P, LUSC primitive; B, LUSC basal; S, LUSC secretory; PP, LUAD proximal proliferative; PI, LUAD proximal inflammatory; TRU, LUAD terminal respiratory unit.
The nine genomic subtypes of TCGA lung cancers included: three different subtypes of predominantly lung SQCC cases—designated here as “SQ.1” (n=259), “SQ.2a” (n=257), and “SQ.2b” (n=123)—and six different subtypes of predominantly lung AD cases—“AD.1” (n=128), “AD.2” (n=128), “AD.3” (n=106), “AD.4” (n=121), “AD.5a” (n=43) and “AD.5b” (n=74). Overall, the genomic subtypes segregated according to TCGA project designation (LUSC versus LUAD), though notably the AD.1 subtype consisted of 32% LUSC cases. Well-established gene expression markers distinguishing lung SQCC from lung AD1—including NKX2-1, KRT7, KRT5, KRT6A, SOX2, and TP63—correlated with the assumed histologic subtype in TCGA cohort (Figure 1b). SQ.2a and SQ.2b showed similar global mRNA expression patterns but distinctive DNA methylation patterns, as was also the case for AD.5a and AD.5b. Interestingly, when examining a set of probes in CpG island promoter regions used previously by TCGA to identify “CIMP” lung AD cases7 (a different set of probes than the ones used in the COCA subtyping), CIMP patterns were found exclusively within the AD.2 and AD.5a subtypes (Figure 1c).
Individual molecular features were informative in distinguishing the NSCLC genomic subtypes from each other (Figure 1d). Copy gain of SOX2 associated with lung SQCC-associated subtypes, but events were more frequent in SQ.2a/SQ.2b tumors compared to SQ.1 tumors, with SOX2 expression also higher in SQ.2a/SQ.2b. Within AD-associated subtypes, KRAS mutations were most frequent in AD.2 and AD.5b, and STK11 mutations were most frequent in AD.1 and AD.5b (Figures 1d and S2a). TP53 mutations coupled with lower expression of associated targets were most frequently observed in SQ.2a, SQ.2b, AD.1, AD.2, and AD.3 subtypes (Figures 1d, S2a, and S2b). Compared to other lung AD subtypes, AD.5a and AD.5b had the highest proportion of patients who were never-smokers or long-term non-smokers (Figures 1d and S2c), as well as the highest proportion of patients with low manifestation of a mutation signature of C>A transversions related to smoking (Figure S2c). Of 14 LUAD cases found by pathology re-review to share histology features with Large Cell Neuroendocrine Cancers (LCNEC), 9 associated with AD.1 subtype, a significant enrichment (p<0.00001, one-sided Fisher’s exact test)(Figures 1d and S2a).
The nine genomic subtypes made across the entire TCGA lung cancer cohort showed high concordance with other subtype designations, previously called for a subset of these cases on the basis of gene expression or multi-platform analysis focusing on either SQCC or AD (Figures 1d and S2a). The LUSC gene expression-based subtypes of basal/secretory, classical, and primitive, showed significant correspondence to our SQ.1, SQ.2a/SQ.2b, and SQ.2b/AD.1 subtypes, respectively. The LUAD gene expression-based subtypes of proximal-proliferative, proximal inflammatory, and terminal respiratory unit, corresponded to our AD.1, AD.2/AD.3, and AD.4/AD.5a/AD.5b subtypes, respectively. In addition, our six AD-associated genomic subtypes each corresponded to one of six integrated subtypes by iCluster13 analysis on 230 LUAD cases7.
Distinctive biology and pathway-level differences represented by NSCLC genomic subtypes
Gene transcription signatures of specific pathways and processes were examined across the genomic subtypes, where each NSCLC profile was scored for the relative degree of manifestation of a given signature (Figure S2b). Cell cycle genes were more highly expressed in SQCC-associated subtypes relative to AD-associated subtypes, with expression lowest in AD.4 and AD.5a/AD.5b. Markers of epithelial-mesenchymal transition (EMT) were highest in SQ.1 and lowest in AD.5a/AD.5b. Gene targets of both SOX2 and p6314 were higher in lung SQCC versus AD, while KRAS signature15 was higher in lung AD versus SQCC. A gene signature of more differentiated versus less differentiated lung AD4 indicated that cellular differentiation was highest in AD.4 and AD5a/AD.5b, intermediate in AD.2 and AD.3, and lowest in AD.1 as well as in SQCC (Figure 1d).
Molecular differences between the NSCLC genomic subtypes would provide clues as to the diverse biology underlying these subtypes. To provide further context to the widespread gene expression differences observed, we examined the top 700 differential mRNAs (Figure 1b) in normal tissues, using a public expression dataset from the Fantom consortium of 889 profiles representing various human cell and tissue specimens16 (Figures 2a and S3a). When examining the top 700 differential mRNAs associated with NSCLC genomic subtypes (from Figure 1b), SQ.1 expression patterns associated with those of normal “squamous” tissues (including epidermis, oral, nasal, pharyngeal, eosophagus, broncial, urothelial, and cervical tissues)(Figures 2b and S3b), all having relatively higher SOX2 and TP63 expression, while both SQ2a/b and AD.1 expression patterns associated with tissues related to the central nervous system (Figure 2b and S3b), which had high expression of SOX2 but not TP63. AD.4 expression patterns associated with those of immune cell types and tissues involved in the immune system. Similar findings were made using the Fantom dataset of 389 cell and tissue profiles from mouse specimens (Figures 2b, S3c, and S3d).
Figure 2. Gene signatures distinguishing NSCLC genomic subtypes are manifested in specific tissue types or pan-cancer subsets.
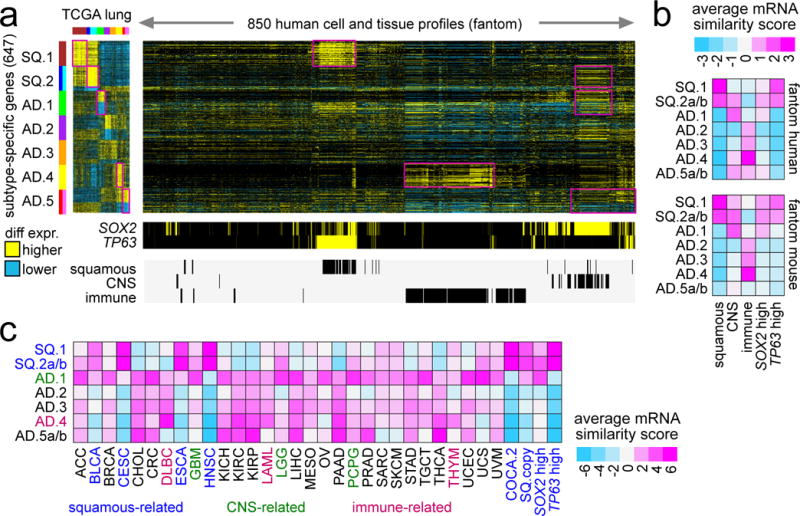
(a) The top set of 700 mRNAs distinguishing between NSCLC genomic subtypes (from Figure 1b) were examined in the Fantom consortium expression dataset of various cell types or tissues from human specimens (n=889 profiles)16. For these 700 mRNAs, the corresponding differential patterns within NSCLC are shown off to the left. Regions sharing similarity with one or more NSCLC subtype-specific signatures are highlighted. Membership of the Fantom profiles in general categories of “immune” (immune cell types or blood or related tissues), “CNS” (related to central nervous system including brain), or “squamous” (including bronchial, trachea, oral regions, throat and esophagus regions, nasal regions, urothelial, cervix, sebocyte, keratin/skin/epidermis) is indicated. (b) Average expression similarity correlation (Pearson’s t-statistic, based on genes in part a; pink, positive or similar; blue, negative or dissimilar) between NSCLC molecular subtypes (rows) and fantom cell types or tissues in selected categories (columns). Results shown for both fantom human and fantom mouse datasets. (c) Average expression similarity correlation (Pearson’s t-statistic, based on genes in part a) between NSCLC molecular subtypes (rows) and non-lung cancer types in TCGA. Cancer type denoted by TCGA project designation (BLCA, bladder; CESC, cervical; DLBC, diffuse large B-cell lymphoma; ESCA, esophageal; GBM, glioblastoma; HNSC, head and neck; LAML, leukemia; LGG, lower grade glioma; PCPG, pheochromocytoma and paraganglioma; THYM, thymoma). COCA.2 and SQ.copy, associated with “squamous” pan-cancer subtype by Hoadley et al.8. See also Figures S3 and S4.
We extended the above approach to the analysis of the full TCGA pan-cancer cohort of over 10,000 expression profiles from 30 different cancer types (Figures S4a and 2c). When comparing the NSCLC expression profiles with those of the other pan-cancer types, we could observe many commonalities shared by specific NSCLC subtypes with other cancer types from different organs. As expected, lung SQCC cancers associated with other cancer types (including head and neck, bladder, cervical, and esophageal cancers) forming part of a multi-tissue squamous molecular subtype8, typified by high expression of both SOX2 and TP63. The AD.1 lung subtype shared similar patterns with many other cancer types, including colorectal, stomach, pancreatic, breast, prostate, liver, brain, testicular, ovarian, and uterine. The AD.4 lung subtype shared similar patterns with thymoma, leukemia, and b-cell lymphoma, as well as with distinct subsets of other cancer types including clear cell renal, breast, and thyroid. The AD.5 lung subtype shared similar patterns with colorectal, stomach, pancreatic, renal, and liver cancer types. Overall, results from the respective Fantom and TCGA pan-cancer expression datasets revealed some common trends, which included AD.1 expression patterns associating with tissues related to the CNS (potentially relating to the LCNECs in this subtype) and AD.4 expression patterns associating with those of immune cell types and tissues involved in the immune system (Figures S4b and S4c).
Based on analysis of protein expression, pathways differentially altered across the genomic subtypes included PI3K/AKT, mTOR, and MAP kinase (Figure S5). The SQCC-associated subtypes had more PTEN gene copy loss and decreased protein levels, while the AD-associated subtypes tended to have more STK11 somatic mutation events, copy loss, and decreased STK11/LKB1 protein levels. Both phospholevels of mTOR and a phosphoprotein signature of the MAP kinase pathway were highest in the AD.4 and AD.5a/AD.5b subtypes, as compared to all other subtypes (Figure 3a). Differences between AD.4/AD.5a/AD.5b subtypes versus AD.1/AD.2 subtypes were also apparent when examining individual key proteins in the context of PI3K/AKT, mTOR, and MAP kinase pathways (Figure 3b). While AD.4/AD.5a/AD.5b cases had relatively higher PTEN levels corresponding with low phospho-AKT, low STK11/LKB1 could presumably account for the higher levels of phospho-mTOR, phospho-S6K, and phospho-S6 observed in AD.4/AD.5a/AD.5b versus SQCC. Interestingly, phosphorylation of 4EBP1 was anti-correlated with that of mTOR across the cancers, suggestive of mTOR-independent 4E-BP1 phosphorylation17 or activation of target specific phosphatases.
Figure 3. Differential activity of PI3K/AKT/MTOR and MAPK pathways across NSCLC genomic subtypes.
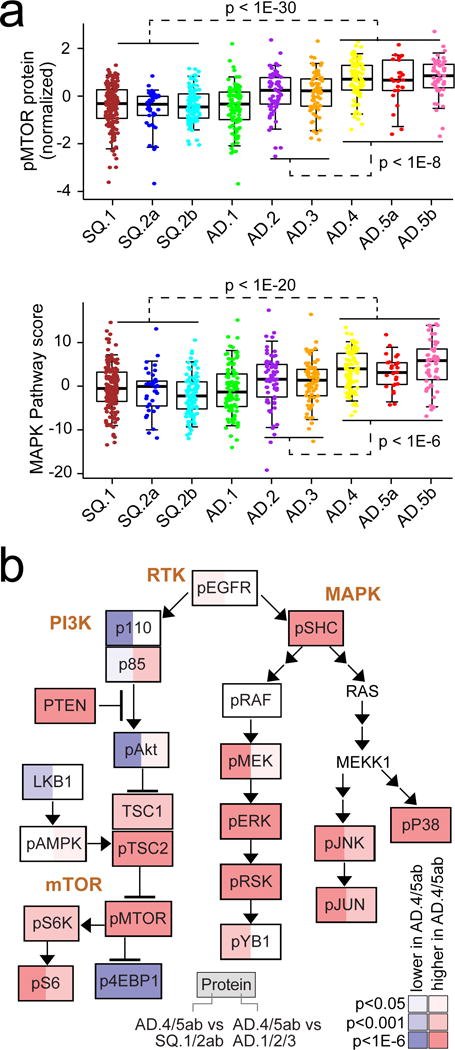
(a) Differential phospho-mTOR (top) and MAP Kinase protein signaling (bottom) among subtypes (by RPPA, average of phospho-SHC or pSHC, pRAF, pMEK, pERK, pSRK, pYB1, pP38, pJNK, and pJUN). P-values for indicated comparisons by t-test on log-transformed data. Box plots represent 5%, 25%, 50%, 75%, and 95%. (b) Diagram of PI3K/AKT/MTOR and MAPK pathways, with differential protein expression patterns represented, comparing tumors in groups AD.4, AD.5a, or AD.5b with tumors in groups SQ.1, SQ.2a, or SQ.2b (red, significantly higher in AD.4/5ab). P-values by t-test on log-transformed data. See also Figure S5.
Differential immune profiles across NSCLC subtypes
Given the above associations between the immune system and the genes most highly expressed in AD.4 NSCLC subtype (which genes were highest in AD.4 but also relatively higher in other subtypes including AD.2 and AD.3), we surveyed the TCGA NSCLC cases for expression of genes involved in immune checkpoint pathways (Figure 4a). Analysis of gene expression signatures10 suggested that levels of immune cell infiltrates were highest in AD.2, AD.3, AD.4, SQ.1, and SQ.2a subtypes. Signatures of T cells in particular were highest in the above NSCLC subtypes while relatively lower in most other pan-cancer types surveyed (Figure 4b). AD.2, AD.3, and AD.4 NSCLC subtypes all had relatively higher expression of several genes representing potential targets for immunotherapy (Figures 4a, 4b, and 4c), including PDCD1 (PD1), CD247 (CD3), CD274 (PDL1), PDCD1LG2 (PDL2), CTLA4 (CD152), TNFRSF9 (CD137), TNFRSF4 (CD134), and TLR9. Lung SQCC-associated subtypes and AD.1 and AD.3 subtypes, on the other hand, had elevated expression of several genes encoding cancer-testis antigens, including CTAG1B (NY-ESO-1), MAGEA4, and SAGE1 (Figures 4a, 4d, and S6a). Interestingly, when considering the numbers of predicted neoepitopes found for each NSCLC case18, AD.4 (which had shown the strongest expression pattern of immune infiltrates, Figure 2a) had the lowest neoepitope count of the subtypes (Figures 4a and S6b), where neoepitope counts across tumors were highly correlated with total mutation rate (Figure S6c, Spearman’s r=0.69).
Figure 4. Immune checkpoint-related differences across NSCLC genomic subtypes.

(a) Heat maps of differential expression, for genes encoding immunotherapeutic targets (top panels) and for gene expression-based signatures of immune cell infiltrates (bottom panels), across TCGA lung cancers, normal adjacent lung samples, kidney clear cell cases (KIRC), melanoma cases (SKCM), and cases from selected other cancer types (THCA, thyroid; BRCA, breast; HNSC, head and neck; PRAD, prostate; CRC, colorectal; BLCA, bladder; OV, ovarian; LIHC, liver; LGG, lower grade glioma; GBM, glioblastoma). TREG cells, regulatory T cells; TGD cells, T gamma delta cells; Tcm cells, T central memory cells; Tem cells, T effector memory cells; Tfh cells, T follicular helper cells; NK cells, natural killer cells; DC, dendritic cells; iDC, immature DCs; aDC, activated DCs; P-DC, plasmacytoid DCs; APM1/APM2, antigen presentation on MHC class I/class II, respectively. Neoepitope count18 per NSCLC sample is also indicated. (b) Differential mRNA expression of T cell-associated signature (left) and immune checkpoint target PDCD1 (PD1, right, normalized values) among the NSCLC genomic subtypes, normal adjacent lung tissue, and non-lung cancer types. Box plot represents 5%, 25%, 50%, 75%, and 95%. P-values for indicated comparisons by t-test. (c) Diagram of immune checkpoint pathway (featuring interactions between T cells and antigen-presenting cells, including tumor cells), with differential expression patterns represented, comparing tumors in groups AD.2, AD.3, or AD.4 with tumors in groups AD.1, AD.5a, or AD.5b (red, significantly higher in AD.2/3/4). P-values by t-test. (d) Diagram of immune checkpoint pathway, comparing tumors in groups AD.2, AD.4, AD.5a, or AD.5b with tumors in groups SQ.1, SQ.2a, or SQ.2b (red, significantly higher in SQ.1/SQ.2a/SQ.2b). P-values by t-test. See also Figure S6.
The genomic subtype associations involving immune checkpoint pathway, as observed in TCGA datasets, were also examined in an external NSCLC patient cohort from MD Anderson Cancer Center, known as the Profiling of Resistance patterns and Oncogenic Signaling Pathways in Evaluation of Cancers of the Thorax (PROSPECT) cohort. Using the gene expression dataset from PROSPECT of 275 NSCLC cases12 (primarily SQCC and AD cases), each PROSPECT tumor profile was classified by genomic subtype as defined by TCGA data (Figure 5a), where the top set of 700 mRNAs distinguishing between our seven COCA subtypes (Figure 1b) was used as the classifier (with both SQ.2a/SQ.2b and AD.5a/AD.5b each being grouped together by virtue of their showing similar global expression patterns). Interestingly, AD.1 cases in PROSPECT were found enriched for LCNEC cases (p=0.001, one-sided Fisher’s exact test), consistent with observations in TCGA cohort. In the PROSPECT cohort, significant survival differences between the TCGA-based COCA subtypes could be observed (Figure 5b, p=0.005, log-rank). In a compendium of expression datasets representing 1403 lung AD cases11, profiles were also classified according to TCGA-based lung AD subtype (Figure S7) with significant differences in patient survival being observed (Figure 5c, p<1E-10); in particular, lung AD subtypes associated with poorer AD differentiation by gene signature (AD.1/AD.2/AD.3, Figure 1d) all showed worse prognosis. Several immune-related markers were examined in the PROSPECT cohort using immunohistochemistry methods (n=153 cases), which could distinguish cancer-specific from lymphocyte-specific expression patterns within their respective tumor compartments. Cancer-derived PDL1, lymphocyte-derived PD1, and markers of T cells including CD3 and CD8 were all elevated in the AD.2/AD.3/AD.4 subtypes relative to the AD.1/AD.5a/AD.5b subtypes (Figure 5d and Figure S8 and Figure S9), consistent with observations in TCGA cohort (Figure 4a). In contrast to TCGA cohort, PROSPECT cohort did not show evidence for high immune cell infiltrates within SQ-associated subtypes (Figures 5d and S9)
Figure 5. Observation of patterns associated with TCGA NSCLC genomic subsets in external NSCLC molecular datasets.
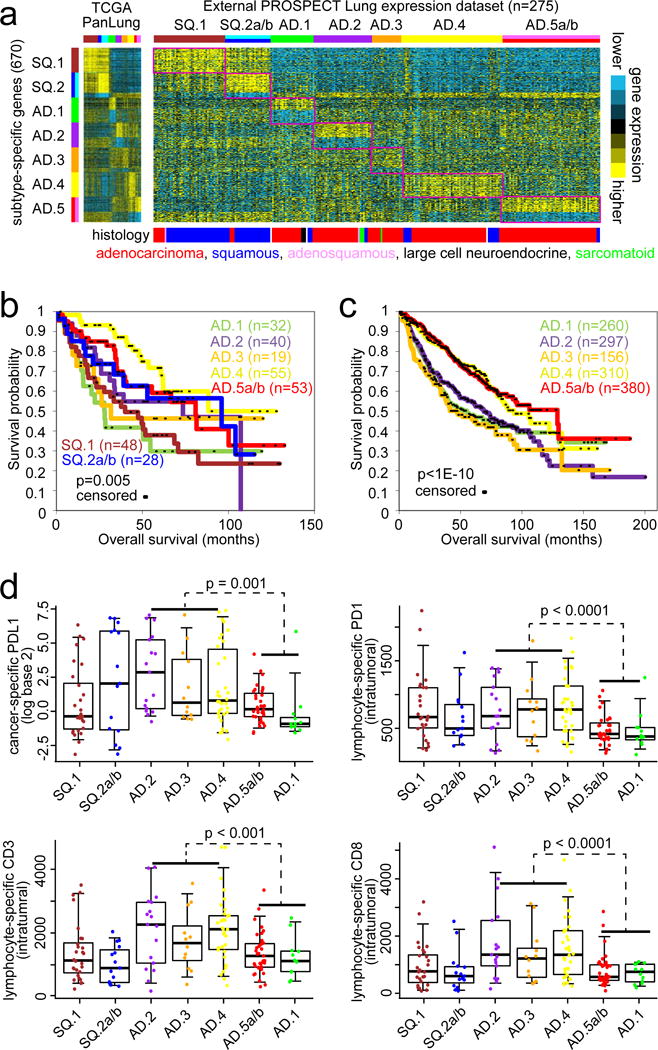
(a) Gene expression profiles in the PROSPECT NSCLC cohort (n=247 cases)12 were classified according to TCGA NSCLC genomic subtype. Expression patterns for the top set of 700 mRNAs distinguishing between the seven COCA-based TCGA NSCLC genomic subtypes (from Figure 1b) are shown for both TCGA and PROSPECT datasets. Regions in the PROSPECT sample profiles sharing similarity with TCGA lung subtype-specific signature pattern are highlighted. (b,c) Associated differences in patient overall survival among TCGA-associated genomic subtypes, in PROSPECT cohort (part b) and in an external “compendium” dataset (part c) of 11 published expression profiling datasets for human lung AD (right, n=1403 cases)11. P-values by Log-rank test. (d) Differential patterns by genomic subtype for several immune-related markers—including cancer-specific PDL1 (top left), lymphocyte-specific and intratumoral PD1 (top right), lymphocyte-specific and intratumoral CD3 (bottom left), and lymphocyte-specific and intratumoral CD8 (bottom right)—were examined in the PROSPECT cohort using immunohistochemistry methods (n=153 cases, 110 AD and 43 SQCC), which could distinguish cancer-specific from lymphocyte-specific expression patterns within their respective tumor compartments. Box plots represent 5%, 25%, 50%, 75%, and 95%. P-values by Mann-Whitney U-test comparing AD.2/AD.3/AD.4 tumors with AD.1/AD.5a/AD.5b tumors. See also Figures S7 and S8 and S9.
DISCUSSION
Using an extended data set, including samples not present in the initial TCGA marker studies, we identified nine major genomic subtypes of NSCLC present in TCGA cohort, including the following: three subtypes (SQ.1, SQ.2a, SQ.2b) associated with lung SQCC, two of which showed relatively higher SOX2 copy gain and expression; one subtype (AD.1) of predominantly AD cases sharing molecular features with neuroendocrine tumors and neuronal-related tissues; two AD-associated subtypes (AD.2, AD.5b) manifesting a CIMP phenotype by DNA methylation; one AD-associated subtype characterized by the highest expression of genes associated with immune cell infiltrates. Three of the six AD-associated subtypes (AD.4, AD.5a, AD.5b) were further characterized by patterns of higher differentiation, better patient survival, and increased p38 and mTOR signaling. Three AD-associated subtypes (AD.2, AD.3, AD.4) expressed several immune checkpoint genes commonly associated with tumor cells or interacting T cells, including PD1, PDL1, PDL2, CD3, and CTLA4. Expression of numerous cancer-testis antigen genes, also relevant to immune response pathway, was observed in five of the nine subtypes (SQ.1, SQ.2a, SQ.2b, AD.1, AD.3).
From the above, particularly notable findings by our study would include the following: (1) the AD.1 subtype, of mixed histologies, that shares molecular features with neuroendocrine tumors; (2) protein activation of p38/MAPK and mTOR pathways within a subset of lung AD as compared to other AD and SQCC; (3) molecular signatures of immune cells being manifested within specific subtypes of NSCLC (which patterns have associations differing from those of overall mutation load or neoepitope count); (4) differences between molecular subtypes in terms of the expression of cancer-testis antigens versus PDL1 pathway members. Regarding the AD.1 subtype, which includes large-cell neuroendocrine tumors that are known to have a poor prognosis and respond to platinum-based drugs similar to those used for small cell lung cancer19, molecular classification could potentially be used to identify AD.1 subtype tumors for directing optimal treatment, particularly as they appear to represent an “immune ignorant” group unlikely to respond to immune checkpoint inhibitors.
Importantly, key patterns distinguishing the NSCLC genomic subtypes, as first observed in TCGA data, were confirmed using data from the independent PROSPECT NSCLC cohort. In particular, subtype associations for several immune-related markers—including PD1, PDL1, CD3, and CD8—were validated in the PROSPECT cohort using immunohistochemistry. The immune checkpoint pathway has been shown to play a crucial role in mediating immune tolerance in NSCLC, with blocking antibody agents against this pathway (e.g. agents against PD1/PDL1) producing durable responses20, and where expression of checkpoint markers correlates with treatment efficacy21. Alternative markers for checkpoint blockade response—including T-cell immunohistochemistry, other immunologic markers, T-cell receptor clonality, and somatic mutational burden—are also being considered22, though notably our AD.4 subtype showed evidence of immune checkpoint pathway activation but with lower mutation burden. Numerous cancer testis antigens, expressed in some NSCLC subtypes not expressing immune checkpoint genes, also represent potential therapeutic targets as well as early diagnostic tools23. The p38/MAP Kinase and PI3K/AKT/mTOR oncogenic pathways represent another therapeutic target in NSCLC; as the two pathways are tightly interconnected, showing higher activation in the same NSCLC disease subsets, targeting both pathways with combinations of signaling inhibitors might result in a more efficient anti-tumor effect over the use of single pathway inhibitors24. Taken together, our results would suggest that distinct subsets of NSCLC as defined using genomics may show better responses to specific targeted therapies (Table 1).
In this study, we find high concordance between the molecular-based view and the histology-based view of NSCLC, though the former encompasses biology as well as histology. The genomic-based NSCLC subtypes reflect the influence of cell of origin, somatic alterations, and microenvironment in the molecular profile of a cancer. While genomic alterations represent one approach to annotating molecular subtypes in terms of altered cancer pathways6–8, analysis of external molecular datasets from systems orthogonal to NSCLC, as carried out in our study using Fantom normal tissue and TCGA pan-cancer data (Figure 2), may provide additional insights as the data are examined in the context of NSCLC. Notably, gene mutation information alone may be insufficient to predict pathway-level alterations and microenvironmental influences as identified through integrated molecular analysis. While direct use of DNA sequencing to detect actionable mutations (e.g ALK, EGFR) will remain an avenue for personalized medicine, future work could evaluate individual markers (Table S2) of our NSCLC subtypes, which could provide additional information in the clinical setting from the standpoint of prognosis, prediction of therapy responses, and targets for therapy. The entire TCGA NSCLC dataset as presented here, now with more extensive molecular annotation of the cases from the various data platforms involved (Table S1), will continue to serve as a resource for future studies to better understand the molecular basis of NSCLC subtypes.
Supplementary Material
Acknowledgments
This work was supported in part by the following grants from the National Institutes of Health (NIH) grant 2R01CA125123-09 (C. Creighton), MD Anderson’s Institutional Tissue Bank Award (2P30CA016672, I. Wistuba), and The University of Texas Lung Specialized Programs of Research Excellence grant (P50CA70907, I. Wistuba), Cancer Prevention and Research Institute of Texas (CPRIT) grant RP120713 C2 (C. Creighton) and P2 (D. Gibbons), and RP150405 (D. Gibbons), and Department of Defense PROSPECT grant (W81XWH-07-1-0306, I. Wistuba).
Abbreviations
- SQCC
squamous cell carcinoma
- AD
adenocarcinoma
- TCGA
The Cancer Genome Atlas
- RNA-seq
RNA sequencing
- RPPA
reverse-phase protein arrays
Footnotes
Competing Financial Interests statement: The authors have no competing interests.
References
- 1.Chen Z, Fillmore C, Hammerman P, Kim C, Wong K. Non-small-cell lung cancers: a heterogeneous set of diseases. Nat Rev Cancer. 2014;14:535–546. doi: 10.1038/nrc3775. [DOI] [PMC free article] [PubMed] [Google Scholar]
- 2.Thomas A, Liu S, Subramaniam D, Giaccone G. Refining the treatment of NSCLC according to histological and molecular subtypes. Nat Rev Clin Oncol. 2015;12:511–526. doi: 10.1038/nrclinonc.2015.90. [DOI] [PubMed] [Google Scholar]
- 3.Garber M, Troyanskaya O, Schluens K, Petersen S, Thaesler Z, Pacyna-Gengelbach M, et al. Diversity of gene expression in adenocarcinoma of the lung. Proc Natl Acad Sci U S A. 2001;98:13784–13789. doi: 10.1073/pnas.241500798. [DOI] [PMC free article] [PubMed] [Google Scholar]
- 4.Beer DG, Kardia SL, Huang CC, Giordano TJ, Levin AM, Misek DE, et al. Gene-expression profiles predict survival of patients with lung adenocarcinoma. Nat Med. 2002;8:816–824. doi: 10.1038/nm733. [DOI] [PubMed] [Google Scholar]
- 5.Wilkerson M, Yin X, Hoadley K, Liu Y, Hayward M, Cabanski C, et al. Lung squamous cell carcinoma mRNA expression subtypes are reproducible, clinically important, and correspond to normal cell types. Clin Cancer Res. 2010;16:4864–4875. doi: 10.1158/1078-0432.CCR-10-0199. [DOI] [PMC free article] [PubMed] [Google Scholar]
- 6.Cancer_Genome_Atlas_Research_Network. Comprehensive genomic characterization of squamous cell lung cancers. Nature. 2012;489:519–525. doi: 10.1038/nature11404. [DOI] [PMC free article] [PubMed] [Google Scholar]
- 7.Cancer_Genome_Atlas_Research_Network. Comprehensive molecular profiling of lung adenocarcinoma. Nature. 2014;511:543–550. doi: 10.1038/nature13385. [DOI] [PMC free article] [PubMed] [Google Scholar]
- 8.Hoadley K, Yau C, Wolf D, Cherniack A, Tamborero D, Ng S, et al. Multiplatform Analysis of 12 Cancer Types Reveals Molecular Classification within and across Tissues of Origin. Cell. 2014;158:929–944. doi: 10.1016/j.cell.2014.06.049. [DOI] [PMC free article] [PubMed] [Google Scholar]
- 9.Chen F, Zhang Y, Çenbabaoǧlu Y, Ciriello G, Yang L, Reznik E, et al. Multilevel Genomics-Based Taxonomy of Renal Cell Carcinoma. Cell Rep. 2016;14:2476–2489. doi: 10.1016/j.celrep.2016.02.024. [DOI] [PMC free article] [PubMed] [Google Scholar]
- 10.Bindea G, Mlecnik B, Tosolini M, Kirilovsky A, Waldner M, Obenauf A, et al. Spatiotemporal dynamics of intratumoral immune cells reveal the immune landscape in human cancer. Immunity. 2013;39:782–795. doi: 10.1016/j.immuni.2013.10.003. [DOI] [PubMed] [Google Scholar]
- 11.Creighton C, Gibbons D, Kurie J. The role of epithelial-mesenchymal transition programming in invasion and metastasis: a clinical perspective. Cancer Manag Res. 2013;5 doi: 10.2147/CMAR.S35171. [DOI] [PMC free article] [PubMed] [Google Scholar]
- 12.Sato M, Larsen J, Lee W, Sun H, Shames D, Dalvi M, et al. Human lung epithelial cells progressed to malignancy through specific oncogenic manipulations. Mol Cancer Res. 2013;11:638–650. doi: 10.1158/1541-7786.MCR-12-0634-T. [DOI] [PMC free article] [PubMed] [Google Scholar]
- 13.Mo Q, Wang S, Seshan V, Olshen A, Schultz N, Sander C, et al. Pattern discovery and cancer gene identification in integrated cancer genomic data. Proc Natl Acad Sci U S A. 2013;110:4245–4250. doi: 10.1073/pnas.1208949110. [DOI] [PMC free article] [PubMed] [Google Scholar]
- 14.Watanabe H, Ma Q, Peng S, Adelmant G, Swain D, Song W, et al. SOX2 and p63 colocalize at genetic loci in squamous cell carcinomas. J Clin Invest. 2014;124:1636–1645. doi: 10.1172/JCI71545. [DOI] [PMC free article] [PubMed] [Google Scholar]
- 15.Singh A, Greninger P, Rhodes D, Koopman L, Violette S, Bardeesy N, et al. A gene expression signature associated with “K-Ras addiction” reveals regulators of EMT and tumor cell survival. Cancer Cell. 2009;15:489–500. doi: 10.1016/j.ccr.2009.03.022. [DOI] [PMC free article] [PubMed] [Google Scholar]
- 16.FANTOM_Consortium_and_the_RIKEN_PMI_and_CLST_(DGT) Forrest A, Kawaji H, Rehli M, Baillie J, de Hoon M, et al. A promoter-level mammalian expression atlas. Nature. 2014;507:462–470. doi: 10.1038/nature13182. [DOI] [PMC free article] [PubMed] [Google Scholar]
- 17.Zhang Y, Zheng X. mTOR-independent 4E-BP1 phosphorylation is associated with cancer resistance to mTOR kinase inhibitors. Cell Cycle. 2012;11:594–603. doi: 10.4161/cc.11.3.19096. [DOI] [PMC free article] [PubMed] [Google Scholar]
- 18.Campbell J, Alexandrov A, Kim J, Wala J, Berger A, Pedamallu C, et al. Distinct patterns of somatic genome alterations in lung adenocarcinomas and squamous cell carcinomas. Nat Genet. 2016 doi: 10.1038/ng.3564. E-pub May 9. [DOI] [PMC free article] [PubMed] [Google Scholar]
- 19.Iyoda A, Makino T, Koezuka S, Otsuka H, Hata Y. Treatment options for patients with large cell neuroendocrine carcinoma of the lung. Gen Thorac Cardiovasc Surg. 2014;62:351–356. doi: 10.1007/s11748-014-0379-9. [DOI] [PMC free article] [PubMed] [Google Scholar]
- 20.Lou Y, Diao L, Parra Cuentas E, Denning W, Chen L, Fan Y, et al. Epithelial-mesenchymal transition is associated with a distinct tumor microenvironment including elevation of inflammatory signals and multiple immune checkpoints in lung adenocarcinoma. Clin Cancer Res. 2016 doi: 10.1158/1078-0432.CCR-15-1434. E-pub Feb 5. [DOI] [PMC free article] [PubMed] [Google Scholar]
- 21.Garon E, Rizvi N, Hui R, Leighl N, Balmanoukian A, Eder J, et al. Pembrolizumab for the treatment of non-small-cell lung cancer. N Engl J Med. 2015;372:2018–2028. doi: 10.1056/NEJMoa1501824. [DOI] [PubMed] [Google Scholar]
- 22.Chae Y, Pan A, Davis A, Raparia K, Mohindra N, Matsangou M, et al. Biomarkers for PD-1/PD-L1 Blockade Therapy in Non-Small-cell Lung Cancer: Is PD-L1 Expression a Good Marker for Patient Selection? Clin Lung Cancer. 2016 doi: 10.1016/j.cllc.2016.03.011. E-pub Apr 6. [DOI] [PubMed] [Google Scholar]
- 23.Chiriva-Internati M, Pandey A, Saba R, Kim M, Saadeh C, Lukman T, et al. Cancer testis antigens: a novel target in lung cancer. Int Rev Immunol. 2012;31:321–343. doi: 10.3109/08830185.2012.723512. [DOI] [PubMed] [Google Scholar]
- 24.Ciuffreda L, Incani U, Steelman L, Abrams S, Falcone I, Curatolo A, et al. Signaling intermediates (MAPK and PI3K) as therapeutic targets in NSCLC. Curr Pharm Des. 2014;20:3944–3957. doi: 10.2174/13816128113196660763. [DOI] [PubMed] [Google Scholar]
- 25.Aran D, Sirota M, Butte A. Systematic pan-cancer analysis of tumour purity. Nat Commun. 2015;6:8971. doi: 10.1038/ncomms9971. [DOI] [PMC free article] [PubMed] [Google Scholar]
Associated Data
This section collects any data citations, data availability statements, or supplementary materials included in this article.