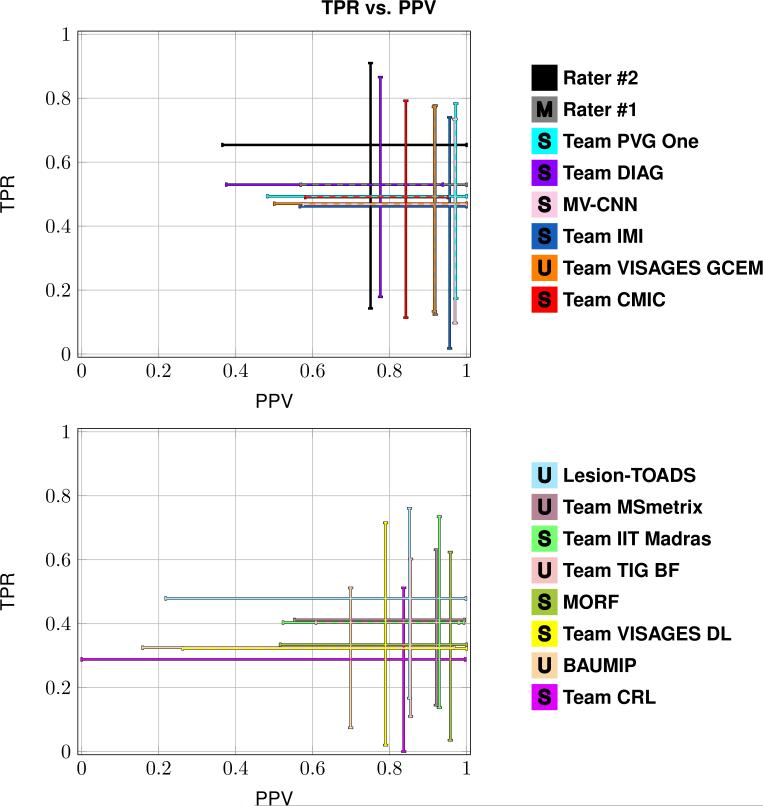
Figure 5.
Each subplot shows the range of values for the true positive rate (TPR) and the positive predictive value (PPV) between eight of the Segmentations and the Consensus Delineation. The top plot shows the top eight Segmentations as ranked by the Dice overlap, and the bottom plot shows the remaining eight Segmentations. The desirable point on each of the subplots is the upper right hand corner, where TPR is 1 and PPV is 1.

