Abstract
A paradox in bone tissue is that tissue-level strains due to animal and human locomotion are too small to initiate intracellular chemical responses directly. A model recently was proposed to resolve this paradox, which predicts that the fluid flow through the pericellular matrix in the lacunar-canalicular porosity due to mechanical loading can induce strains in the actin filament bundles of the cytoskeleton that are more than an order of magnitude larger than tissue level strains. In this study, we greatly refine this model by using the latest ultrastructural data for the cell process cytoskeleton, the tethering elements that attach the process to the canalicular wall and their finite flexural rigidity EI. We construct a much more realistic 3D model for the osteocyte process and then use large-deformation “elastica” theory for finite EI to predict the deformed shape of the tethering elements and the hoop strain on the central actin bundle. Our model predicts a cell process that is 3 times stiffer than in a previous study but hoop strain of >0.5% for tissue-level strains of >1,000 microstrain at 1 Hz and >250 microstrain at frequencies >10 Hz. We propose that this strain-amplification model provides a more likely hypothesis for the excitation of osteocytes than the previously proposed fluid-shear hypothesis.
Keywords: actin filament bundle, bone mechanotransduction, osteocyte process, strain amplification
A fundamental paradox in bone tissue is that tissue-level strains in whole bone due to animal and human locomotion are typically <0.2% (1, 2), yet an extensive range of in vitro experiments in bone (3–5) and other tissue cultures (6, 7) show that dynamic substrate strains must be at least an order of magnitude larger for intracellular biochemical responses to occur. Such large whole-tissue strains in vivo would cause bone fracture. You et al. (8) recently proposed a new hypothesis and exploratory quantitative cellular-level model that predicts that the fluid flow through the pericellular matrix in the lacunar-canalicular porosity due to small whole-tissue deformations can induce cellular-level strains in the actin filament bundles of the cell processes, which are 1–2 orders of magnitude larger than whole-tissue strains and sufficient to initiate intracellular signaling. This model was intended to demonstrate the quantitative feasibility of the basic hypothesis and not realistically simulate the strain-amplification mechanism, because there was only fragmentary and sometimes contradictory evidence with regard to the key structural components of osteocytes that would be necessary for the model to work in vivo. In addition, there was no information on the most important mechanical properties in the system, i.e., the flexural rigidity EI of the transverse filaments in the pericellular space and the sieving characteristics of the pericellular matrix. You et al. (8) treat these filaments as inextensible strings with no flexural rigidity.
The four basic structural components in the model are as follows: (i) transverse filaments in the pericellular matrix that anchor and center the osteocyte process within its canaliculus; (ii) an organic matrix attached to the transverse filaments that fills the entire pericellular space surrounding the osteocyte and its cell processes and that would exert a flow-induced drag force on the transverse filaments; (iii) a cytoskeletal structure within the cell processes to resist hoop tensions and bending deformation; and (iv) transmembrane proteins and other linker molecules that transmit the flow-induced tension in the transverse filaments to the actin cytoskeleton in the cell process.
The recent ultrastructural study by You et al. (9) provided the first detailed information on these structural components in and around osteocytes in adult bone. In particular, the study unequivocally demonstrated the existence of the transverse tethering filaments in the pericellular space and the first measurements of their spacing and distribution. The study also elucidated for the first time in bone tissue the spacing and arrangement of the actin filaments in the cross section of the cell process. Morphologically, this central actin filament bundle is very similar in appearance to the bundle that has been studied extensively in the brush-border microvilli of the small intestine (10, 11). The cell process consists of 15–20 central axial actin filaments, surrounded by a 25-nm annulus in which there is presumably a filament–membrane complex through which the central filament bundle is attached to membrane proteins that link the cytoskeleton to the extracellular matrix. The immunocytochemical studies of Tanaka-Kamioka et al. (12) on isolated embryonic chick clavaria show a nearly uniform labeling of the cell process by fimbrin, a cross-linking molecule that is known to cross-link actin filaments with parallel polarity (13). There also was localized labeling of α-actinin, but that primarily was associated with stress fibers in the cell body that have an antiparallel polarity.
The close similarity between the three-dimensional cytoskeletal organization of the osteocyte cell process and intestinal microvilli was not realized when the model in You et al. (8) was published. The slender cell processes are an order of magnitude longer in osteocytes than intestinal microvilli, and the studies of Tanaka-Kamioka et al. (12) considered only planar arrangements of cells where the osteocyte processes were observed primarily en face in field-emission scanning electron microscopy rather than in cross section. Subsequently, Weinbaum et al. (14) presented a comparative study of possible mechanotransduction mechanisms in renal and intestinal microvilli, stereocilia in the ear, and bone cell processes. The fundamental difference is that in the first three cell types with actin-rich projections, hydrodynamic loading causes a bending along the long axis of the cellular projections, whereas in bone cells the strain-amplification hypothesis in You et al. (8) assumes it occurs through a hoop tension that is generated in the cross section of the process because the processes are encased in nearly rigid tubes with minimal bending deformation.
Important new information also was obtained recently concerning the sieving properties of the pericellular matrix and, hence, the spacing of the glycosaminoglycan (GAG) side chains of the proteoglycans in the pericellular space. Both Wang et al. (15) and Knothe Tate (16) have found that the sieve lies somewhere between horseradish peroxidase, 6 nm in diameter, and ferritin, 10 nm in diameter. The cutoff in size appears to lie very close to 7 nm, the molecular sieve size for albumin in the endothelial glycocalyx of capillaries (17–19). This spacing is a key input in determining the hydrodynamic drag on the tethering filaments. Finally, model calculations for the flexural rigidity of the core proteins of proteoglycans, the structural component believed to represent the transverse filaments, predict an EI value of 700 pN·nm2 (20).
The foregoing advances have set the stage for a much more realistic, ultrastructurally based model for strain amplification in bone. In this study, we first develop a three-dimensional model for the osteocyte process with a 19-element actin filament bundle whose organization is modeled after the fimbrin cross-linked hexagonal structure observed in stereocilia (21) and microvilli (13). To our knowledge, the force distribution in hexagonally packed actin filament bundles with helically arranged fimbrin cross-bridges has not been analyzed previously. We then apply large-amplitude deformation theory for “elastica” to predict how the hoop strains in the osteocyte process vary as a function of the transverse element flexural rigidity, EI, and the tissue loading and frequency. We find that the value of EI has a subtle influence on the hoop tension that is transmitted to the core bundle of the cell process. We also propose that the present theory for cellular-level strain amplification provides a more likely hypothesis for the excitation of osteocytes than the fluid-shear hypothesis previously proposed (22).
Methods
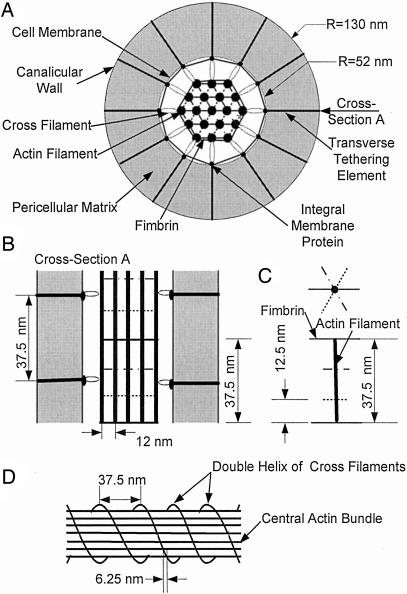
Structural Model. Fig. 1 shows sketches of our idealized model for the internal structure of the osteocyte process and its attachment to the canalicular wall by the transverse elements as seen in both radial (Fig. 1 A) and longitudinal (Fig. 1B) cross sections. The central filament bundle inside the cell process is a hexagonal array of 19 actin filaments (9), which are attached to unknown integral membrane proteins (8, 9) in the cell process membrane by cross-filaments equivalent to brush border myosin-I in intestinal microvilli (11). Adjacent actin filaments with 12-nm spacing are cross-linked periodically by fimbrin in a hexagonal pattern. Along each actin filament, the fimbrin cross-links rotate 60° counterclockwise and advance 12.5 nm axially in successive cross-linking positions as proposed in refs. 13 and 21 (Fig. 1C). The cross-filaments surrounding the core bundle spiral in a double-helical coil around the core bundle with 37.5-nm spacing between each coil (Fig. 1D), which is similar to the spacing observed for brush border myosin I in intestinal microvilli (11). Because there are 12 actin filaments in the outermost ring, each coil advances 6.25 nm between successive outer actin filaments (75 nm in a single rotation). The transverse elements attach the osteocyte process to the canalicular wall and center it in the canaliculus. The integral membrane proteins are the sites where individual cross-filaments are connected with each transverse element (9). This observation implies that the transverse elements also are arranged in a double helix with 37.5-nm spacing along the axial direction of the canaliculus. Note that this spacing is consistent with the measured value of 38 nm in ref. 9. The transverse elements with their GAG side chains fill the annular space between the cell membrane and the canalicular wall. These side chains are assumed to have a 7-nm spacing (8, 15, 16) and thus form a molecular sieve that prevents the loss of albumin (7-nm diameter) to the bone tissue space. The radii of the osteocyte process and canaliculus are 52 and 130 nm, respectively (9).
Fig. 1.
Sketches (not to scale) of the osteocyte process and its attachment to the canalicular wall that show the structure of the central hexagonally packed actin filament bundle and the arrangement of the fimbrin cross-bridges, cross-filaments, and transverse elements. (A) Radial cross section. (B) Longitudinal cross section (cross section A). (C) Organization of fimbrin cross-linkages along an interior actin filament. (D) Spiraling double-helical coil of cross-filaments around the central actin bundle.
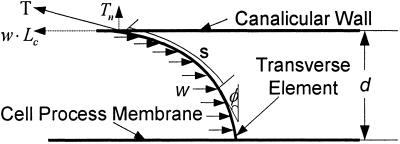
Mathematical Model for the Deformed Transverse Elements. In You et al. (8), a simplified model is developed for the deformation of the transverse filaments that tether the cell process to the canalicular wall. The hydrodynamic loading on these tethering elements is produced by the fluid flow through the GAG-filled annular space surrounding the cell process, as shown in Fig. 2. The GAG side chains are attached to the tethering filaments, and the drag on these side chains is transmitted to the filament, much like the wind blowing through the needles on a pine tree. In ref. 8, the deformed shape of the tethering filaments is easy to determine because the loading per unit length of tethering filament, w, is uniform, and they are treated as inextensible strings with EI = 0. For these assumptions the deformed shape is a simple catenary, the same as a hanging chain with uniform loading in a gravitational field.
Fig. 2.
Model of the deflection of each transverse element due to the hydrodynamic loading w.
In the present model, a more elaborate theory is required to determine the deformed shape of the tethering filament because its finite flexural rigidity is considered. Furthermore, large-deformation theory is required because relatively small radial displacements of the ends of tethering filaments at the cell-process membrane can lead to large horizontal deflections of the filaments. We, therefore, use large-amplitude deformation theory for elastica (23) to determine the deformed shape of the tethering filaments due to the hydrodynamic loading. The one simplification that can be retained is that the hydrodynamic loading w is still uniform. The hydrodynamic theory (22) shows that the velocity profile in the pericellular matrix is nearly uniform except for very thin side-wall fiber interaction layers at the canalicular wall and process membrane whose thickness is less than the GAG spacing (7 nm). These thin layers can be neglected. The governing equation from elastica theory for the shape of the tethering element in Fig. 2 is given by
 |
[1] |
Here, Lc is the length of an individual transverse element; Tn is the normal component of the tensile force at the canalicular wall, T, and w·Lc is its horizontal component; and EI is the flexural rigidity of the core proteins. Note that the deflection of the transverse elements will cause the spacing, d, between the cell membrane and the canaliculus wall to decrease. d is given by
 |
[2] |
where we assume, as in ref. 8, that the tethering filaments are inextensible.
The key unknown in Eq. 1 is the hydrodynamic loading w on the transverse filament. This loading is determined from the hydrodynamic model presented in ref. 22 for the fluid flow in the fiber-filled fluid annulus surrounding the cell process and the theoretical model in ref. 24 for the interstitial pressure distribution in the lacunar-canalicular porosity of an osteon. By using this combined theoretical model, You et al. (8) were able to able to determine the drag force FD on the transverse elements per unit length of the cell process. This model for calculating FD is provided in Appendix A, which is published as supporting information on the PNAS web site. The expression for FD is a function of the lacunar-canalicular geometry and its Darcy permeability, KP, the osteonal geometry, and the amplitude and frequency of the mechanical loading. The final expression for w is given by
 |
[3] |
Note that there are 12 individual transverse elements in a periodic unit of length Lf = 37.5 nm along the axis of an individual cell process.
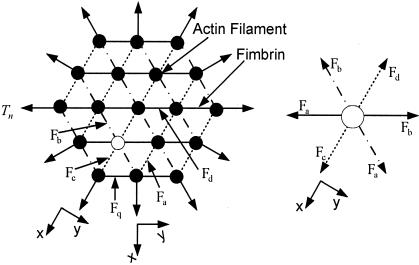
Mathematical Model for the Strain on the Osteocyte Process. To our knowledge, the loading distribution within a hexagonally packed actin filament bundle with fimbrin cross-bridges has not been analyzed previously, although its geometrical organization has been studied extensively. In ref. 8, a much simpler radially symmetric actin filament arrangement is assumed with alternating cross-bridges between adjacent actin filaments, which lie in planes that pass through the axis of the central filament, and there is no hexagonal organization of either the actin filaments or the fimbrin cross-bridges. In the present model illustrated in Fig. 3, the fimbrin cross-links inside the bundle are subject to five different tensile forces, Fa, Fb, Fc, Fd, and Fq, because of structural symmetry. The principal difficulty is that these forces do not act in the same cross-sectional plane because of the 60°, 12.5-nm axially advancing rotation of the fimbrin cross-links. This difference in the plane of action is distinguished by the dotted, dashed-dotted, and solid lines in Fig. 3.
Fig. 3.
Static-force analysis on the central actin filament bundle of the cell process. (Left) Axial cross section of the entire bundle. (Right) Enlarged view of the loading on a single interior filament (open circle in A).
A force balance on the actin filament shown as an open circle in Fig. 3 Left and shown enlarged in the force diagram in Fig. 3 Right, in direction x requires that
 |
[4] |
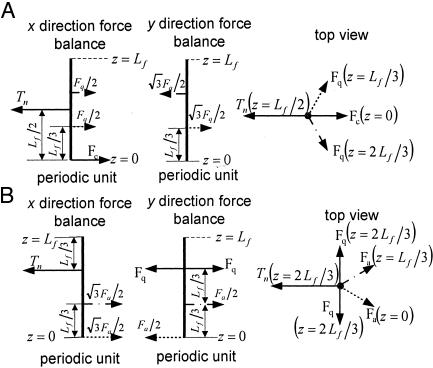
However, Fc = Fd if we assume that the fimbrin cross-bridges are inextensible and that these two forces are both opposite and act in the same cross-sectional plane. Therefore, from Eq. 4 Fa = Fb. Hence, the actin filaments in the interior of the bundle are not deflected because three pairs of equal but opposite forces act on them. This conclusion is true, even if new layers of actin filaments are added to the bundle. In contrast, the actin filaments in the outer ring in Fig. 3 are asymmetrically loaded and have different loading depending on whether they are in a corner or central position in the outer ring. Fig. 4 shows the static-force analysis on the outermost actin filaments at both corner and central positions (see also Fig. 3). In Fig. 4, Tn is the tensile force exerted by the cross-filaments on the actin filament bundle, and Fa, Fc, and Fq are tensile forces exerted by the fimbrin cross-links. The force balances in Fig. 4 are used to obtain the maximum deflection of actin filaments in the x direction by using classic small-deflection theory for uniform beams (25). The actin filament in Fig. 4A is treated as a beam with fixed ends because of its symmetric periodic loading, whereas the actin filament in Fig. 4B is treated as a simply supported continuous beam that is asymmetrically loaded. The details of these models can be found in Appendix B and Figs. 8–12, which are published as supporting information on the PNAS web site. For the actin filament at the outer corner in Fig. 4A, the maximum deflection in the x direction δm1 is given by
 |
[5] |
where qr = Fq/Tn and EIa is the flexural rigidity of the actin filament. For the actin filament at the central position of the outer ring in Fig. 4B, one finds that the maximum deflection in the x direction is
 |
[6] |
In Eq. 5, one also has to consider the lateral deflections of the actin filaments based on the force balance in the y direction shown in Fig. 4A to obtain a relation between qr and Tn. The details of this more elaborate analysis are provided in Appendix B. The force balance in the y direction in Fig. 4B is not required because the sum of forces in this direction are equal and opposite and, thus, cancel. Comparing Eqs. 5 and 6, one observes that the overall maximum deflection of the outer actin filaments is given by Eq. 6 because qr > 0.6 in the relevant range (Fig. 12), and δm2 > δm1. If the cross-filaments are inextensible, the maximum hoop strain is given by
 |
[7] |
where R0 is the original radius of the cell process and d0 is the undeformed spacing between the cell process and the canalicular wall. Combining Eqs. 1, 2, 6, and 7, we obtain the expression for the hoop strain in the cell process, εc, as a function of the hydrodynamic loading, w. From this expression, εc is also a function of tissue loading because the hydrodynamic loading, w, is related to tissue loading (Eq. 2 and Appendix A).
Fig. 4.
Loading of outer filament ring. (A) Force balance on the actin filament at the corner of outer filament ring (see Fig. 3) of the bundle. (B) Force analysis on the actin filament at the middle of outer filament ring (see Fig. 3) of the bundle.
Parameter Values. The values of the parameters used in the model, which were grouped as parameters for the hydrodynamic model, parameters for the canaliculus and cell process, and parameters for the central actin filament bundle, are shown in Table 1.
Table 1. Values of the parameters used in the models.
| Parameter | Value |
|---|---|
| Osteonal hydrodynamic model* | |
| B, dimensionless relative compressibility of bone matrix to water | 0.53 |
| c, pore fluid pressure diffusion constant of the Biot theory | 0.13 mm2/s |
| ro, radius of the osteon | 100 μm |
| r1, radius of the osteonal lumen | 27 μm |
| Canaliculus and cell process† | |
| R1, radius of the canaliculus | 130 nm |
| R0, radius of the osteocyte process | 52 nm |
| Kp, Darcy's permeability of matrix between cell process and canalicular wall | 10.3 nm2 |
| μ, fluid viscosity | 10-2 dyn/cm2 |
| Lc, length of individual transverse element | 88 nm |
| El, bending rigidity of transverse element | 700 pN-nm2 |
| Central actin bundle‡ | |
| Lf, length of periodic fimbrin crossover along actin filament | 37.5 nm |
| Ela, bending rigidity of actin filaments | 1.5 × 10⁴ pN-nm2 |
Results
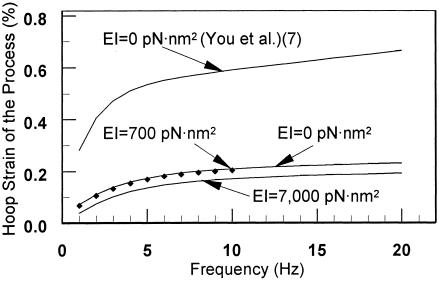
In Fig. 5, we plot the hoop strain of the osteocyte process as a function of loading frequency for a tissue loading σ of 1 MPa. First, our model for the actin bundle is more rigid than the model in ref. 8. The hoop strains are roughly a factor of 3 smaller for the same loading. Second, there is no observable difference between the predictions of the string model, EI = 0, of the transverse element as in ref. 8 and the predictions of the elastica model for EI = 700 pN·nm2, for a tissue loading σ of 1 MPa. However, there is a substantial effect when EI is 1 order of magnitude larger or for very small tissue strains, as we show in Fig. 7.
Fig. 5.
The hoop strain of the osteocyte process as a function of loading frequency for tissue loading σ of 1 MPa.
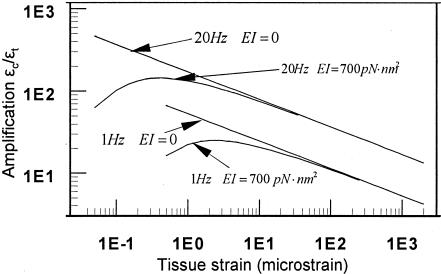
Fig. 7.
Strain amplification ratio, the ratio of cellular-level cytoskeletal hoop strain εc to whole-tissue strain εt as a function of whole-tissue strain at two frequencies, 1 and 20 Hz, for EI = 0 and EI = 700 pN·nm2 (20).
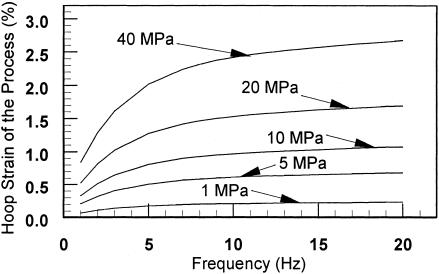
Fig. 6 shows the hoop strains of the osteocyte process as a function of loading frequency with tissue loading as a parameter. In this figure, we also model the transverse element as an inextensible string, as in ref. 8, because the flexural rigidity EI has a negligible effect on the hoop strains for loadings of >1 MPa (50 microstrain), as shown in Fig. 5. One observes that a tissue loading of >20 MPa (a tissue strain of 1,000 microstrain) will stimulate a hoop strain of >0.5% for all loading frequencies of >1 Hz. Experiments show this is the minimum dynamic substrate strain required to stimulate a cellular response in cultured bone cells (3–5). One of the most interesting predictions of this previously undescribed theory is shown in Fig. 7. We show that tissue strains can be amplified by 10- to 100-fold or more in the physiological loading range (1–20 Hz) and that, in contrast to the earlier theory in ref. 8, there is a maximum in this amplification curve at very low loading when the finite flexural rigidity of the tethering elements is considered. As noted in ref. 8, the amplification ratio εt/εc increases as both the loading frequency increases and the whole-tissue strain decreases for tissue strains of >5 microstrain (loads of >0.1 MPa).
Fig. 6.
Hoop strain of the osteocyte process is plotted as a function of loading frequency with tissue loading amplitude as a parameter. Note that EI can approximately be treated as 0 for loads ≥1 MPa.
Discussion
We have constructed a model for the central filament bundle based on the hexagonal organization of actin filaments cross-linked by fimbrin (13). The model is consistent with the central filament bundle organization observed for stereocilia in the ear (21) and microvilli in the intestine (11, 14). You et al. (9) found that there is a 25-nm annular space between the central filament bundle and the osteocyte process membrane. The structural similarity between the different cell protuberances suggests that brush border myosin-I or cross-filaments of equivalent function attach the core actin bundle to the osteocyte process membrane in this annular space. Furthermore, the structural periodicity in hexagonally packed microvilli and stereocilia suggests that the cross-filaments are spirally arranged with a 37.5-nm spacing, and the transverse elements, which attach the osteocyte process membrane to the canalicular wall, are arranged in a similar manner. Three features of this model make the osteocyte process more rigid than the model proposed by You et al. (8). First, the inner actin filaments of the central bundle experience no deflection due to the hexagonal symmetry of the spiraling fimbrin cross-links, which was not realized in earlier studies. Hence, there is no cumulative displacement of radially symmetric alternately loaded actin filaments. Second, the periodic spacing between the fimbrin cross-links was smaller, 37.5 nm (Fig. 1B) instead of 50 nm as assumed by You et al. (8). Third, actin filaments in the outer ring in ref. 8 had a uniformly distributed load rather than a point load Tn as in the present model. The probable existence of the double-helical spiral of cross-filaments shown in Fig. 1D was not realized previously (8). Combining these three effects, we find that the hoop strains in the osteocyte process are a factor of 3 smaller than those predicted by You et al. (8). However, the hoop strain is still quite large and is sufficient to stimulate cellular responses, as shown in Fig. 6, for loads of >20 MPa at 1 Hz (tissue strain of >1,000 microstrain) and for loads as small as 5 MPa at 10 Hz (tissue strains of >250 microstrain). The latter load corresponds to a cellular-level strain of 0.5% (Fig. 6).
Fig. 2 shows that the hydrodynamic loading produces a deflection of the transverse element, whereas the tensile force and the flexural rigidity inhibit the deflection. Hence, the finite bending rigidity EI should play a role in the strain-amplification model, at least for whole-tissue strains of <50 microstrain (tissue loadings < 0.1 MPa) (Fig. 7). Fig. 5 shows that the hoop strain decreases as EI increases. However, the transverse element behaves like a string for tissue loading of >1 MPa for EI = 700 pN·Nm2. Thus, finite flexural rigidity only inhibits the strain amplification at very small tissue loading. This result has important implications because it might explain why cellular-level signaling mechanisms are not constantly excited by the numerous low-amplitude loads observed in bone (2).
Although the actual mechanism by which bone cells sense mechanical loading is not known for sure, a growing body of theoretical and experimental studies (4, 8, 22, 26, 27) suggest that it is related to the fluid flow in the lacunar-canalicular porosity. Reich and Frangos (27) first demonstrated in culture that osteoblasts can sense fluid shear stress and elicit biochemical responses at shear levels comparable with endothelial cells. Subsequently, Weinbaum et al. (22) developed a theoretical model to predict the fluid shear stress levels that the cell process membrane would experience because of physiological loading and showed, quite surprisingly, that this shear stress was essentially the same as endothelial cells in human capillaries. Thereafter, numerous cell-culture studies with osteoblasts and osteocytes demonstrated intracellular fluid shear responses to steady, pulsatile, and oscillatory shear (3, 4). However, the fluid shear hypothesis then was questioned by Weinbaum et al. (14) on several grounds. First, the theoretical model by You et al. (8) predicted that the fluid drag on the tethering fibers per unit process length was ∼20 times greater than the fluid shear stress per unit cell process length, suggesting that fluid drag induced by mechanical loading was the dominant mechanism. Second, the theoretically predicted effective Young's modulus Eeff of the actin filament bundle in the cell process obtained using earlier assumed model parameters (8) was ∼200 times more than that measured in the cell body (28). The present analysis predicts that Eeff of this central bundle is ∼3 three times that in the work of You et al. (8). This finding suggests that the fluid shear responses that were being measured experimentally in cell cultures in fluid flow chambers (4, 27) were being elicited from the cell body rather than from the much more rigid, tightly organized cell processes, which are widely viewed as the sensing elements of the osteocyte.
The experiments of You et al. (4) are particularly revealing because they established a threshold response to elicit the release of Ca2+ when bone cells were grown on stretchable substrates and also examined the fluid shear response by using several different cell lines, including ostoblastic and osteocytic (MLO-Y4) cells. Previously, other investigators had examined very small cellular-level deformations by bending rigid glass substrates but were unable to separate out the effects due to fluid shear and substrate deformation. Owan et al. (29) tried to overcome this difficulty by using slides of different thickness and concluded that fluid shear was the dominant mechanism because osteopontin expression was enhanced by fluid shear, whereas there was no response for strain levels as high as 8%. Osteopontin is an important noncollagenous protein in bone matrix that is associated with bone remolding. In contrast, Ca2+ is an early response second messenger associated with numerous signaling pathways and, thus, a better indicator of the immediate mechanical response of the cells. The experiments on the MLO-Y4 cells, cells that have extended cell processes, showed significant increase in cytosolic Ca2+ when substrate strains were increased from 0.1 to 1.0% (4). This observation was similar to that of Smalt et al. (5), who found no increase in NO or prostaglandin E2 (PGE2) production for cellular strains up to 0.5%. Our model predicts that a threshold cellular-level strain of 0.5% can be achieved by a tissue loading of 20 MPa (tissue-level strain of 1,000 microstrain) at >1 Hz or a tissue loading of 5 MPa at >10 Hz (Fig. 6). Such a threshold could explain why bone tissue is not constantly excited by the plethora of small strains to which it is subjected on a daily basis (2). A second related behavior for very small strains is shown in Fig. 7. The finite flexural rigidity of the tethering element leads to a strong attenuation of the amplification mechanism described herein for tissue-level strains of <5 microstrain.
The important role that the pericellular matrix plays in the transmission of fluid shear stress to the actin cytoskeleton, and the dichotomy in response of the cell body and cell processes, is suggested by the recent experiments of Reilly et al. (30). These investigators exposed MLO-Y4 cells to oscillating fluid shear in which this extracellular matrix was either intact or degraded by hyaluronidase treatment. There was no effect of the glycocalyx degradation on the 2- to 5-fold increase in the intracellular calcium response, but the 4-fold increase in the PGE2 response was eliminated. This loss of PGE2 response was not observed for osteoblastic cells, which do not have cell processes, suggesting that cell processes are associated with the PGE2 response. In contrast, calcium signaling is associated with hydrodynamic shear forces acting on the much more compliant cell body, and this effect should be independent of the presence or absence of a thin pericellular matrix layer.
We emphasize that the present model provides a lower bound on the maximum strain that the central actin filament bundle will experience. First, the fimbrin cross-links are treated as inextensible because it was assumed that the axial strains on the fimbrin cross-bridges were small compared with the bending strain on the actin filaments. Second, the positioning of the cross-filament attachments in Fig. 1B has been chosen to minimize the maximum deflection of the filaments in the outer ring of the actin filament bundle. One can only speculate about the mechanism through which hoop strains on the central actin filament bundle cause cytosolic Ca2+ to increase. This mechanism could be through stretch-activated channels in the membrane of the cell process or an axial tension that is transmitted to the cell body due to an axial shortening of the actin filaments in the outer ring of the bundle that arises from their undulating periodic deformation.
Whereas the release of Ca2+ and a variety of second messengers observed in vitro very likely can be attributed to a shear response acting on the cell body, rather than the much stiffer cell processes (4, 27), these experiments provide little information about the fluid shear stress response in vivo, where the shear stress on the cell body and the cell processes can differ greatly because of lacunar-canalicular geometry. Cell processes are exposed to a level of fluid shear stress in vivo that is comparable with endothelial shear stresses in capillaries (22) because the fluid annulus surrounding the process is so narrow, 78 nm on average for adult mice (9). A pericellular matrix also is observed surrounding the cell body in lacunae, but the thickness of this layer is typically 1 μm and highly variable. Such distances argue against a tethering of the cell body to the lacunar wall as occurs in the canaliculi. From flow-continuity arguments, the fluid velocity in the pericellular space of the lacunae will be at least one order of magnitude smaller than in the canaliculi, and, thus, the shear stress on the cell body will be at least an order of magnitude smaller than those predicted for the cell processes. These qualitative estimates suggest that the cell body in vivo is not involved in mechanosensation, even though its effective Young's modulus is much smaller than the cell process. The more likely hypothesis is that the excitation mechanism is not fluid shear stress acting on the cell process membrane but, rather, the unique strain-amplification hypothesis that results from the interaction of the pericellular matrix and the cell process cytoskeleton.
Supplementary Material
Acknowledgments
This study was supported by National Institutes of Health Grants AR48699 (to S.W.) and AR41210 (to M.B.S.). Y.H. performed this study in partial fulfillment of the Ph.D. requirements for the City University of New York.
Abbreviations: GAG, glycosaminoglycan; PGE2, prostaglandin E2.
Note Added in Proof: Jiang and Cherian (31) have recently shown that hemichannels formed by connexin 43 in the cell processes are up-regulated by mechanical strain. These hemichannels allow for the release of PGE2 into the external environment, where it functions in an autocrine manner to regulate gap junction communication.
References
- 1.Rubin, C. T. & Lanyon, L. E. (1984) J. Bone Joint Surg. Am. 66, 397–402. [PubMed] [Google Scholar]
- 2.Fritton, S. P., McLeod, K. J. & Rubin, C. T. (2000) J. Biomech. 33, 317–325. [DOI] [PubMed] [Google Scholar]
- 3.Burger, E. H. & Veldhuijzen, J. P. (1993) in Bone, ed. Hall, B. K. (CRC, Boca Raton, FL).
- 4.You, J., Yellowley, C. E., Donahue, H. J., Zhang, Y., Chen, Q. & Jacobs, C. R. (2000) J. Biomech. Eng. 122, 387–393. [DOI] [PubMed] [Google Scholar]
- 5.Smalt, R., Mitchell, F. T., Howard, R. L. & Chambers, T. J. (1997) Am. J. Physiol. 273, E751–E758. [DOI] [PubMed] [Google Scholar]
- 6.Almekinders, L. C., Banes, A. J. & Ballenger, C. A. (1993) Med. Sci. Sports Exercise 25, 603–607. [PubMed] [Google Scholar]
- 7.Guilak, F., Ratcliffe, A. & Mow, V. C. (1995) J. Orthop. Res. 13, 410–421. [DOI] [PubMed] [Google Scholar]
- 8.You, L., Cowin, S. C., Schaffler, M. B. & Weinbaum, S. (2001) J. Biomech. 34, 1375–1386. [DOI] [PubMed] [Google Scholar]
- 9.You, L. D., Weinbaum, S., Cowin, S. C. & Schaffler, M. B. (2004) Anat. Rec. 278A, 505–513. [DOI] [PubMed] [Google Scholar]
- 10.Mooseker, M. S. & Tilney, L. G. (1975) J. Cell Biol. 67, 725–743. [DOI] [PMC free article] [PubMed] [Google Scholar]
- 11.Matsudaira, P. T. & Burgess, D. R. (1982) J. Cell Biol. 92, 657–664. [DOI] [PMC free article] [PubMed] [Google Scholar]
- 12.Tanaka-Kamioka, K., Kamioka, H., Ris, H. & Lim, S. S. (1998) J. Bone Miner. Res. 13, 1555–1568. [DOI] [PubMed] [Google Scholar]
- 13.Volkmann, N., DeRosier, D., Matsudaira, P. & Hanein, D. (2001) J. Cell Biol. 153, 947–956. [DOI] [PMC free article] [PubMed] [Google Scholar]
- 14.Weinbaum, S., Guo, P. & You, L. (2001) Biorheology 38, 119–142. [PubMed] [Google Scholar]
- 15.Wang, L., Ciani, C., Doty, S. B. & Fritton, S. P. (2004) Bone 34, 499–509. [DOI] [PMC free article] [PubMed] [Google Scholar]
- 16.Knothe Tate, M. L. (2001) Ann. Biomed. Eng. 29, 810–811 (lett.), and author reply (2001) 29, 812–816. [DOI] [PubMed] [Google Scholar]
- 17.Michel, C. C. (1997) Exp. Physiol. 82, 1–30. [DOI] [PubMed] [Google Scholar]
- 18.Weinbaum, S. (1998) Ann. Biomed. Eng. 26, 627–643. [DOI] [PubMed] [Google Scholar]
- 19.Hu, J., Xu, Y., Schappert, K., Harrington, T., Wang, A., Braga, R., Mogridge, J. & Friesen, J. D. (1994) Nucleic Acids Res. 22, 1724–1734. [DOI] [PMC free article] [PubMed] [Google Scholar]
- 20.Weinbaum, S., Zhang, X., Han, Y., Vink, H. & Cowin, S. C. (2003) Proc. Natl. Acad. Sci. USA 100, 7988–7995. [DOI] [PMC free article] [PubMed] [Google Scholar]
- 21.DeRosier, D. J., Tilney, L. G. & Egelman, E. (1980) Nature 287, 291–296. [DOI] [PubMed] [Google Scholar]
- 22.Weinbaum, S., Cowin, S. C. & Zeng, Y. (1994) J. Biomech. 27, 339–360. [DOI] [PubMed] [Google Scholar]
- 23.Frisch-Fay, R. (1962) Flexible Bar (Butterworth, Washington, DC).
- 24.Zeng, Y., Cowin, S. C. & Weinbaum, S. (1994) Ann. Biomed. Eng. 22, 280–292. [DOI] [PubMed] [Google Scholar]
- 25.Gere, J. M. & Timoshenko, S. P. (1990) Mechanics of Material (PWS-KENT, Boston).
- 26.Knothe Tate, M. L. (2001) in Bone Biomechanics, ed. Cowin, S. C. (CRC, Boca Raton, FL).
- 27.Reich, K. M. & Frangos, J. A. (1991) Am. J. Physiol. 261, C428–C432. [DOI] [PubMed] [Google Scholar]
- 28.Shin, D. & Athanasiou, K. (1999) J. Orthop. Res. 17, 880–890. [DOI] [PubMed] [Google Scholar]
- 29.Owan, I., Burr, D. B., Turner, C. H., Qiu, J., Tu, Y., Onyia, J. E. & Duncan, R. L. (1997) Am. J. Physiol. 273, C810–C815. [DOI] [PubMed] [Google Scholar]
- 30.Reilly, G. C., Haut, T. R., Yellowley, C. E., Donahue, H. J. & Jacobs, C. R. (2003) Biorheology 40, 591–603. [PubMed] [Google Scholar]
- 31.Jiang, J. X. & Cherian, P. P. (2003) Cell Commun. Adhes. 10, 259–264. [DOI] [PubMed] [Google Scholar]
Associated Data
This section collects any data citations, data availability statements, or supplementary materials included in this article.


