Abstract
The study was aimed at assessing the economic cost shouldered by government, as providers, in the provision of free Tuberculosis (TB) diagnosis and treatment services in Bauchi State, northern Nigeria. A cost analysis study was designed and questionnaires administered by the principal investigators to officers in charge of 27 randomly sampled government TB services providers across the State of Bauchi. Seventeen of these centers were primary care centers, 9 secondary care providers and one was a tertiary care provider. Data was also collected from personnel and projects records in the State Ministry of Health, of Works as well as the Ministry of Budget and Planning. The cost of buildings, staff and equipment replacement, laboratory, radiology and drugs in facilities were assessed and costs attributable tuberculosis inpatient, outpatient and directly observed therapy (DOT) services were estimated from the total cost based on the proportion of TB cases in the total patient pool accessing those services. The average proportion of TB patients in facilities was 3.4% in overall, 3.3% among inpatients and 3.1% in the outpatient population. The average cost spent to treat a patient with TB was estimated at US $227.14. The cost of inpatient care averaged $16.95/patient; DOT and outpatient services was $133.34/patient, while the overhead cost per patient was $30.89.
The overall cost and all computed cost elements, except for DOT services, were highest in the tertiary center and least expensive in the infectious diseases hospital partly due to the higher administrative and other overhead recurrent spending in the tertiary health facility while the lower overhead cost observed in the infectious diseases hospital could be due to the economy of scale as a result of the relative higher number of TB cases seen in the facility operating with relatively same level of resources as other facilities in the state.
Key words: tubercolosis, cost-analysis, HIV.
Introduction
Nigeria, like most third world countries, is severely resource constrained in the provision of health care services.1 The country bears the fourth highest burden of tuberculosis (TB) in the world with an incidence rate of 311 per 100,000 populations, prevalence of 521 per 100,000 population and 93 deaths due to TB per 100,000 populations in 2007;2 thus, TB poses tremendous economic burden for the country. Despite Nigeria's gross domestic product (GDP) per capita of US$ 1160 in 2008,3 only about $8.4 per capita is spent on health in that year,4 most of which was spent on staff wages.5 Underfunding, resource leakage and wastage due to corruption and incompetence were seen by several experts as the main reasons behind the prevalent misdiagnosis and low case detection rates of TB in the country over the last decades despite the enormous resources invested by both the government and international development partners.1,5 The complexity and cost of treating TB has increased in recent years due to emergence of multi drug resistant TB (MDR-TB) strains, significant proportion of TB patients co-infected with HIV sero-positive patients, high rates of both TB and HIV infections in difficult-to-reach populations and the delays in diagnosis.6–9
Although significant work has been done on the economic burden of TB to patients, societies and providers in several developed and developing countries, ironically few of such studies were done in sub Saharan Africa and fewer, if any, was reportedly done in any part of Nigeria despite the fact that data from such research may be essential for evidence based planning and efficient management of TB control programs. In an effort to bridge this knowledge gap, this study was designed with the aim of assigning the provider cost of Tuberculosis diagnostic and treatment services in Bauchi State.
Materials and Methods
Study area and setting
Bauchi State is located in the North Eastern region of Nigeria and is the 7th most populous state in the country. It occupies a land mass area of 49,259 sq Km with a total population of 4,676,465 inhabitants.10 The population of the State are served by about 950 government (2 tertiary, 19 secondary, 81 Primary Health Care Centers, 213 Maternity and Child Health centers, 636 Dispensaries/Health posts).11 However, only about 67 of these government facilities provide tuberculosis (the 2 tertiary hospitals, 18 general hospitals, 1 Infectious diseases hospital, 14 primary healthcare with diagnostic (smear microscopy) capacity, 25 treatment centers (also primary healthcare centers). Three privately owned clinics in the state provide tuberculosis services.11
The Nigerian National Tuberculosis Control Programme is based on the internationally recommended WHO Stop TB strategy and provides for free investigations for diagnosis as well as free quality drugs for treatment. This strategy also recommends decentralized treatment services close to patients' residence under direct observation with the help of government health workers and community volunteers.12 Clinicians, community health offices, nurses and other hospital staff attend to these patients in either outpatient department, where suspected TB patients are initially seen, diagnosed or followed up, or in general medical wards, where inpatient care is provided to patients with serious conditions requiring closer clinical attention. Patients suspected be having TB are usually asked to submit three early morning sputum for acid-fast bacilli tests in three consecutive days. Diagnosis is either based on sputum positive smear or clinical and radiological judgment when the sputum result is negative.
Directly observed therapy (DOT) is carried out in the first two months of treatment for those patients who live close to the clinics. However, family members and friends are usually relied on to give or make sure patients take medications in those that live too far from the clinic or are stable but too weak to reach the clinic. Generally, during the remaining six months of treatment patients only come in once every two weeks for refills. The DOT clinics are designated rooms in the hospitals for patients coming in to be weighed, reviewed, and receive treatment or pick their refills. The DOT clinic is also the place where the TB register is kept and TB notifications are made. A nurse or a community health officer usually oversees these clinics.
Any patient diagnosed with TB is usually referred for HIV voluntary counselling and testing (VCT), and if positive is referred to the nearest anti-retro viral therapy (ART) clinic were free HIV treatment is usually available.
Study design
This is a cross sectional study where a questionnaire was used to assess the provider cost of TB diagnosis and treatment. The questionnaire used was developed using the WHO cost analysis guidelines.13 The questionnaire was piloted in 2 facilities in May, 2008 and was found to be practical and reliable. Between June and August 2008, a total of 27 facilities were stratified randomly sampled out of the 67 facilities providing TB services in the state. Ethical approval was sought and granted for this research from the Bauchi State Ministry of Health.
Data collection
All sampled facilities were visited and questionnaires administered with the help of relevant members of staff. There were neither out-patient attendance records nor reliable inpatient registers or reliable patient records in all the facilities. However, the records from the TB notification and DOT register showed no particular pattern in weekly, monthly or annual incidence or proportion of TB cases in all except one treatment center and the reportedly sees fewer patients in rainy season due to bad road condition. Based on this information, and in the absence of a reference proportion of TB patient population, this study assumed the average patient counts done on the 3 randomly selected days in 12 consecutive clinic days, considered to represent the daily patient population in the hospital. However, Mondays were excluded because of possible bias resulting from higher patients coming in following weekend closure. Based on the number of both TB and total populations on these days, the proportions of TB patients receiving inpatient and outpatient care was calculated and used to allocate weigh costs for inpatient and outpatient services per patient receiving TB service in the facility. Overhead and general cost was also allocated based on proportion of TB patient in the overall facility patients' population from the total overhead spent in the facility. Staff costs are mostly shared, therefore, costs were calculated using proportional time allocation (proportion of staff time). Additional 29% fringe was added to staff cost based on the rate used by the state Ministry of Budget and Planning. Building cost was estimated from a cost per square meter estimation made from recently built facilities in the state. The average lifespan of buildings was assumed to be 30 years based on an unpublished report in the Ministry of Works. The annual inflation rate in the country was 10.9% in 2008 and 12.6% in 2009.14 Real time deposit interest rate was 9.87% in 2008 and 12 months deposit rate was 12.6% in 2008 and 13.6% in 2009.15 Based on these economic indexes, depreciation method of discounting was used in this study on the assumption that the net effect of both inflation and interest rates will be minimal. Thus, the annual discount rates for buildings was assumed to be 3.5% based on 30 year lifespan and 10% for general office and medical equipment based on 10 years lifespan. The replacement cost of equipment was also estimated from contract documents for supplies of equipment made for the government for the facilities in the state. The drug cost for 2 months treatment with Rifampicin, Isoniazid, Ethambutol Pyrazinamide and 6 months of Ethambutol and Isoniazid (2RHZE/6EH) as first line TB drugs per patient was assumed to be (in 2008) US$ 19 while second line drugs treatment with 2 months of Streptomycin, Rifampicin, Isoniazid, Ethambutol Pyrazinamide and a month of Rifampicin, Isoniazid, Ethambutol Pyrazinamide followed by 5 months of Rifampicin, Isoniazid, Ethambutol (2SRHZE/1RHZE/5RHE) per patient was estimated at (in 2008) US$ 46 based on WHO estimates.16 To estimate the cost of a sputum acid fast bacilli (AFB) test, the average cost was estimated from the market prices rates in 4 independent laboratories across the state, less by 35% (assumed profit margin). Another assumption made was that each TB patient would have at least 3 sputum AFB tests during the course of diagnosis and treatment. Each TB patient was also assumed to be screened for HIV during TB diagnosis or while on treatment and the cost of HIV screening was also by same method from 4 independent laboratories across the state. Another assumption made in the study is that only patients that are sputum negative get chest x ray, at least once during the course of TB diagnosis and treatment. This assumption is based on the practice reported in all the diagnostic centers. The cost of chest x ray was also estimated from the average, less by 35%, of price quotations from 4 independent x-ray facilities across the state.
Analysis
The Nigerian Naira amounts were subsequently converted to US dollar based on the currency exchange rate (Official rate from Central Bank of Nigeria in November, 2010) of NGR 118.5 to 1 US in 2008.17 The estimated cost attributable to TB per facility was calculated from the summation of all TB attributable the cost elements in each center. The average proportions of TB patients in outpatient, inpatients and general patient populations were estimated and dispersion of the measurement described. Differences in costs between levels of service provision and urban rural divide were assessed and reported. Diagrams were also drawn to appreciate these differences. Student t-test was done to test the significance of the differences of mean.
Results
Seventeen out of 50 Primary care centers TB services in the state were randomly sampled. Out of these 17 facilities, 11 provide treatment services only, while the remaining 6 treatment centers sampled provide both diagnostics and treatment services. Nine facilities are secondary care providers and one is a tertiary service provider. Four treatment centers sampled have less than 10 bed capacities, 5 other treatment centers have between 10 and 20 bed capacity, the remaining two treatment centers and six of the diagnostics primary care centers have between 20 and 50 bed capacities. All secondary care providers have between 100 and 180 bed capacities and the tertiary care centre has about 600 bed capacity.
Proportions of tuberculosis patients in facilities
The proportion of TB patients in the total patient population on the day of the research visit varied slightly between facilities. The mean of proportions for the total TB patient population within the patient populations in the facilities was 0.034 (SD 0.016; 95% CI 0.028–0.041). Non-parametric one-way ANOVA (Kruskal-Wallis Test) showed no significant (P=0.2578) deviation in the ratio TB patients/total patient population among the facilities sample in the study. The proportion of TB inpatients in inpatient population in all the facilities was estimated at 0.33 (SD 0.037; 95% CI 0.019–0.048) and the proportion of TB outpatients in outpatient population was 0.03 1 (SD 0.013; 95% CI 0.026–0.036). Kruskal-Wallis Test showed significant (P=0.0036) difference in the ratio hospitalized TB patients/total hospitalized patient population among the facilities sample in the study. However, by taking out the Infectious Diseases hospital, a hospital designated as a referral hospital to treated infectious diseases has much higher proportion of TB patients, the variability became statistically insignificant (P=0.3212).
The ratio TB cases/total outpatient population in all the facilities was 0.031, and the variation among facilities, tested by Kruskal-Wallis Test in the sample was not significant (P=0.3948) (Table 1; Figures 1, 2 and 3).
Table 1. Proportions of tuberculosis patients in the whole facility patient population as well as in outpatients and inpatients population by facility level.
| Facility level | Proportion of all tuberculosis patients in facility patient population (%, SD) |
Average proportion of facility tuberculosis inpatients in inpatient population (%, SD) |
Average proportion of tuberculosis outpatients in facility outpatient population (%, SD) |
|---|---|---|---|
| Tertiary hospital | 0.03 (3%, 0) | 0.03 (3%, 0) | 0.03 (3%, 0) |
| Infectious disease hospital | 0.11 (11%, 0) | 0.19 (19%, 0) | 0.08 (8%, 0) |
| General hospitals | 0.036 (3.6%, 0.011) | 0.041 (4.1%, 0.014) | 0.03 (3%, 0.08) |
| PHC (D) | 0.04 (4%, 0.02) | 0.038 (3.8%, 0.0147) | 0.027 (2.7%, 0.01) |
| PHC (T) | 0.029 (2.9%, 0.009) | 0.015 (1.5%, 0.013) | 0.032 (3.2%, 0.014) |
| For all facilities | 0.034 (3.4%, 0.019) | 0.033 (3.3%, 0.037) | 0.031 (3.1%, 0.013) |
Figure 1.
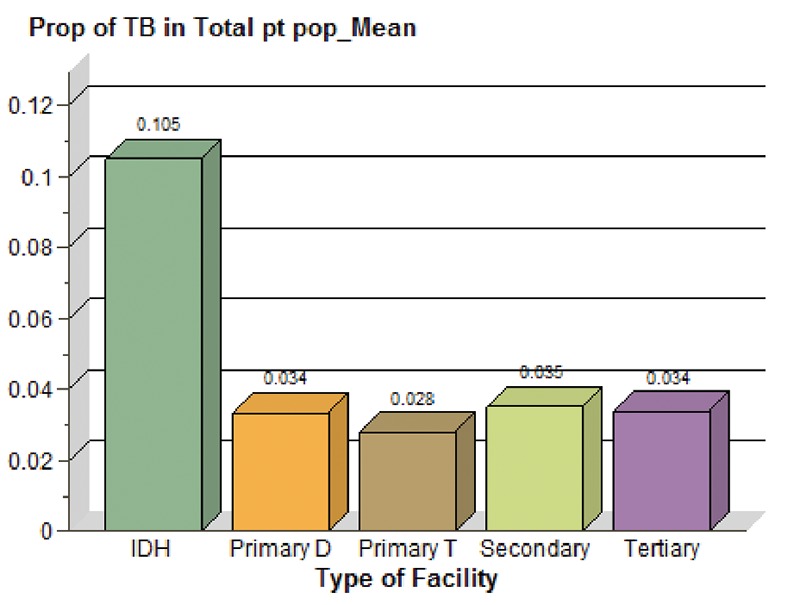
Overall proportions of tuberculosis patients by facility type.
Figure 2.
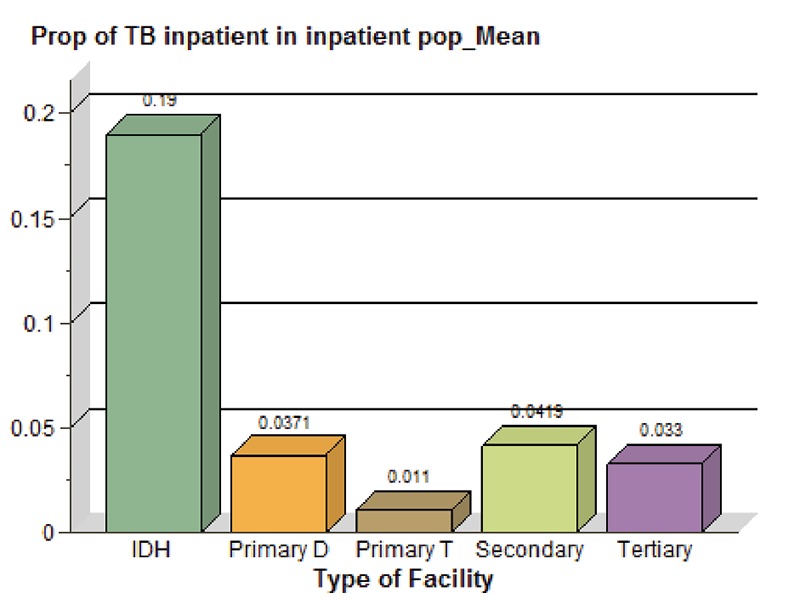
Proportions of tuberculosis patients inpatients by facility type.
Figure 3.
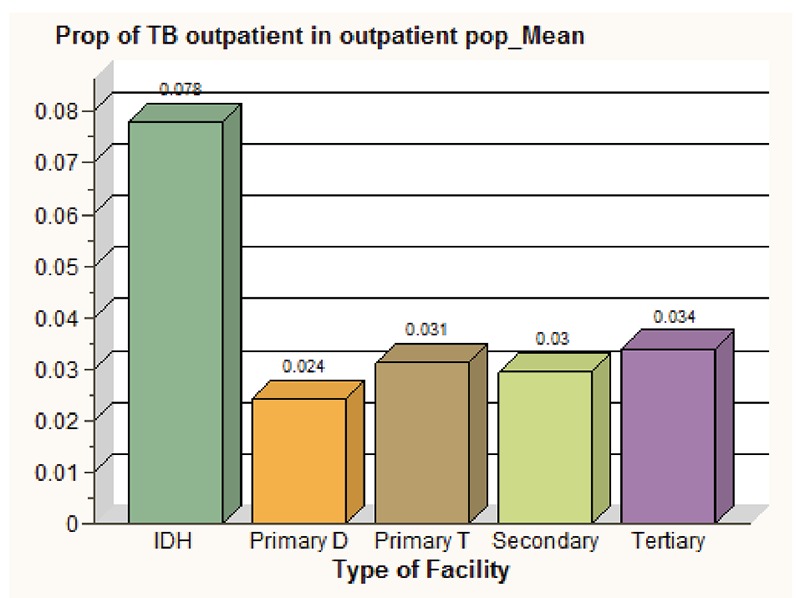
Proportions of tuberculosis patients outpatients by facility type.
Cost of tuberculosis treatment per patient treated
The average provider cost attributable to TB diagnosis and treatment in Bauchi State was estimated at US $206.22 per patient treated. The overall cost and all computed cost components, except for DOT services, were observed to be highest in the tertiary center and least expensive in the infectious diseases hospital. However, this variation in the total cost per patient among facilities, tested as tested using Kruskal-Wallis method was not significant (P=0.1407). Of all the cost elements estimated, the costs of providing DOT services contribute highest in all the facilities, ranged from US$ 148 (61% of the total cost) in Primary Healthcare treatment centers to US$ 21 (23% of total cost) in the Infectious Diseases hospital. This could be due to the lower number of patients in those facilities despite the human and other resources stationed to provide the DOT. The difference in the cost of DOT services between facilities was found to be statistically not significant, with a P value of 0.1407 (Kruskal-Wallis χ2-test). The average overhead cost estimate for all the centers in this study was US$ 30.89 per TB patient (SD 16.55; 95% CI 24.35– 37.44). The overhead varied significant between facilities. The estimated overhead cost was only about US$ 11 (12% of the total cost) in the Infectious Diseases hospital, respectively, but was as high as US$ 74 (29% of total cost) in the Tertiary Hospital though these observed differences between the centers was also found to be statistically not significant (P=0.1281) by Kruskal-Wallis χ-test. The average cost of hospitalization for TB patients was estimated at US$ 16.95 per TB patient (SD 13.99; 95% CI 11.41– 22.48). The average cost of follow-up visits was estimated at US$ 6.26 (SD US$ 4.02; 95% CI US$ 4.67– $7.85) and the cost of DOT services estimated at $119.27 (SD US$ 67.81; 95% CI US$ 92.45– US$ 146.10). These inter-centers variation was statistically significant, with a P value of 0.0273 (Kruskal-Wallis χ-test). Ninety one percent of patients in all the facilities were assumed to be on first line drugs and 9% on second lines based on the reported prevalence resistance to first line anti TB drugs resistance. A weighted estimation of the cost of anti TB drugs was US$ 21.43 per patient treated in any facility and the cost estimate for AFB sputum tests, HIV screening and chest X-rays for sputum negative patients was US$ 23.20 per TB patient (Table 2; Figures 4, 5, 6 and 7).
Table 2. Average cost of tuberculosis services per patient by facility type.
| Facility level | Average overhead cost/patient (%total cost) In US $ |
Inpatient services cost/ patient (% total cost) in US $ |
Average cost (SD) of drugs, sputum test and chest x-ray/ patient x in US$ |
Outpatient services cost (including DOT services)/ patient (% total cost) in US $ |
Cost of DOT services per tuberculosis patient (% total cost) |
Total cost of tuberculosis care /patient (including drugs and tests) /patient |
|---|---|---|---|---|---|---|
| Tertiary hospital | 74 (29%) | 25 (10%) | 44.63 (18%) | 7.59 (3%) | 102.18 (40%) | $253.43 (100%) |
| Infectious disease Hospital |
11 (12%) | 13 (14%) | 44.63 (48%) | 2.27 (2%) | 21.13 (23%) | $92.03 (100%) |
| General hospitals | 32 (16%) | 22.88 (12%) | 44.63 (23%) | 5.40 (3%) | 90.09 (46%) | $195.00 (100%) |
| PHC (D) | 22.67 (10%) | 22 (10%) | 44.63 (20%) | 4.98 (2%) | 124.13 (57%) | $218.41 (100%) |
| PHC (T) | 32.45 (13%) | 9.45 (4%) | 44.63 (18%) | 7.84 (3%) | 148.33 (61%) | $242.70 (100%) |
Figure 4.
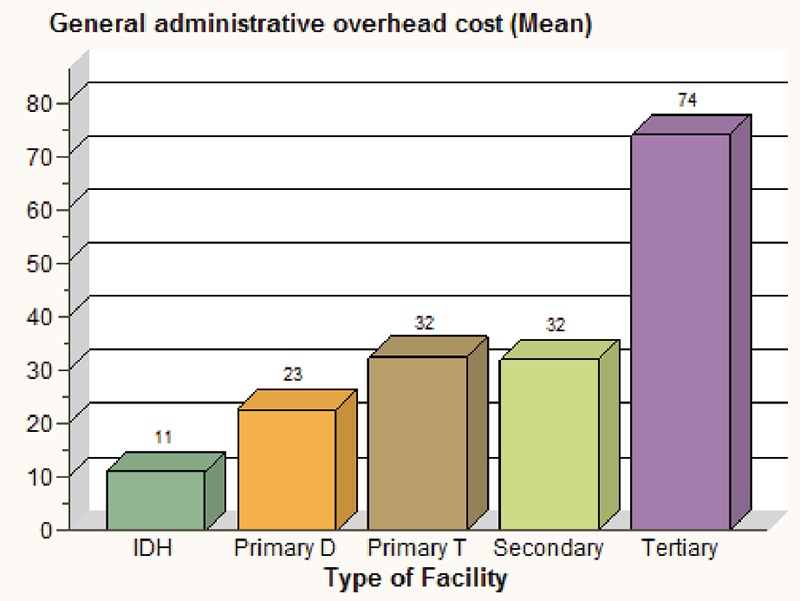
Average overhead cost attributable to tuberculosis patients (per tuberculosis patient) by facility type in US Dollars.
Figure 5.
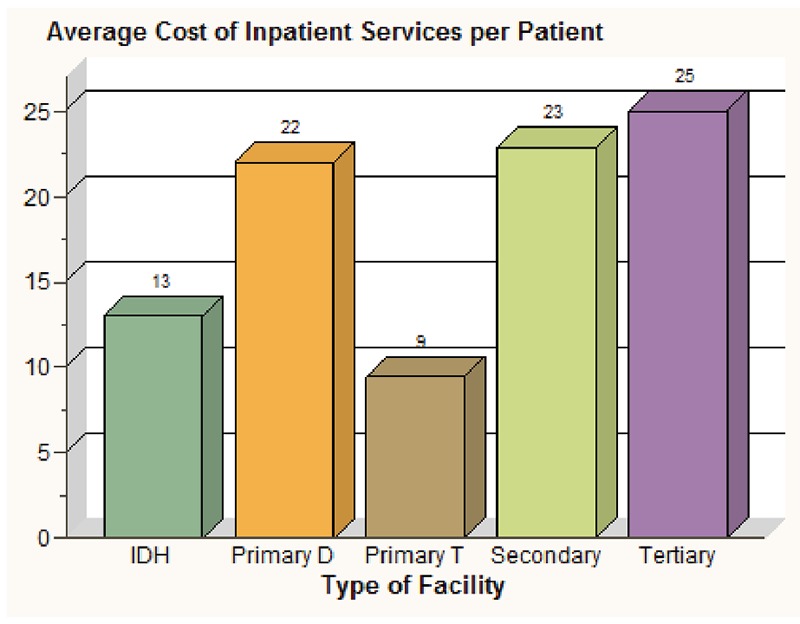
Average inpatient cost per tuberculosis patient by facility type in US Dollars.
Figure 6.
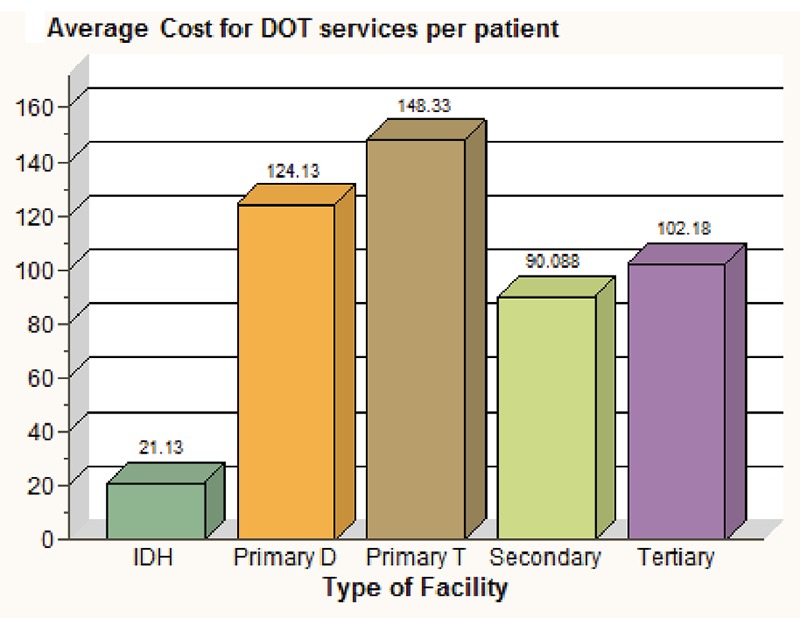
Average cost of DOT services per tuberculosis patient by facility type in US Dollars.
Figure 7.
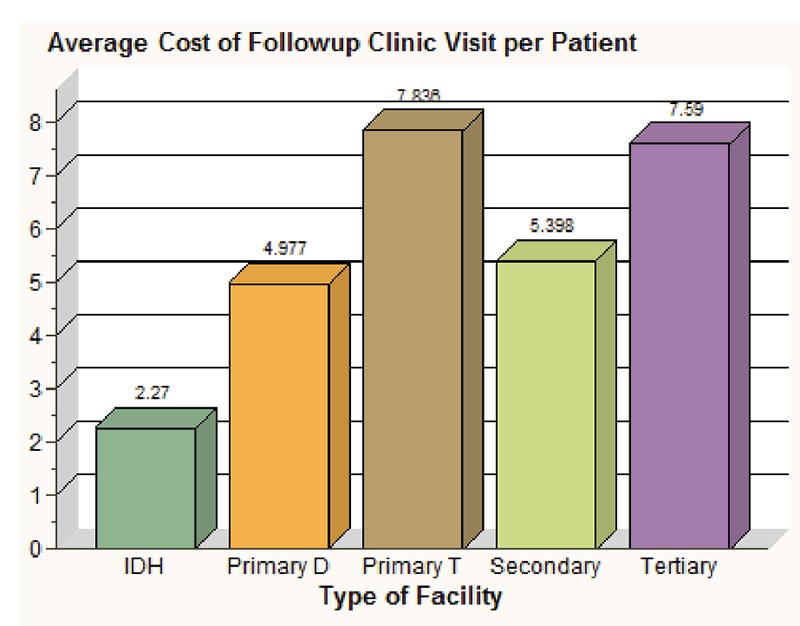
Average clinics follow-up cost per tuberculosis patient by facility type in US Dollars.
Discussion
Tuberculosis patients constitute about 3.4% of all patients, 3.3% of all inpatients and 3.1% of all outpatients receiving care in government health care facilities across Bauchi state, Nigeria. The average cost for treating a patient with TB was estimated at US$ 206.22 with inpatient cost estimated as US$ 16.95/patient, outpatient cost including the DOT services as US$ 133.34/patient and average overhead cost per patient estimated at US$ 30.89/patient treated. Primary health care diagnostic centers were observed to spend less overhead cost per patient than that the General Hospitals and primary health care treatment centers. This is probably due to both inadequate staffing and lower budget for recurrent spending in primary health care diagnostic centers with higher proportion of TB patients and higher patient population or more staffing and recurrent spending in general hospitals and primary health care treatment centers with lower proportion of TB patients and lower patient population. The Infectious Diseases hospital had the lowest cost of all cost components per patient treated. This could probably be due to a lower marginal cost that resulted from economy of scale. The inpatients services cost per patient is slightly higher in the tertiary hospital probably because of the higher cost of staff and more recurrent spending. The study showed that the cost of inpatient service care per patient in the primary health care treatment centers is much less than in general hospitals and primary health care diagnostic centers probably due to both inadequate staffing and/or low inpatient capacity and/or lower recurrent spending primary health care treatment centers with higher proportion of TB patients or more staffing and higher recurrent spending in general hospitals and primary health care diagnostic centers with lower proportion of TB patients.
The outpatients' services cost per patient was highest in both primary health care treatment and diagnostic centers probably because of higher proportion of TB patients in a low out patient population. However, Infectious diseases hospital spent least as outpatients per patient than general hospitals and tertiary centers probably due to both inadequate staffing and recurrent spending in the infectious disease hospital with higher proportion of TB patients and higher patient population or more staffing and recurrent spending in general hospitals and tertiary centers with lower proportion of TB patients and lower patient population. In a country where the GDP per capita is only US$ 137018 and government total expenditure per capita of US$ 50 and government total expenditure on health constituting only 4.1% of GDP,19 the cost of tuberculosis treatment reported in this study could probably be an adjunct reason for the low case detection rate for TB in the country.
Several other studies from other countries have reported varied estimates of the cost for treating TB in respective countries probably due to difference in the economic environment. For instance, a study conducted in Thailand estimated the provider cost for treating tuberculosis at $373 in 1995,20 while another study from India reported lower mean cost at rupees 1587,12 equivalent to US$ 35.9821 in 2006. Unfortunately, we could not find any study on provider cost for TB from any sub-Saharan country.
Study limitations
One of the limitations of this study is the exclusion unrecorded costs and possible staffs that were being paid by the government to provide services for these patients but were not accounted in the facilities for legitimate and, probably, illegitimate absences. However, all efforts were made to ensure that all the staff paid to provide services in these facilities. There were a total of 4 nurses, 2 community health offices and about 6 other staff that were on in-service training and 4 that was recently absent without excuse. Some assumptions, particularly in the estimation of the proportions of TB patients is a major limitation in this study as the patients daily turnover was neither constant nor predictable, however, considering the fact that there was no patients records in any of the facilities, these assumptions were necessary and we believe averaging the daily turnout from 3 randomly selected days over a period of 3 weeks was appropriate. In few facilities, all treatment centers, there were no TB patient in the clinic on all the three days selected, but between 1 and 3 TB patients were seen in the facility within the week, a proportion of 0.005 were used. Assumptions were also made in estimating the replacement costs and life spans of buildings and equipment as well as in estimating other cost components and unfortunately sensitivity analysis was not done to assess the effect of the assumptions in the study. However, considering the detailed assessment of unit costs, the cost estimates in this study represent a relatively reliable distribution of costs between facilities.
References
- 1.Peters DH. From Evidence to Action. Vol. XXII. World Bank, Washington, DC, USA: 2009. Improving health service delivery in developing countries; pp. 338–338. [Google Scholar]
- 2.WHO. Global Tuberculosis Control. Epidemiology, Strategy, Financing. Report 2009. Available from: http://www.who.int/tb/publications/global_report/2009/en/index.html.
- 3.Department for International Development. [Accessed on 11th July 2010];Report D-Fact Sheet Nigeria. 2009 Retrieved from: http://www.dfid.gov.uk/Where-wework/Africa-West--Central/Nigeria/Key-facts/
- 4.Bell JC, Rose DN, Sacks HS. Tuberculosis preventive therapy for HIV-infected people in sub-Saharan Africa is cost-effective. AIDS. 1999;13:1549–56. doi: 10.1097/00002030-199908200-00016. [DOI] [PubMed] [Google Scholar]
- 5.World Bank Group. Vol. XXV World Bank, Washington, DC, USA: Improving primary health care delivery in Nigeria: evidence from four states. [Google Scholar]
- 6.Corbett EL, Watt CJ, Walker N, et al. The growing burden of tuberculosis: global trends and interactions with the HIV epidemic. Arch Int Med. 2003;163:1009–21. doi: 10.1001/archinte.163.9.1009. [DOI] [PubMed] [Google Scholar]
- 7.Arno PS, Murray CJ, Bonuck KA, Alcabes P. The economic impact of tuberculosis in hospitals in New York City: a preliminary analysis. J Law Med Ethics. 1993;21:317–23. doi: 10.1111/j.1748-720x.1993.tb01256.x. [DOI] [PubMed] [Google Scholar]
- 8.Pablos-Mendez A, Sterling TR, Frieden TR. The relationship between delayed or incomplete treatment and all-cause mortality in patients with tuberculosis. JAMA. 1996;276:1223–8. doi: 10.1001/jama.1996.03540150025026. [DOI] [PubMed] [Google Scholar]
- 9.Iseman MD, Cohn DL, Sbarbaro JA. Directly observed treatment of tuberculosis. We can't afford not to try it. New Engl J Med. 1993;328:576–8. doi: 10.1056/NEJM199302253280811. [DOI] [PubMed] [Google Scholar]
- 10.BACATMA. Bauchi State Agency for the Control of HIV/AIDS, Tuberculosis/ Leprosy and Malaria. Bauchi State Tuberculosis, HIV/AIDS and Malaria need assessment. Report. 2008
- 11.BACATMA. Bauchi: Safe-Motherhood Need Assessment Committee Report. Bauchi State Government; Nigeria: 2008. [Google Scholar]
- 12.Muniyandi R, Rajeswari R, Balasubramanian R. Estimating Provider Cost for Treating Patients with Tuberculosis under Revised National Tuberculosis Control Programme. Indian J Tuberc. 2006;53:12–7. [Google Scholar]
- 13.WHO. Guidelines for cost effectiveness analysis. Report 2005. Available from: http://www.who.int/choice/en/
- 14.Central Bank of Nigeria. Data and Statistics, Money Market Indicators. [Accessed on 10/11/2010];12 months Deposit Rate. Retrieved from http://cenbank.org/rates/mnymktind.asp?year=2008.
- 15.Central Bank of Nigeria. Data and Statistics, Inflation Rates. [Accessed on 10/11/ 2010];12 months Inflation Rate. Retrieved from http://cenbank.org/rates/infltates.asp?year=2008.
- 16.WHO/The Stop TB Partnership. The Global Plan to Stop TB 2006–2015. Report WHO/HTM/STB/2006.35. Available from: http://www.who.int/tb/publications/global_plan_to_stop_tb/en/index.html.
- 17.Central Bank of Nigeria. Data and Statistics. Foreign Exchange Rate. [Accessed on 10/11/201]; Retrieved from http://cenbank.org/rates/forex.asp?year=2008.
- 18.Development Economics LDB database. World Bank, Washington, DC, USA: 2009. [Accessed November 21st 2010]. World Bank Report. Nigeria At a Glance. Available from. http://devdata.worldbank.org/AAG/nga_aag.pdf. [Google Scholar]
- 19.WHO. [Accessed November 21st 2010];World Health Statistics 2008. Available from: http://www.who.int/whosis/whostat/EN_WHS08_Full.pdf.
- 20.Sawert H, Kongsin S, Payanandana V, et al. Costs and benefits of improving tuberculosis control: the case of Thailand. Soc Sci Med. 1997;44:1805–16. doi: 10.1016/s0277-9536(96)00289-4. [DOI] [PubMed] [Google Scholar]
- 21.OANDA. Currency Converter. [Accessed October 12th 2010];Forex Trading and Exchange Rates Services. Available from: http://www.oanda.com/currency/converter/


