Abstract
Human induced pluripotent stem cell-derived cardiomyocytes (hiPSC-CMs) provide an unlimited cell source to treat cardiovascular diseases, the leading cause of death worldwide. However, current hiPSC-CMs retain an immature phenotype that leads to difficulties for integration with adult myocardium after transplantation. To address this, we recently utilized electrically conductive silicon nanowires (e-SiNWs) to facilitate self-assembly of hiPSC-CMs to form nanowired hiPSC cardiac spheroids. Our previous results showed addition of e-SiNWs effectively enhanced the functions of the cardiac spheroids and improved the cellular maturation of hiPSC-CMs. Here, we examined two important factors that can affect functions of the nanowired hiPSC cardiac spheroids: (1) cell number per spheroid (i.e., size of the spheroids), and (2) the electrical conductivity of the e-SiNWs. To examine the first factor, we prepared hiPSC cardiac spheroids with four different sizes by varying cell number per spheroid (∼0.5k, ∼1k, ∼3k, ∼7k cells/spheroid). Spheroids with ∼3k cells/spheroid was found to maximize the beneficial effects of the 3D spheroid microenvironment. This result was explained with a semiquantitative theory that considers two competing factors: 1) the improved 3D cell-cell adhesion, and 2) the reduced oxygen supply to the center of spheroids with the increase of cell number. Also, the critical role of electrical conductivity of silicon nanowires has been confirmed in improving tissue function of hiPSC cardiac spheroids. These results lay down a solid foundation to develop suitable nanowired hiPSC cardiac spheroids as an innovative cell delivery system to treat cardiovascular diseases.
Keywords: Human induced pluripotent stem cell-derived cardiomyocytes, spheroids, silicon nanowires, oxygen transport
Graphical abstract
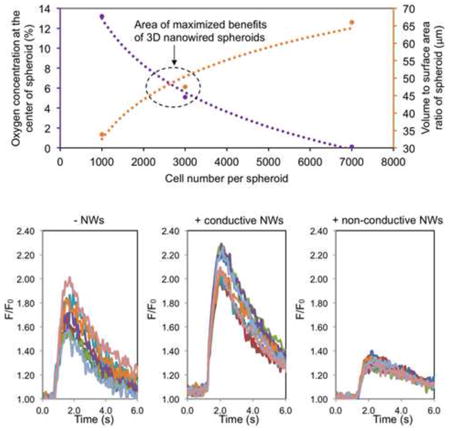
Cardiovascular disease is the leading cause of death and disability worldwide. Due to the limited regenerative capacity of adult human hearts, human induced pluripotent stem cell-derived cardiomyocytes (hiPSC-CMs) have received significant attention because they provide a patient specific cell source to regenerate damaged hearts. Despite the progress, current human hiPSC-CMs retain an immature phenotype that leads to difficulties for integration with adult myocardium after transplantation. To address this, we recently utilized electrically conductive silicon nanowires (e-SiNWs) to facilitate self-assembly of hiPSC-CMs to form nanowired hiPSC cardiac spheroids. Our previous results showed addition of e-SiNWs effectively enhanced the functions of the cardiac spheroids and improved the cellular maturation of hiPSC-CMs. In this manuscript, we examined the effects of two important factors on the functions of nanowired hiPSC cardiac spheroids: (1) cell number per spheroid (i.e., size of the spheroids), and (2) the electrical conductivity of the e-SiNWs. The results from these studies will allow for the development of suitable nanowired hiPSC cardiac spheroids to effectively deliver hiPSC-CMs for heart repair.
1. Introduction
Cardiovascular diseases are the leading cause of death and disability worldwide [1, 2]. Due to limited regeneration capacity of adult human hearts, human embryonic stem cells (hESCs) and human induced pluripotent stem cells (hiPSCs) have emerged as a powerful cell source for cardiac repair due to their proven capacity to produce functional human cardiomyocytes [3-11]. To this end, significant efforts have been devoted to transplanting hESC/hiPSC-derived cardiomyocytes (hESC/hiPSC-CMs) into damaged hearts to improve their functions in animal models [8, 11-19]. In particular, Murry and coworkers have demonstrated the injection of hESCs-CMs into the injured myocardium led to cardiac muscle regeneration in a non-human primate model [8]. Despite the progress, the current hESC/hiPSC-CMs retain an immature phenotype, including poorly organized sarcomere structures (i.e., functional units of the contractile machinery). This leads to difficulties for electrical and mechanical integration with human adult myocardium after transplantation and poses an arrhythmic risk [8, 20-22]. To address this challenge, we recently utilized electrically conductive silicon nanowires (e-SiNWs) to facilitate self-assembly of hiPSC-CMs to form nanowired human cardiac spheroids for heart repair [23]. We demonstrated that addition of e-SiNWs into the human cardiac spheroids creates an electrically conductive microenvironment and improves tissue function and cellular maturation of hiPSC cardiac spheroids. In addition, recent research has shown that cellular spheroids/aggregates improve cell retention and survival after transplantation due to their 3D microtissue configuration [17, 24, 25]. In this manuscript, we aim to examine two major factors that can affect the functions of the nanowired human cardiac spheroids: (1) the number of cells per spheroid (i.e., size of the spheroids), and (2) the role of the electrical conductivity of the e-SiNWs in improving tissue functions of the spheroids.
The optimal cell number in the spheroids is affected by two competing factors: 1) the improved 3D cell-cell adhesion, and 2) the reduced oxygen supply to the center of spheroids with the increase of cell number. In the first part of the study, we experimentally identified the optimal cell number in the spheroids and developed a semiquantitative theory to explain the finding. In our previous report, we showed the addition of e-SiNWs in the human cardiac spheroids improved cellular maturation and tissue function [23]. However, the role of electrical conductivity of the e-SiNWs has not been examined. In the second part of the manuscript, we prepared three types of the spheroids: spheroids without the addition of nanowires (NC), spheroids with the addition of phosphorus doped silicon nanowires (WCD), and undoped silicon nanowires (WCN). We studied the functions of these three different types of spheroids and confirmed the critical role of electrical conductivity of e-SiNWs in improving tissue functions of the hiPSC cardiac spheroids.
2. Materials and methods
2.1. Cell culture
The hiPSC-CMs (Cellular Dynamics International, Madison, WI, USA) were cultured according to the manufacturer's protocol. Briefly, hiPSC-CMs were seeded on 0.1% gelatin coated 6-wells plate with plating medium (Cellular Dynamics International) at a density of about 3 × 10⁵ to 4.0 × 10⁵ cells per well and incubated at 37 °C / 5% CO2 for two days. Two days after plating, the plating medium was removed and replaced with 4 ml of maintenance medium (Cellular Dynamics International) for another 2 days. After 4 days of monolayer pre-culture, cells were detached using trypLE Express (Gibco Life Technologies, Grand Island, NY) and harvested for spheroid fabrication.
2.2. Spheroid fabrication
The agarose hydrogel molds were prepared using commercial master micro-molds from Microtissues, Inc (Providence, RI, USA) as negative replicates to create non-adhesive agarose hydrogels molds containing 35 concave recesses with hemispheric bottoms (800 μm diameter, 800 μm deep) to facilitate the formation of tissue cell spheroids. 330 μl 2% sterile agarose solution were pipetted into the master micro-molds and then carefully detached after gelation from the master mold and transferred into one well of an 8-well tissue culture plate. 75 μl of the cell suspension with different concentrations were pipetted into each agarose mold. After the cells had settled down into the recesses of the mold (10 min), additional media was added (5 ml) and exchanged every 2 days for the length of the experiment.
2.3. Video and image analysis of beating spheroids
Videos of 6 spheroids from each group were recorded using Zen 2011 software (Zeiss, Göttingen, Germany) with capture rate of 14 frames per second. Then the videos were converted to a series of TIFF formatted pictures by Adobe Premiere (Adobe, San Jose, CA). Threshold edge-detecting in ImageJ software (National Institutes of Health) was used on high contrast spheroid pictures and graphed to realize contraction profiles, from which other quantifiers were calculated (e.g., fractional area change of single spheroids).
2.4. Histological and immunofluorescent analysis of spheroids
Freshly collected spheroids (∼30-35) were placed onto a pre-labeled tissue base mold, and the entire tissue block was covered with OCT. Immediately, the base mold containing spheroids were transferred into pre-cooled ethanol with dry ice to ensure that the spheroids were frozen quickly and completely. Frozen spheroids were cryosectioned into 7 μm thick layers onto glass slides for immunohistochemistry. The sections were fixed with pre-cooled acetone (-20 °C) for 10 min. After washing (3 times at 5 min) in PBS with 0.1% Triton X-100 (PBST), 100 μl blocking buffer were added (10% goat serum in PBST) onto the sections of the slides and incubated in a humidified chamber at room temperature for 1 h. Sections were incubated with appropriately diluted primary antibody: alpha sarcomeric actinin (Abcam, Cambridge, UK), troponin I (Santa Cruz, Dallas, TX), connexin-43 (Sigma Aldrich, St. Louis,MO), and COX IV (Abcam) overnight at 4 °C. After washing in PBST (3 times at 5 min), tissues were incubated with coordinate secondary antibodies diluted in PBST for 1 h at ambient temperature. After washing in PBST (3 times at 5 min), nuclei were stained with DAPI (Molecular Probes/Invitrogen, Eugene, OR) diluted in PBST for 15 min at ambient temperature. Following the final wash procedure (PBST, 3 times at 5 min), cover slips were added to the slides using Fluoro-Gel (Electron Microscopy Sciences, Hatfield, PA). Finally, TCS SP5 AOBS laser scanning confocal microscope (Leica Microsystems, Inc., Exton, PA) was for fluorescent imaging.
2.5. TUNEL staining for the frozen section of spheroids
In Situ Cell Death Detection Kit (Roche, Penzberg, Germany) was used to determine the viability of the cell in the frozen section of spheroids based on the Roche protocol. Briefly, the frozen sections of spheroids were fixed with 4% paraformaldehyde in PBS for half hour at room temperature. Following washing in PBS for 30 minutes, samples were incubated in a permeabilization solution (0.1% Triton X-100 and 0.1% sodium citrate in PBS) for 2 minutes on ice. Then 50 μl of the TUNEL reaction mixture were added to samples and incubated in 37 °C for 1 h. After washing in PBST (3 times at 5 min), nuclei were stained with DAPI (Molecular Probes/Invitrogen, Eugene, OR) diluted in PBS for 15 min at ambient temperature. Following the final wash procedure (PBS, 3 times at 5 min), glass cover slips were added to the slides using Fluoro-Gel (Electron Microscopy Sciences, Hatfield, PA). Finally, a TCS SP5 AOBS laser scanning confocal microscope (Leica Microsystems, Inc., Exton, PA) was used to obtain fluorescent images.
2.6. Calcium transient imaging of cardiac spheroids
Fluo-4 Direct Calcium Assay Kits (Life Technologies, Carlsbad, CA) was used to label calcium ion in the whole spheroids based on the protocol from Life Technologies. Briefly, spheroids were seeded onto 0.1% gelatin-coated glass cover slips and incubated at 37 °C, 5% CO2, 20% O2. Cell culture medium was changed every other day. After four days culture, the spheroids were rooted on the cover slips. Then cover slips with the spheroids were put into 12-well plates with 2 ml calcium dye solution per well and incubated at 37 °C, 5% CO2, 20% O2 for 1 h. TCS SP5 AOBS laser scanning confocal microscope (Leica Microsystems, Inc., Exton, PA) was used to collect the videos of the calcium transient of whole spheroids at room temperature with a capture rate of 14 frames per second. Notably, temperature influences the calcium transient dynamics, indicated by changes in the beat rate of cardiac spheroids with temperature (Figure S5). Finally, we used the LAS AF software (Leica) to conduct quantification of videos collected by confocal imaging.
2.7. Transmission Electron Microscopy
Spheroids were fixed with 2.5% glutaraldehyde, postfixed in PBS buffered 1% osmium tetroxide with 1.5% K+ ferricyanide, dehydrated in graded ethanol and Acetonitrile, and embedded in PolyBed 812 (Polysciences). 70 nm thick spheroid sections were prepared using a Leica UltraCut R and a diamond knife, stained with Hanaichi Pb citrate and uranyl acetate, and imagined using a JOEL 200 CX transmission electron microscope.
2.8. Numerical modeling of oxygen transport in cardiac spheroids
The oxygen transport within spheroids under static culture conditions mainly depends on diffusion [26]. A finite element model of oxygen diffusion within cardiac spheroids was developed based on Fick's second law. In a spherical coordinate system, the oxygen concentration profile in cardiac spheroids is governed by:
where C is oxygen concentration, r is radial distance from spheroid center, D is oxygen diffusivity, and R is oxygen consumption rate. The oxygen diffusivity through cells is significantly less than that through water. As used in previous studies [27, 28], D = 3.0 × 10⁻⁶ cm2/s for cardiomyocytes in suspension was adopted in the model. The concentration-dependent oxygen consumption rate (OCR) of cardiomyocytes can be modeled by the Michaelis-Menten equation:
where ρc is spheroid cell density, Vmax is the maximum OCR, and Km is the Michaelis-Menten constant. As the oxygen consumption rates of hiPSC-CMs or human cardiomyocytes are not readily available, the oxygen consumption rate (Vmax = 5.44 × 10⁻⁸ nmol/cell/s and Km = 3.79 nmol/mL) of rat neonatal cardiomyocytes in a quiescent condition was used in the model [29]. The boundary condition is that on the spheroid surface, the oxygen concentration maintains constant at 20% O2 (185 nmol/mL) [27]. The oxygen transport finite element model was numerically solved by the software COMSOL Multiphysics (COMSOL Inc, Burlington, MA). The oxygen concentration profiles were determined in spheroids with radius of ∼70, ∼100, ∼150, and ∼200 μm, corresponding to ∼0.5k, ∼1k, ∼3k, and ∼7k cells/spheroid.
2.9. Oxygen Consumption Rate Measurement
OCR of spheroids was measured according to the previous report [30]. Briefly, 30-60 spheroids of each group were placed in the OCR chamber equipped with fiber optic sensors (Instech Laboratories, Plymouth Meeting, PA), which could measure the declining oxygen partial pressure (pO2) over time. OCR measurements were conducted in high glucose DMEM medium without FBS at 37°C. The liquid volume in chamber was known as 175 μl, so the OCR (mol O2 per unit time) of spheroids could be calculated from the linear slope of the measured pO2. Each measurement usually took 90 minutes. Since the cell number of spheroids is known, the OCR value was normalized with cell number for each measurement with unit (pmol/hour/cell).
2.10. Statistics Analysis
Differences between experimental groups were analyzed using an independent Student T-tests, one-way or two-way ANOVA followed by Tukey's post-hoc test. P<0.05 was considered significantly different for all statistical tests.
3. Results and Discussion
The scaffold-free 3D spheroids provide a conductive microenvironment to promote cell-cell interactions and electrical coupling, leading to enhanced maturation of hiPSC-CMs [31]. The number of cells in a spheroid plays a key role in its function. When a spheroid contains too many cells, the supply of nutrient and oxygen to the cells in the spheroid center will be limited or insufficient to maintain cellular viability and/or normal function. When a spheroid contains a too small number of cells, the benefit of the improved 3D cell-cell adhesion over 2D culture will diminish. In this study, we fabricated hiPSC-CM spheroids with four different cell numbers per spheroid (i.e., ∼0.5k, ∼1k, ∼3k, ∼7k cells/spheroid) with and without the addition of 1:1 e-SiNWs (number of cells : number of e-SiNWs) using our previously established method [23]. Spheroids without and with e-SiNWs were designated as “NC” and “WCD”, respectively. As in the previous study, n-type SiNWs (Diameter ≈ 100 nm; length ≈ 10 μm; Silane/Phosphane = 500) were used to prepare WCD spheroids (Figure 1A-C). The length of the SiNWs was selected to inhibit cell internalization, and the doping ratio and diameter of the e-SiNWs were chosen to obtain a high conductivity (150 - 500 μS/μm) to create highly electrically conductive microenvironments within spheroids [32, 33]. The addition of the e-SiNWs into the cardiac spheroids did not significantly influence the sizes of the spheroids at all four cell number/spheroid (Figure 2A-B). This indicates the addition of e-SiNWs should not significantly affect the nutrient and oxygen supply to the cells in the spheroid center.
Figure 1. Fabrication of silicon nanowired human cardiac spheroids.
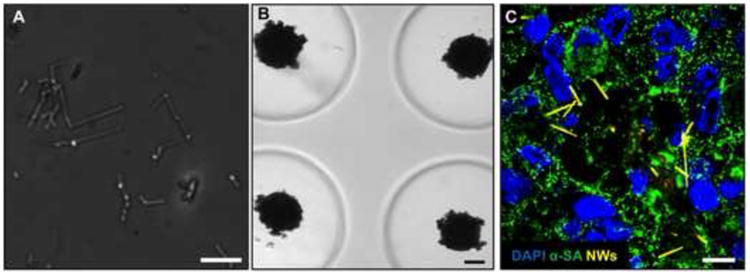
(A) Bright field image of silicon nanowires (diameter « 100 nm; length « 10 μm). (B) Bright field images of silicon nanowired human cardiac spheroids in agarose molds. (C) Confocal image of frozen section of silicon nanowired human cardiac spheroids at Day 0 (Blue – DAPI; Green – α-SA: alpha sarcomeric actinin; Yellow-silicon nanowires). Scale bars: (A) = 10 μm; (B) = 100 μm; (C) = 10 μm.
Figure 2. Human cardiac spheroids with controlled size and functional analysis.
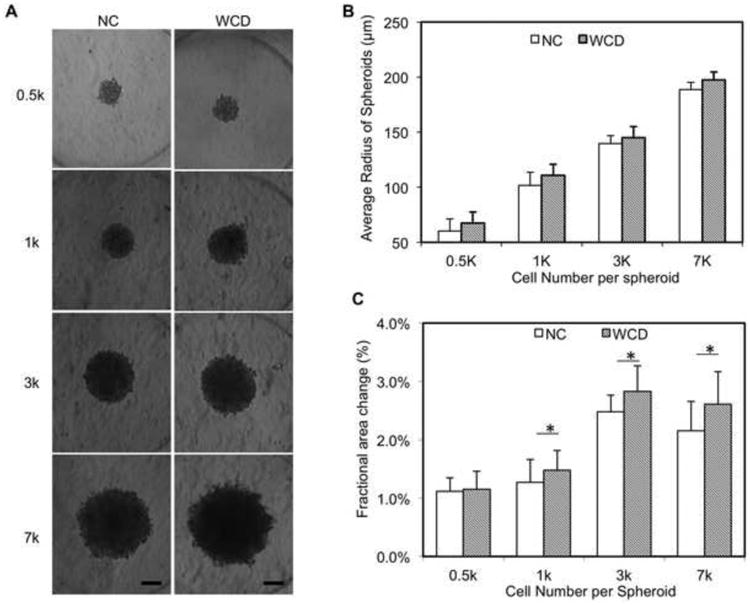
(A) Bright field images of spheroids with different cell number (0.5k, 1k, 3k, 7k) per spheroid. (B) Averaged radius of spheroid based on statistics (n=14). (C) Average fractional area change from Day 1 to Day 7 of each group (n=7). NC – without e-SiNWs; WCD – with e-SiNWs. Scale bars: (A) = 100 μm. Asterisks (*) represent statistical significance with p<0.05; error bars represent standard deviation.
Previous studies have shown that spheroids with a radius over 250 μm became apoptotic or necrotic over the time [34]. In addition, Radisic and coworkers have shown the diffusion of oxygen in the cardiac tissue engineering constructs is limited to 150∼200 μm [35]. Thus, the ∼7k cells per spheroid (∼200 μm radius) was chosen to be the upper limit in this study. On the other hand, our data showed the lowest contraction amplitude (i.e., fractional area change) in spheroids with ∼0.5k cells/spheroid (Figure 2C), which is in agreement with previous research that indicates the beneficial impact of the 3D cell-cell adhesion is limited for smaller spheroids [36]. In addition, it is difficult to process and section these smaller spheroids. Therefore, this study mainly focused on the three larger sizes of spheroids (i.e., 1k, 3k and 7k cells/spheroid). As seen in Figure S1A-B, TUNEL staining of the spheroid sections revealed a high level viability of hiPSC-CMs (>90%) for all three sizes after 7 days culture [37]. These results support our selection of the range of cell numbers in the spheroids. In addition, the high cell viability of the WCD spheroids supports the high biocompatibility of e-SiNWs, which is consistent with the previous reports [38-40].
As in our previous report, contraction amplitude (i.e., fractional area change) of the spontaneous, rhythmic beating of hiPSC-CM spheroids was used to examine the functions of the spheroids [23]. Figure 2C shows that the presence of e-SiNWs in WCD spheroids significantly increased the average contraction amplitude of 1k, 3k and 7k spheroids when compared with that of NC spheroids. This shows that the beneficial effects of adding e-SiNWs into human cardiac spheroids is not limited to a specific spheroid size, and this further supports our hypothesis that the addition of e-SiNWs into hiPSC cardiac spheroids creates an electrically conductive microenvironment and improves cardiac tissue function. In addition, the Figure 2C shows the WCD-3k spheroids, the WCD spheroids with ∼3k cells/spheroid, have the highest fractional area change among all the groups.
The results from contraction amplitude analysis are further supported by the immunohistochemistry (IHC) analysis of cardiac contractile (α-SA : α-sarcomeric actinin) and conductive (Cx-43: Connexin-43) proteins of the spheroids sections (Figure 3). α-SA was selected as it is a key component of the cardiac sarcomere structure, and connexin-43 (i.e., Cx-43) was selected as it forms gap junction channels that regulate electrical signal propagation between cardiomyocytes [41, 42]. Notably, the specificity of the Cx-43 antibody was confirmed by the staining of hiPSC-CMs in 2D culture, where cell-cell borders were more clearly visible than in 3D spheroid cross-sections (Figure S2). Consistent with functional analysis, structural analysis showed more organized structure and higher expression of contractile proteins (α-SA) (Figure 3A-B) and cell-cell gap junction protein (Cx-43) (Figure 3C-D) in the WCD spheroids, when compared with the NC spheroids. Notably, hallmarks of structural maturation (i.e., Cx-43 and α-SA structures) did not show a strong correlation with nanowires location (Figure S3). In addition, WCD-3k spheroids showed a highly organized sarcomere structure and highest expression level of α-SA and Cx-43 (Figure 3A-D). To additionally support the functionality of Cx-43, the co-staining of spheroid cross-sections with Cx-43 and N-cadherin (N-cad), a membrane junction protein, has been shown in the Figure S4. The co-localization of N-cad and Cx43 indicates the formation of functional cellular junctions [43]. These results indicate the WCD-3k spheroids can maximize synergistic effects of the appropriate cell number per spheroid and the presence of e-SiNWs. It is also important to note that all the spheroids after 7 days culture (Figure 3A) showed significantly improved sarcomere structure, when compared with that of the newly form spheroids (Figure 1C). This result shows spheroids provide a supportive 3D microenvironment for the development of hiPSC-CMs.
Figure 3. Histological analysis of spheroids.
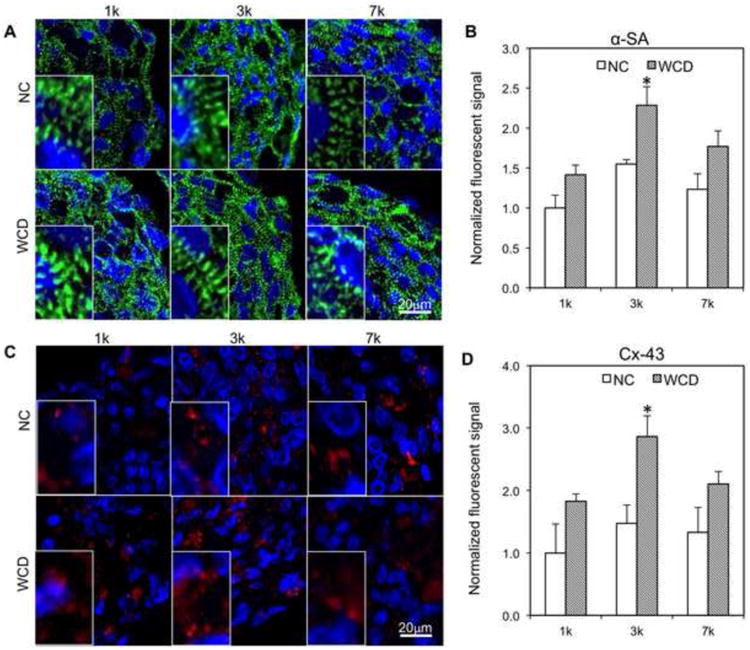
(A-B) Immunofluorescent staining and quantification of cardiac-specific contractile proteins (α-SA) for all groups after 7 days cell culture. Blue – DAPI; Green – α-SA; NC – without e-SiNWs; WCD – with e-SiNWs. (C-D) Immunofluorescent staining and quantification of conductive proteins (Cx-43) for all groups after 7 days cell culture. Blue – DAPI; Red – Cx-43. NC – without e-SiNWs; WCD - with e-SiNWs. Fluorescent signal area per nuclei on cross section are normalized to the NC-1k condition (n=3; 75 μm × 130 μm picture regions, at least containing >50 nuclei). Error bars represent standard deviation. Scale bars: (A) = 20 μm; (C) = 20 μm. Asterisks (*) represent statistical significance between WCD3k and other groups with p<0.05
It is important to note that it is difficult to directly compare maturity of hiPSC-CMs between 2D monolayer culture (Figure S2A) and 3D spheroid culture (Figure 3) based on the immuonofluorescently stained images due to the 3D configuration of the spheroids. When compared with the 2D cultured hiPSC-CMs that were harvested from the nanowired spheroids (Figure 6. A-C in our 2015 Nano Letters publication [23]), the hiPSC-CMs in Figures S2A have shown more immature characteristics such as mononuclear, short sarcomere length and low myofibrillar density.
Figure 6. The effects of electrically conductivity of silicon nanowires on the function of 3k spheroids.
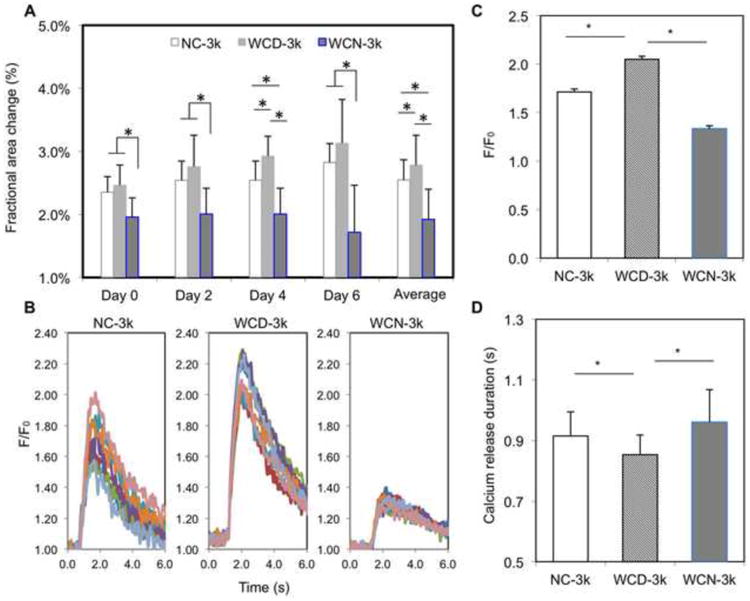
(A) Average fractional area change of NC-3k, WCD-3k and WCN-3k spheroids at Day 0, 2, 4, 6 and their averages (n=7). (B) Calcium transient of 7 regions of interest per spheroid for each group. Fluorescence amplitude, F/F0, refers to measured fluorescence intensity normalized to background fluorescence intensity. (C) Comparison of the peak value of F/F0 for each group (n=3). (D) Comparison of calcium release duration for each group (n=3). NC – without e-SiNWs; WCD – with doped SiNWs; WCN – with undoped SiNWs. Asterisks (*) represent statistical significance with p<0.05; error bar represents standard deviation.
Changing the number of cells per spheroids (i.e., size of spheroid) can alter the oxygen supply throughout the spheroid, which can have direct effects on the metabolic activity of the hiPSC-CMs within the spheroids. As an indicator for metabolic activity, a COX IV stain was used to show differences in mitochondrial expression between different spheroid size groups (Figure 4, Figure S2). IHC analysis showed the presence of significantly more COX IV-positive structure in WCD-3k spheroids compared to WCD-7k and WCD-1k spheroids (Figure 4A,B). To support the IHC analysis, oxygen consumption rate (OCR) measurements have been conducted for the WCD spheroids with different sizes. Consistent with the IHC analysis, the hiPSC-CMs in WCD-3k spheroids have highest OCR, demonstrating a high level of metabolic activity (Figure 4C and Figure S6). Notably, the measured OCRs are 0.34, 0.51 and 0.21 pmol/h/cell for the hiPSC-CMs in the WCD-1k, WCD-3k and WCD-7k spheroids respectively, which is similar to the reported OCR for hiPSC-CMs in 2D monolayer culture (0.71pmol/h/cell) [44]. While the size of 7k spheroids (i.e., radius: ∼200 μm) approaches the diffusion limit of oxygen [35], the lower COX IV-stained structure and lower contraction amplitude of the WCD-1k spheroids suggests a functional limitation due to an insufficient amount of cells per spheroid.
Figure 4. Metabolic analysis of nanowired spheroids with different cell numbers per spheroid.
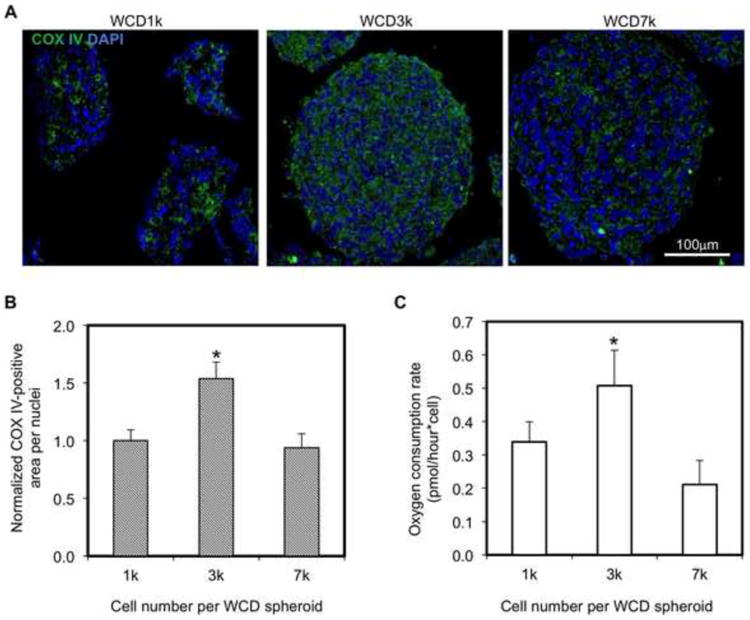
(A) Confocal images of cross-sections of WCD spheroids with different cell numbers per spheroid (Blue – DAPI; Green – COX IV). (B) COX IV positive area per nuclei of WCD spheroid sections are normalized to the WCD-1k (n=3; 75 μm × 130 μm picture regions, at least containing >50 nuclei). 7k (i.e., 7000), 3k, and 1k indicate number of cells per spheroid. WCD – with e-SiNWs. (C) Quantification of oxygen consumption rate of WCD spheroids with different cell numbers per spheroid. Asterisks (*) represent statistical significance with p<0.05; error bars represent standard deviation. Scale bars: (A)=100μm
The size of the spheroid (i.e., cell number per spheroid) influences both oxygen diffusion and 3D cell-cell interactions. As oxygen consumption rates of hiPSC-CMs at different oxygen concentrations are not readily available, we used the existing data of the oxygen consumption rate of rat neonatal cardiomyocytes to model oxygen concentration within spheroids with radii of ∼50, ∼100, ∼150 and ∼200 μm [29]. A finite element model of oxygen diffusion within the cardiac spheroids was developed based on Fick's second law. As shown in the Figure 5A, the amount of available oxygen is rapidly reduced from the edge of the spheroids to the center of the spheroids, and larger spheroids have lower oxygen supply for the cells in the center of the spheroids. On the other hand, the volume to surface area ratio increases with cell number, equaling 33.8, 47.5, and 66.0 for 1k, 3k, and 7k spheroids, respectively (Figure 5B) [45]. This indicates an enhanced 3D cell-cell adhesion with the increase of cell number per spheroid. The existence of the two competing factors (reduced oxygen supply vs. enhanced 3D cell adhesion with the increase of cell number per spheroid) indicates there could be an optimal cell number for spheroid fabrication, and our experimental data indicates that spheroids contain ∼3k cells maximizes the benefits of the 3D environment of nanowired spheroids (Figure 5C).
Figure 5. Functionally optimized range of cell number per spheroid.
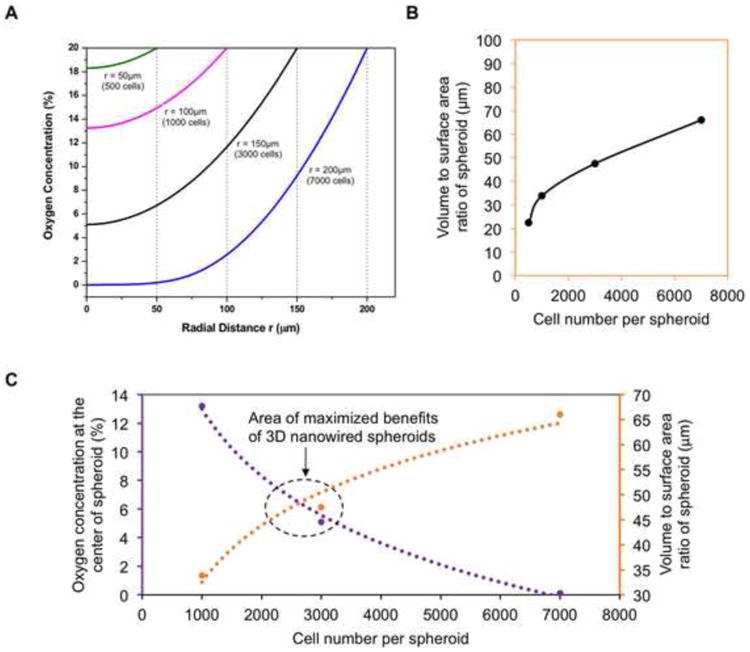
(A) A mathematical model of oxygen percentage using rat neonatal cardiomyocyte data for oxygen consumption (ref. 29), showing the range of oxygen concentration throughout theoretical spheroids of different sizes. (B) The volume to surface area ratio of different sized spheroids represents the amount of 3D cell-cell interaction, as a larger volume to surface ratio indicates more cells inside the spheroid with higher chance of multi-dimensional cell-cell interaction. (C) Data points from oxygen percentage and spheroid volume to surface area ratio at the 1k, 3k, and 7k cells per spheroid can be combined to summarize our findings on the size with maximized benefits centered around 3k cells per spheroid.
Using the newly established spheroid size (i.e., 3k cells per spheroid), we explored the role of the e-SiNWs in improving function and structural organization of hiPSC-CMs in spheroids, we fabricated three groups of human cardiac spheroids: spheroids without the addition of nanowires (NC), spheroids with the addition of doped silicon nanowire (WCD), and undoped silicon nanowires (WCN). Compared to the conductivity of the doped silicon nanowires (150 - 500 μS/μm), the undoped silicon nanowires have a conductivity of 0.001-0.1 μS/μm that is lower than culture medium (∼1.75 μS/μm) and myocardium (∼0.1 μS/μm) [32, 33]. This allowed for the examination of both the necessity of the electrical conductivity of nanowires and the effects of the mere presence of a silicon nanowire structure within the spheroid. Contraction amplitude analysis showed that the average fractional area change of WCD-3k group was significantly higher than that of NC-3k, while the average fractional area change of WCN-3k spheroids is significantly lower than that of NC-3k (Figure 6A). These results confirmed the beneficial effects of electrically conductive silicon nanowires on function of spheroids. This was further supported by calcium transient imaging of whole spheroids (Figure 6B-D). The WCD-3k spheroids showed a significantly increased overall amplitude of calcium transient levels during contraction and an accelerated time to peak of the calcium transient when compared with NC-3k, while WCN-3k showed a lower peak amplitude of calcium transient level than that of NC-3k.
Consistent with the functional analysis, structural analysis showed that the WCD-3k spheroids had higher organization of αSA-stained sarcomere structures as well as an increase in Cx-43-positive stained area (Figure 7 and Figure S7). Also, the ultrastructural analysis conducted by using electron microscopic imaging revealed a significantly higher presence of I bands per Z disc, H zones per sarcomere and more desmosomes per area in WCD-3k spheroids (Figure 8). Notably, the WCD-3k spheroids showed a visible organization of mitochondria around sarcomere structures similar to that of adult cardiomyocyte phenotype, as shown in Figure 8A-middle [3]. This supported our previous report that the presence of electrically conductive silicon nanowires in the hiPSC cardiac spheroids promotes cellular maturation of hiPSC-CMs. Collectively, these data showed the critical role of the electrical conductivity of the silicon nanowires in improving the tissue functions of hiPSC cardiac spheroids.
Figure 7. Immunofluorescent analysis of NC, WCD, and WCN-3k spheroids.
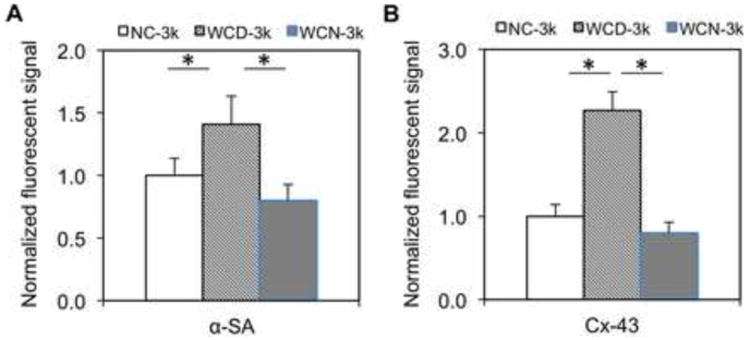
(A-B) Quantified expression of α-SA and Cx-43 of NC-3k, WCD-3k and WCN-3k spheroids, respectively. Fluorescent signal area per nuclei on cross section are normalized to the NC-3k condition (n=3; 75 μm × 130 μm picture regions, at least containing >50 nuclei). NC – without e-SiNWs; WCD – with doped SiNWs; WCN – with undoped SiNWs. Asterisks (*) represent statistical significance with p<0.05; error bar represents standard deviation.
Figure 8. Ultrastructural analysis of NC, WCD, and WCN-3k spheroids.
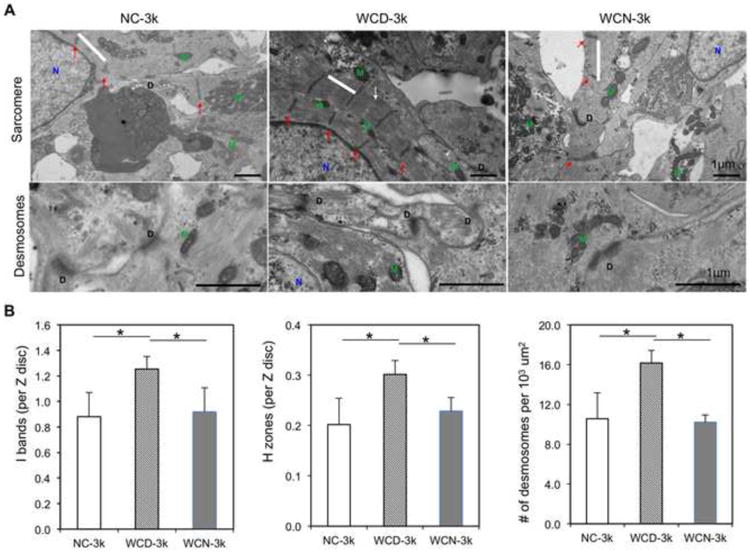
(A) Representative TEM images of NC-3k, WCD-3k and WCN-3k spheroids showing sarcomere structure (sarcomere, white bar; Z disks, Red arrows; H zones, white arrows; M, mitochondria; N, nucleus) and presence of desmosomes (D, desmosomes). Scale bar, 1 μm. (B) Morphometric analysis (average ± s.d.; n = 3-8 per group) showing ratio of I bands to Z disk, ratio of H zones to sarcomeres and number of desmosomes per 103 um2. NC – without e-SiNWs; WCD – with doped e-SiNWs; WCN – with undoped SiNWs. Asterisks (*) represent statistical significance with p<0.05.
4. Conclusion
The silicon nanowired hiPSC cardiac spheroids hold remarkable promise as an effective cell delivery system to treat heart failure [46-48]. Using our previously established silicon nanowired hiPSC-CM spheroid system, we identified a cell number-defined size of spheroids that advances the function and organization of hiPSC-CMs. The functional analysis of contraction amplitude, IHC analysis of contractile and conductive proteins, and metabolic investigation demonstrated that 3k spheroids maximize the beneficial effects of the 3D spheroid microenvironment. Additionally, the electrical conductivity of silicon nanowires was confirmed to play a critical role in accelerating structural and functional development of hiPSC-CMs in spheroids.
While hiPSC-CMs hold remarkable promise to treat injured hearts, the current hiPSC-CMs retain an immature phenotype, which makes them difficult to integrate with adult myocardium and pose an arrhythmic risk. Further, the current utilization of dissociated single cells for cell transplantation leads to low cell retention and survival [49]. To collectively address this challenge, we utilized e-SiNWs to facilitate self-assembly of hiPSC-CMs to form nanowired hiPSC cardiac spheroids. We demonstrated the e-SiNWs improved the spheroid functions and cellular maturity of hiPSC-CMs. In addition, recent research has shown improved cell retention and survival when using 3D cellular spheroids/aggregates. In this study, we identified an optimal cell number-defined spheroid size (∼3k/spheroid) and confirmed the critical role of electrical conductivity of e-SiNWs. As the hiPSC-CMs in the WCD-3k spheroids lack characteristics of adult cardiomyocytes (e.g., sarcomere M lines, T tubules) [20], our future research will focus on using additional physical/chemical stimuli (e.g., electrical stimulation and/or microRNA) to further improve the tissue functions and cellular maturity of the nanowired hiPSC cardiac spheroids. In addition, we will explore the addition of vascular cells (e.g., endothelial cells) to the nanowired spheroids to prepare pre-vascularized spheroids for the improved integration with host vasculature after transplantation. Results from these studies will allow for the development of suitable nanowired spheroids to repair damaged hearts and advance the field of cell-based cardiac regenerative medicine.
Supplementary Material
Figure S1. Viability analysis of spheroids using TUNEL staining. (A) TUNEL staining of the frozen sections of NC and WCD spheroids at day 7. Blue – DAPI; Green-TUNEL (apoptosis marker). (B) Quantification of viability from TUNEL staining (viability: blue colored area is divided by total colored area). NC – without e-SiNWs; WCD – with e-SiNWs. Error bars represent standard deviation. Scale bars: (A) = 100 μm.
Figure S2. Specificity of immunofluorescent staining of Cx-43 and COX IV. (A) Cx-43 (red) shows specific labeling at the cell junction of α-SA (green) stained 2D monolayer hiPSC-CMs. (B) Mitochondria staining of COX IV (green) for 2D monolayer hiPSC-CMs on gelatin-coated cover slips. Blue – DAPI. Scale bars: (A) = 20 μm; (B) =20 μm.
Figure S3. Immunofluorescent staining of α-SA/Cx-43 of the WCD-3k spheroid sections. Confocal imaging shows locations of α-SA (green) and Cx-43 (red) and e-SiNWs (yellow) in the WCD-3k spheroid sections. The α-SA and Cx-43 structures are not localized to regions close to e-SiNWs.
Figure S4. Immunofluorescent staining of N-Cad/Cx-43 of the WCD-3k spheroid sections. The white circles show the co-localization of Cx-43 (red) and N-Cad (green) surrounded in nuclei in the WC-D3k spheroids. Blue – DAPI.
Figure S5. The beat rate of the spheroid's spontaneous contraction is dependent on the temperature. The relationship between beat rate (BPM – beats per minute) and medium temperature. Error bars represent standard deviation.
Figure S6. Metabolic analysis of the WCD spheroids with different cell numbers per spheroid. Oxygen consumption rate for WCD-1k, -3k and -7k spheroids were measured using Instech Oxygen Consumption Chamber. WCD1k_30: 30 × WCD-1k spheroids, WCD1k_60: 60 × WCD-1k spheroids, WCD3k_30: 30 × WCD3k spheroids, WCD3k_60: 60 × WCD-3k spheroids, WCD7k_30: 30 × WCD7k spheroids.
Figure S7. Immunofluorescent staining of NC, WCD, and WCN-3k spheroids. Contractile protein (α-SA) and conductive protein (Cx-43) staining were performed after 7 days cell culture in spheroids without e-SiNWs (NC), with doped e-SiNWs (WCD), and undoped SiNWs (WCN).
Acknowledgments
The work is supported by the National Institutes of Health (8P20 GM103444, U54 GM104941), the startup funds from Clemson University, the National Science Foundation (NSF - EPS-0903795), the NIH Cardiovascular Training Grant (T32 HL007260), and US Department of Veterans Affairs Merit Review (I01 BX002327). This study used the services of the Morphology, Imaging, and Instrumentation Core, which is supported by NIH-NIGMS P30 GM103342 to the South Carolina COBRE for Developmentally Based Cardiovascular Diseases.
Footnotes
Publisher's Disclaimer: This is a PDF file of an unedited manuscript that has been accepted for publication. As a service to our customers we are providing this early version of the manuscript. The manuscript will undergo copyediting, typesetting, and review of the resulting proof before it is published in its final citable form. Please note that during the production process errors may be discovered which could affect the content, and all legal disclaimers that apply to the journal pertain.
References
- 1.Heron M, Hoyert DL, Murphy SL, Xu J, Kochanek KD, Tejada-Vera B. Deaths: final data for 2006. National vital statistics reports : from the Centers for Disease Control and Prevention, National Center for Health Statistics, National Vital Statistics System. 2009;57:1–134. [PubMed] [Google Scholar]
- 2.Roger VL, Go AS, Lloyd-Jones DM, Adams RJ, Berry JD, Brown TM, Carnethon MR, Dai S, de Simone G, Ford ES, Fox CS, Fullerton HJ, Gillespie C, Greenlund KJ, Hailpern SM, Heit JA, Ho PM, Howard VJ, Kissela BM, Kittner SJ, Lackland DT, Lichtman JH, Lisabeth LD, Makuc DM, Marcus GM, Marelli A, Matchar DB, McDermott MM, Meigs JB, Moy CS, Mozaffarian D, Mussolino ME, Nichol G, Paynter NP, Rosamond WD, Sorlie PD, Stafford RS, Turan TN, Turner MB, Wong ND, Wylie-Rosett J. Heart disease and stroke statistics--2011 update: a report from the American Heart Association. Circulation. 2011;123:e18–e209. doi: 10.1161/CIR.0b013e3182009701. [DOI] [PMC free article] [PubMed] [Google Scholar]
- 3.Hirt MN, Hansen A, Eschenhagen T. Cardiac tissue engineering: state of the art. Circulation research. 2014;114:354–67. doi: 10.1161/CIRCRESAHA.114.300522. [DOI] [PubMed] [Google Scholar]
- 4.Liau B, Zhang D, Bursac N. Functional cardiac tissue engineering. Regenerative medicine. 2012;7:187–206. doi: 10.2217/rme.11.122. [DOI] [PMC free article] [PubMed] [Google Scholar]
- 5.Vunjak-Novakovic G, Tandon N, Godier A, Maidhof R, Marsano A, Martens TP, Radisic M. Challenges in cardiac tissue engineering. Tissue engineering Part B, Reviews. 2010;16:169–87. doi: 10.1089/ten.teb.2009.0352. [DOI] [PMC free article] [PubMed] [Google Scholar]
- 6.Prowse AB, Timmins NE, Yau TM, Li RK, Weisel RD, Keller G, Zandstra PW. Transforming the promise of pluripotent stem cell-derived cardiomyocytes to a therapy: challenges and solutions for clinical trials. The Canadian journal of cardiology. 2014;30:1335–49. doi: 10.1016/j.cjca.2014.08.005. [DOI] [PubMed] [Google Scholar]
- 7.Barad L, Schick R, Zeevi-Levin N, Itskovitz-Eldor J, Binah O. Human embryonic stem cells vs human induced pluripotent stem cells for cardiac repair. The Canadian journal of cardiology. 2014;30:1279–87. doi: 10.1016/j.cjca.2014.06.023. [DOI] [PubMed] [Google Scholar]
- 8.Chong JJ, Yang X, Don CW, Minami E, Liu YW, Weyers JJ, Mahoney WM, Van Biber B, Palpant NJ, Gantz JA, Fugate JA, Muskheli V, Gough GM, Vogel KW, Astley CA, Hotchkiss CE, Baldessari A, Pabon L, Reinecke H, Gill EA, Nelson V, Kiem HP, Laflamme MA, Murry CE. Human embryonic-stem-cell-derived cardiomyocytes regenerate non-human primate hearts. Nature. 2014 doi: 10.1038/nature13233. [DOI] [PMC free article] [PubMed] [Google Scholar]
- 9.Lian X, Hsiao C, Wilson G, Zhu K, Hazeltine LB, Azarin SM, Raval KK, Zhang J, Kamp TJ, Palecek SP. Robust cardiomyocyte differentiation from human pluripotent stem cells via temporal modulation of canonical Wnt signaling. Proceedings of the National Academy of Sciences of the United States of America. 2012 doi: 10.1073/pnas.1200250109. [DOI] [PMC free article] [PubMed] [Google Scholar]
- 10.Burridge PW, Matsa E, Shukla P, Lin ZC, Churko JM, Ebert AD, Lan F, Diecke S, Huber B, Mordwinkin NM, Plews JR, Abilez OJ, Cui B, Gold JD, Wu JC. Chemically defined generation of human cardiomyocytes. Nature methods. 2014;11:855–60. doi: 10.1038/nmeth.2999. [DOI] [PMC free article] [PubMed] [Google Scholar]
- 11.Ye L, Chang YH, Xiong Q, Zhang P, Zhang L, Somasundaram P, Lepley M, Swingen C, Su L, Wendel JS, Guo J, Jang A, Rosenbush D, Greder L, Dutton JR, Zhang J, Kamp TJ, Kaufman DS, Ge Y, Zhang J. Cardiac repair in a porcine model of acute myocardial infarction with human induced pluripotent stem cell- derived cardiovascular cells. Cell stem cell. 2014;15:750–61. doi: 10.1016/j.stem.2014.11.009. [DOI] [PMC free article] [PubMed] [Google Scholar]
- 12.Laflamme MA, Gold J, Xu C, Hassanipour M, Rosler E, Police S, Muskheli V, Murry CE. Formation of Human Myocardium in the Rat Heart from Human Embryonic Stem Cells. The American journal of pathology. 2005;167:663–71. doi: 10.1016/S0002-9440(10)62041-X. [DOI] [PMC free article] [PubMed] [Google Scholar]
- 13.Laflamme MA, Chen KY, Naumova AV, Muskheli V, Fugate JA, Dupras SK, Reinecke H, Xu C, Hassanipour M, Police S, O'Sullivan C, Collins L, Chen Y, Minami E, Gill EA, Ueno S, Yuan C, Gold J, Murry CE. Cardiomyocytes derived from human embryonic stem cells in pro-survival factors enhance function of infarcted rat hearts. Nature biotechnology. 2007;25:1015–24. doi: 10.1038/nbt1327. [DOI] [PubMed] [Google Scholar]
- 14.Shiba Y, Fernandes S, Zhu WZ, Filice D, Muskheli V, Kim J, Palpant NJ, Gantz J, Moyes KW, Reinecke H, Van Biber B, Dardas T, Mignone JL, Izawa A, Hanna R, Viswanathan M, Gold JD, Kotlikoff MI, Sarvazyan N, Kay MW, Murry CE, Laflamme MA. Human ES-cell-derived cardiomyocytes electrically couple and suppress arrhythmias in injured hearts. Nature. 2012;489:322–5. doi: 10.1038/nature11317. [DOI] [PMC free article] [PubMed] [Google Scholar]
- 15.Stevens KR, Kreutziger KL, Dupras SK, Korte FS, Regnier M, Muskheli V, Nourse MB, Bendixen K, Reinecke H, Murry CE. Physiological function and transplantation of scaffold-free and vascularized human cardiac muscle tissue. Proceedings of the National Academy of Sciences of the United States of America. 2009;106:16568–73. doi: 10.1073/pnas.0908381106. [DOI] [PMC free article] [PubMed] [Google Scholar]
- 16.Madden LR, Mortisen DJ, Sussman EM, Dupras SK, Fugate JA, Cuy JL, Hauch KD, Laflamme MA, Murry CE, Ratner BD. Proangiogenic scaffolds as functional templates for cardiac tissue engineering. Proceedings of the National Academy of Sciences of the United States of America. 2010;107:15211–6. doi: 10.1073/pnas.1006442107. [DOI] [PMC free article] [PubMed] [Google Scholar]
- 17.Moon SH, Kang SW, Park SJ, Bae D, Kim SJ, Lee HA, Kim KS, Hong KS, Kim JS, Do JT, Byun KH, Chung HM. The use of aggregates of purified cardiomyocytes derived from human ESCs for functional engraftment after myocardial infarction. Biomaterials. 2013;34:4013–26. doi: 10.1016/j.biomaterials.2013.02.022. [DOI] [PubMed] [Google Scholar]
- 18.Caspi O, Huber I, Kehat I, Habib M, Arbel G, Gepstein A, Yankelson L, Aronson D, Beyar R, Gepstein L. Transplantation of human embryonic stem cell-derived cardiomyocytes improves myocardial performance in infarcted rat hearts. Journal of the American College of Cardiology. 2007;50:1884–93. doi: 10.1016/j.jacc.2007.07.054. [DOI] [PubMed] [Google Scholar]
- 19.Zwi-Dantsis L, Huber I, Habib M, Winterstern A, Gepstein A, Arbel G, Gepstein L. Derivation and cardiomyocyte differentiation of induced pluripotent stem cells from heart failure patients. European heart journal. 2013;34:1575–86. doi: 10.1093/eurheartj/ehs096. [DOI] [PubMed] [Google Scholar]
- 20.Yang X, Pabon L, Murry CE. Engineering adolescence: maturation of human pluripotent stem cell-derived cardiomyocytes. Circulation research. 2014;114:511–23. doi: 10.1161/CIRCRESAHA.114.300558. [DOI] [PMC free article] [PubMed] [Google Scholar]
- 21.Anderson ME, Goldhaber J, Houser SR, Puceat M, Sussman MA. Embryonic stem cell-derived cardiac myocytes are not ready for human trials. Circulation research. 2014;115:335–8. doi: 10.1161/CIRCRESAHA.114.304616. [DOI] [PMC free article] [PubMed] [Google Scholar]
- 22.Eng G, Lee BW, Protas L, Gagliardi M, Brown K, Kass RS, Keller G, Robinson RB, Vunjak-Novakovic G. Autonomous beating rate adaptation in human stem cell-derived cardiomyocytes. Nature communications. 2016;7:10312. doi: 10.1038/ncomms10312. [DOI] [PMC free article] [PubMed] [Google Scholar]
- 23.Tan Y, Richards D, Xu R, Stewart-Clark S, Mani SK, Borg TK, Menick DR, Tian B, Mei Y. Silicon nanowire-induced maturation of cardiomyocytes derived from human induced pluripotent stem cells. Nano Lett. 2015;15:2765–72. doi: 10.1021/nl502227a. [DOI] [PMC free article] [PubMed] [Google Scholar]
- 24.Bhang SH, Cho SW, La WG, Lee TJ, Yang HS, Sun AY, Baek SH, Rhie JW, Kim BS. Angiogenesis in ischemic tissue produced by spheroid grafting of human adipose-derived stromal cells. Biomaterials. 2011;32:2734–47. doi: 10.1016/j.biomaterials.2010.12.035. [DOI] [PubMed] [Google Scholar]
- 25.Lee WY, Wei HJ, Lin WW, Yeh YC, Hwang SM, Wang JJ, Tsai MS, Chang Y, Sung HW. Enhancement of cell retention and functional benefits in myocardial infarction using human amniotic-fluid stem-cell bodies enriched with endogenous ECM. Biomaterials. 2011;32:5558–67. doi: 10.1016/j.biomaterials.2011.04.031. [DOI] [PubMed] [Google Scholar]
- 26.Glicklis R, Merchuk JC, Cohen S. Modeling mass transfer in hepatocyte spheroids via cell viability, spheroid size, and hepatocellular functions. Biotechnology and bioengineering. 2004;86:672–80. doi: 10.1002/bit.20086. [DOI] [PubMed] [Google Scholar]
- 27.Brown DA, MacLellan WR, Laks H, Dunn JC, Wu BM, Beygui RE. Analysis of oxygen transport in a diffusion-limited model of engineered heart tissue. Biotechnology and bioengineering. 2007;97:962–75. doi: 10.1002/bit.21295. [DOI] [PubMed] [Google Scholar]
- 28.Rumsey WL, Schlosser C, Nuutinen EM, Robiolio M, Wilson DF. Cellular energetics and the oxygen dependence of respiration in cardiac myocytes isolated from adult rat. The Journal of biological chemistry. 1990;265:15392–402. [PubMed] [Google Scholar]
- 29.Casey TM, Arthur PG. Hibernation in noncontracting mammalian cardiomyocytes. Circulation. 2000;102:3124–9. doi: 10.1161/01.cir.102.25.3124. [DOI] [PubMed] [Google Scholar]
- 30.Papas KK, Colton CK, Nelson RA, Rozak PR, Avgoustiniatos ES, Scott WE, 3rd, Wildey GM, Pisania A, Weir GC, Hering BJ. Human islet oxygen consumption rate and DNA measurements predict diabetes reversal in nude mice. Am J Transplant. 2007;7:707–13. doi: 10.1111/j.1600-6143.2006.01655.x. [DOI] [PMC free article] [PubMed] [Google Scholar]
- 31.Nguyen DC, Hookway TA, Wu Q, Jha R, Preininger MK, Chen X, Easley CA, Spearman P, Deshpande SR, Maher K, Wagner MB, McDevitt TC, Xu C. Microscale generation of cardiospheres promotes robust enrichment of cardiomyocytes derived from human pluripotent stem cells. Stem cell reports. 2014;3:260–8. doi: 10.1016/j.stemcr.2014.06.002. [DOI] [PMC free article] [PubMed] [Google Scholar]
- 32.Mazzoleni AP, Sisken BF, Kahler RL. Conductivity values of tissue culture medium from 20 degrees C to 40 degrees C. Bioelectromagnetics. 1986;7:95–9. doi: 10.1002/bem.2250070111. [DOI] [PubMed] [Google Scholar]
- 33.Shin SR, Jung SM, Zalabany M, Kim K, Zorlutuna P, Kim SB, Nikkhah M, Khabiry M, Azize M, Kong J, Wan KT, Palacios T, Dokmeci MR, Bae H, Tang XS, Khademhosseini A. Carbon-nanotube-embedded hydrogel sheets for engineering cardiac constructs and bioactuators. ACS nano. 2013;7:2369–80. doi: 10.1021/nn305559j. [DOI] [PMC free article] [PubMed] [Google Scholar]
- 34.Bartosh TJ, Ylostalo JH, Mohammadipoor A, Bazhanov N, Coble K, Claypool K, Lee RH, Choi H, Prockop DJ. Aggregation of human mesenchymal stromal cells (MSCs) into 3D spheroids enhances their antiinflammatory properties. Proceedings of the National Academy of Sciences of the United States of America. 2010;107:13724–9. doi: 10.1073/pnas.1008117107. [DOI] [PMC free article] [PubMed] [Google Scholar]
- 35.Radisic M, Malda J, Epping E, Geng W, Langer R, Vunjak-Novakovic G. Oxygen gradients correlate with cell density and cell viability in engineered cardiac tissue. Biotechnology and bioengineering. 2006;93:332–43. doi: 10.1002/bit.20722. [DOI] [PubMed] [Google Scholar]
- 36.Li X, Liu X, Tan Y, Tran V, Zhang N, Wen X. Improve the viability of transplanted neural cells with appropriate sized neurospheres coated with mesenchymal stem cells. Medical hypotheses. 2012;79:274–7. doi: 10.1016/j.mehy.2012.05.010. [DOI] [PubMed] [Google Scholar]
- 37.Beauchamp P, Moritz W, Kelm JM, Ullrich ND, Agarkova I, Anson BD, Suter TM, Zuppinger C. Development and Characterization of a Scaffold-Free 3D Spheroid Model of Induced Pluripotent Stem Cell-Derived Human Cardiomyocytes. Tissue engineering Part C, Methods. 2015 doi: 10.1089/ten.TEC.2014.0376. [DOI] [PubMed] [Google Scholar]
- 38.Garipcan B, Odabas S, Demirel G, Burger J, Nonnenmann SS, Coster MT, Gallo EM, Nabet B, Spanier JE, Piskin E. In Vitro Biocompatibility of n-Type and Undoped Silicon Nanowires. Adv Eng Mater. 2011;13:B3–B9. [Google Scholar]
- 39.Tolli MA, Ferreira MP, Kinnunen SM, Rysa J, Makila EM, Szabo Z, Serpi RE, Ohukainen PJ, Valimaki MJ, Correia AM, Salonen JJ, Hirvonen JT, Ruskoaho HJ, Santos HA. In vivo biocompatibility of porous silicon biomaterials for drug delivery to the heart. Biomaterials. 2014;35:8394–405. doi: 10.1016/j.biomaterials.2014.05.078. [DOI] [PubMed] [Google Scholar]
- 40.He Y, Fan C, Lee S. Silicon nanostructures for bioapplications. Nano Today. 2010;5:282–95. [Google Scholar]
- 41.Beauchamp P, Choby C, Desplantez T, de Peyer K, Green K, Yamada KA, Weingart R, Saffitz JE, Kleber AG. Electrical propagation in synthetic ventricular myocyte strands from germline connexin43 knockout mice. Circulation research. 2004;95:170–8. doi: 10.1161/01.RES.0000134923.05174.2f. [DOI] [PubMed] [Google Scholar]
- 42.Beauchamp P, Desplantez T, McCain ML, Li W, Asimaki A, Rigoli G, Parker KK, Saffitz JE, Kleber AG. Electrical coupling and propagation in engineered ventricular myocardium with heterogeneous expression of connexin43. Circulation research. 2012;110:1445–53. doi: 10.1161/CIRCRESAHA.111.259705. [DOI] [PMC free article] [PubMed] [Google Scholar]
- 43.Vreeker A, van Stuijvenberg L, Hund TJ, Mohler PJ, Nikkels PG, van Veen TA. Assembly of the cardiac intercalated disk during pre- and postnatal development of the human heart. PLoS One. 2014;9:e94722. doi: 10.1371/journal.pone.0094722. [DOI] [PMC free article] [PubMed] [Google Scholar]
- 44.Sekine K, Kagawa Y, Maeyama E, Ota H, Haraguchi Y, Matsuura K, Shimizu T. Oxygen consumption of human heart cells in monolayer culture. Biochemical and biophysical research communications. 2014;452:834–9. doi: 10.1016/j.bbrc.2014.09.018. [DOI] [PubMed] [Google Scholar]
- 45.Hoyt RH, Cohen ML, Saffitz JE. Distribution and three-dimensional structure of intercellular junctions in canine myocardium. Circulation research. 1989;64:563–74. doi: 10.1161/01.res.64.3.563. [DOI] [PubMed] [Google Scholar]
- 46.Cho HJ, Lee HJ, Chung YJ, Kim JY, Cho HJ, Yang HM, Kwon YW, Lee HY, Oh BH, Park YB, Kim HS. Generation of human secondary cardiospheres as a potent cell processing strategy for cell-based cardiac repair. Biomaterials. 2012 doi: 10.1016/j.biomaterials.2012.10.011. [DOI] [PubMed] [Google Scholar]
- 47.Lee WY, Wei HJ, Wang JJ, Lin KJ, Lin WW, Chen DY, Huang CC, Lee TY, Ma HY, Hwang SM, Chang Y, Sung HW. Vascularization and restoration of heart function in rat myocardial infarction using transplantation of human cbMSC/HUVEC core-shell bodies. Biomaterials. 2012;33:2127–36. doi: 10.1016/j.biomaterials.2011.11.059. [DOI] [PubMed] [Google Scholar]
- 48.Kelm JM, Djonov V, Hoerstrup SP, Guenter CI, Ittner LM, Greve F, Hierlemann A, Sanchez-Bustamante CD, Perriard JC, Ehler E, Fussenegger M. Tissue-transplant fusion and vascularization of myocardial microtissues and macrotissues implanted into chicken embryos and rats. Tissue engineering. 2006;12:2541–53. doi: 10.1089/ten.2006.12.2541. [DOI] [PubMed] [Google Scholar]
- 49.Don CW, Murry CE. Improving survival and efficacy of pluripotent stem cell-derived cardiac grafts. Journal of cellular and molecular medicine. 2013;17:1355–62. doi: 10.1111/jcmm.12147. [DOI] [PMC free article] [PubMed] [Google Scholar]
Associated Data
This section collects any data citations, data availability statements, or supplementary materials included in this article.
Supplementary Materials
Figure S1. Viability analysis of spheroids using TUNEL staining. (A) TUNEL staining of the frozen sections of NC and WCD spheroids at day 7. Blue – DAPI; Green-TUNEL (apoptosis marker). (B) Quantification of viability from TUNEL staining (viability: blue colored area is divided by total colored area). NC – without e-SiNWs; WCD – with e-SiNWs. Error bars represent standard deviation. Scale bars: (A) = 100 μm.
Figure S2. Specificity of immunofluorescent staining of Cx-43 and COX IV. (A) Cx-43 (red) shows specific labeling at the cell junction of α-SA (green) stained 2D monolayer hiPSC-CMs. (B) Mitochondria staining of COX IV (green) for 2D monolayer hiPSC-CMs on gelatin-coated cover slips. Blue – DAPI. Scale bars: (A) = 20 μm; (B) =20 μm.
Figure S3. Immunofluorescent staining of α-SA/Cx-43 of the WCD-3k spheroid sections. Confocal imaging shows locations of α-SA (green) and Cx-43 (red) and e-SiNWs (yellow) in the WCD-3k spheroid sections. The α-SA and Cx-43 structures are not localized to regions close to e-SiNWs.
Figure S4. Immunofluorescent staining of N-Cad/Cx-43 of the WCD-3k spheroid sections. The white circles show the co-localization of Cx-43 (red) and N-Cad (green) surrounded in nuclei in the WC-D3k spheroids. Blue – DAPI.
Figure S5. The beat rate of the spheroid's spontaneous contraction is dependent on the temperature. The relationship between beat rate (BPM – beats per minute) and medium temperature. Error bars represent standard deviation.
Figure S6. Metabolic analysis of the WCD spheroids with different cell numbers per spheroid. Oxygen consumption rate for WCD-1k, -3k and -7k spheroids were measured using Instech Oxygen Consumption Chamber. WCD1k_30: 30 × WCD-1k spheroids, WCD1k_60: 60 × WCD-1k spheroids, WCD3k_30: 30 × WCD3k spheroids, WCD3k_60: 60 × WCD-3k spheroids, WCD7k_30: 30 × WCD7k spheroids.
Figure S7. Immunofluorescent staining of NC, WCD, and WCN-3k spheroids. Contractile protein (α-SA) and conductive protein (Cx-43) staining were performed after 7 days cell culture in spheroids without e-SiNWs (NC), with doped e-SiNWs (WCD), and undoped SiNWs (WCN).


