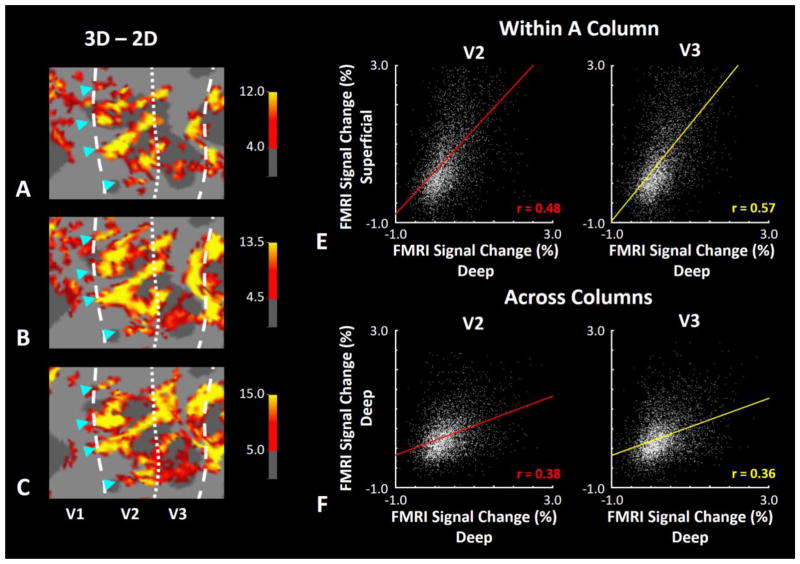
Figure 1.
Effect of depth variation in disparity-selective ‘thick’ stripes/columns in V2/V3 in one hemisphere. A–C, Disparity-selective activity in the superficial, middle, and deep cortical layers respectively. Asterisks highlight the location of stripes across different cortical depths (and layers). Despite some spatial distortion at superficial depth, maps remained similar across all the three cortical depths, consistent with radially extending (columnar) fMRI activity. Panel D shows the correlation of disparity-selective activity sampled across deep vs. superficial depths in V2 (left) and V3 (right). Panel E shows the analogous analysis along an orthogonal axis, sampled within a common (deep) depth/layer within V2 (left) and V3 (right). In both areas, application of Fisher’s method for comparing correlation coefficients showed that the correlation was significantly higher between activity sampled within columns compared with across columns (z>5.71, p<10−6), supporting the columnar organization in our BOLD maps (also see (Nasr et al., 2016)).

