

Abstract
Background
Nonhuman primates (NHPs) are a valuable research model because of their behavioral, physiological and neuroanatomical similarities to humans. In the absence of language, autonomic activity can provide crucial information about cognitive and affective states during single-unit recording, inactivation and lesion studies. Methods standardized for use in humans are not easily adapted to NHPs and detailed guidance has been lacking.
New Method
We provide guidance for monitoring heart rate and pupil size in the behavioral neurophysiology setting by addressing the methodological issues, pitfalls and solutions for NHP studies. The methods are based on comparative physiology to establish a rationale for each solution. We include examples from both electrophysiological and lesion studies.
Results
Single-unit recording, pupil responses and heart rate changes represent a range of decreasing temporal resolution, a characteristic that impacts experimental design and analysis. We demonstrate the unexpected result that autonomic measures acquired before and after amygdala lesions are comparable despite disruption of normal autonomic function.
Comparison with Existing Methods
Species and study design differences can render standard techniques used in human studies inappropriate for NHP studies. We show how to manage data from small groups typical of NHP studies, data from the short behavioral trials typical of neurophysiological studies, issues associated with longitudinal studies, and differences in anatomy and physiology.
Conclusions
Autonomic measurement to infer cognitive and affective states in NHP is neither off-the-shelf nor onerous. Familiarity with the issues and solutions will broaden the use of autonomic signals in NHP single unit and lesion studies.
Keywords: autonomic measurement, pupil size, pupillometry, heart rate variability, nonhuman primate, behavioral neurophysiology, neuropsychology, methods, experimental design, frequency domain analysis, time domain analysis, arousal, cognitive state, affective state
1. Introduction
Autonomic outputs controlled by the central nervous system, like neurosecretory and neuroendocrine outputs, are types of motor output that are often overlooked by behavioral neurophysiologists and many other behavioral scientists. Relative to skeletal and oculomotor outputs, which are readily observable, autonomic outputs are largely covert and often occur in the absence of conscious awareness. Because autonomic measures provide information on the internal state of an organism, and can be quantified, they remain valuable tools nearly a century after their initial validation in humans (1). The interpretation of autonomic outputs, however, remains controversial (2). Inferred internal states and associated behavioral consequences vary among studies and have included veracity (2, 3), valence (4), reward (5, 6), surprise (7), attention (8), vigilance (9), arousal (10, 11), anxiety (12, 13), impulse control and emotional clarity (14), and cognitive performance (15–18). Some of these states have been grouped into the regulation and expression of emotion (19–21). Because they provide a window into emotion regulation and expression, autonomic measures have been an important avenue for understanding cognitive and social aspects of special human populations, e.g., older adults (22, 23), individuals with intellectual disabilities (24, 25), or autism spectrum disorder (26–29), psychiatric populations (30), and unresponsive (minimally conscious) patients (31).
Despite this interest in the autonomic nervous system as a surrogate for emotion, the primary role of the autonomic nervous system is homeostasis. The mammalian autonomic nervous system is far more complex and dynamic in its architecture by comparison to other vertebrates. Sympathetic and parasympathetic control is antagonistic for some organ functions, for example adjustment of pupil size, vasomotor regulation and heart rate (HR) (32). Yet, these two divisions of the autonomic nervous system can also operate in various coordinated ways (32). The mammalian diving reflex is one example of a complex and coordinated autonomic reflex (33). Autonomic control is hierarchical in that local reflexes may be modulated by inputs from cortical and brainstem structures, as well as by circulating hormones (34). Autonomic activity has numerous physiological effects, many of which, either directly or indirectly, produce effects on the CNS. Thus, autonomic control is bidirectional between the nervous system and organs. The autonomic responses driven by the central nervous system, often termed centrally mediated autonomic responses, form the basis of using autonomic activity to assess affective state (35). Although it is generally agreed that autonomic activity is influenced by affective and cognitive behaviors (35), there is little consensus over the degree to which autonomic response patterns reflect specific emotional events in humans, if they do so at all (20). Studies in nonhuman animals may provide a way to address the central control of patterned responses.
Surrogate measures of attention, emotion and decision making have enormous importance to basic and translational research. These measures provide opportunities to use animal models, especially nonhuman primates (NHPs), to dissect neuronal mechanisms of emotion and investigate potential therapeutics. Genetic (36), anatomical (37, 38) and physiological (39–42) similarities between humans and NHPs offer strong evidence that similar mechanisms are at play. In NHPs, autonomic measures additionally provide a useful means to understand the animal’s state beyond overt skeletomotor responses, such as button presses or licking behavior (43). Indeed, when verbal, declarative responses and self-reports are unavailable, as is the case in animals and some patient groups, autonomic measures are all the more valuable as an index of internal state.
Differences in anatomy, behavior, and experimental design pose unique challenges for the acquisition and analysis of autonomic data from NHPs. Two autonomic measures, pupil size and HR, are being used increasingly in NHP studies as indicators of affective responses (9, 10, 44). Based on our experience using these techniques, our objective here is to provide background and guidance for researchers planning to use these measures in NHPs in the context of controlled neuropsychological and behavioral neurophysiological experiments. Software based tools for the methods we describe are open-access and available at: ftp://helix.nih.gov/lsn/autonomics/
2. Animal procedures
The experimental aims, methods, and results of our original studies have been described in detail elsewhere (45, 46). Here we present unpublished data from these same studies to provide guidance for acquisition of autonomic measures in NHP. All experimental procedures were performed in accordance with the ILR Guide for the Care and Use of Laboratory Animals and were approved by the Animal Care and Use Committee of the National Institute of Mental Health. Procedures adhered to applicable United States federal and local laws, regulations and standards, including the Animal Welfare Act (AWA 1990) and Regulations (PL 89-544; USDA 1985) and Public Health Service (PHS) Policy (PHS 2002).
3. Measuring affective influences on pupil size
3.1. Physiology
Pupil size is regulated by the opposing musculature of the iris: the sphincter and the dilator. The sphincter constricts the pupil under tonic parasympathetic control and the dilator enlarges the pupil under sympathetic control. Changes in pupil diameter are dominated by a short-latency pupillary light reflex (PLR). Light-driven neural activity is transmitted through the optic nerve to the Edinger-Westphal nuclei, which supply the parasympathetic component of the oculomotor nerve bilaterally. Brighter environmental conditions drive consensual constriction of the pupils through oculomotor nerve control of the pupillary sphincters. Pupil size is logarithmically related to the intensity of the photic stimulus. Reflex latency is variable from subject-to-subject, and is limited primarily by sphincter muscle mechanics. The temporal characteristics of the response are species dependent; rhesus monkeys (Macaca mulatta) generally have faster dynamics than humans (40). In either species, any change in lighting, including those produced by eye movements, will require hundreds of milliseconds to settle. The impact of stabilization of the PLR on experimental design will be discussed in more detail in Section 3.3. The dynamic sensitivity of the PLR change depends upon pupil size over a wide range of pupil sizes, which reflects the physiology and mechanics of the opposing pupillary muscles (47). Spontaneous pupil size changes (called “hippus”) are the result of essentially Gaussian neuronal noise shaped by the muscle mechanics (47). Although the mechanics are pupil size dependent, hippus occurs even under isoluminant conditions. The PLR can also be unstable, showing a rise in either phase sensitivity or amplitude sensitivity near onset of oscillation (48).
When driven by emotional or cognitive stimuli, the amount and direction of pupil size change depend on context. For example, dilation can occur with pleasure and constriction with displeasure (49), but dilation can be also be associated with arousal or asymmetrically dependent on valence (50).
NHP models have been used to improve our understanding of the neural mechanisms that drive these emotional or cognitive responses in humans. Although neuroanatomical differences exist between humans and, for example, rhesus monkeys, the two species are remarkably similar when comparing autonomic responses and brain activity (e.g., (51) vs (45)). Phasic pupil responses are associated with the P300 event-related scalp potential (52), which is driven by cortical projections of the locus coeruleus norepinephrine system(53, 54). A likely integration point of limbic signaling that can drive both the norepinephrine system and sympathetic nervous system is the nucleus paragigantocellularis of the medulla (53).
Many physiological considerations for pupillometry are also similar between humans and NHPs. When trying to resolve emotional and cognitive modulation of pupillary responses from the background of photic-related responses, certain issues are paramount. These photic-related considerations include: 1) dark adaptation, 2) an individual’s brightness response, 3) an individual’s color sensitivity, and 4) brightness sensitivity as a function of retinal coordinates.
As for color, some human subjects may have deficiencies in the perception of color. In our recent NHP work (45, 55), we used at least one set of monochrome stimuli that are of relative equal luminance instead of generating separate color sensitivity curves. However, color sensitivity curves can be determined using random luminance modulation (40, 56). Both humans and NHPs have different brightness sensitivity to images depending on retinal position (nasal vs temporal) and eccentricity (39, 57). More centrally located stimuli have the strongest effect.
Other physiological factors, for example, natural spontaneous fluctuations in pupil size and luminance changes due to microsaccades, can affect the pupil size. We have not noticed these effects in our averaged trial data, but studies that rely on single-trial pupil responses may need to consider more careful control of these variables.
3.2. Recording considerations
Most issues associated with recording and analyzing pupil data in NHPs parallel those of human studies. The most common apparatus for recording pupil size is video camera recording, usually with infrared sensitive cameras that require subjects to be in testing environments with low levels of illumination (e.g., (58)). Pupil size measurement is integral in some and optionally available in other commercial gaze tracking systems. Various algorithms are used, mostly aimed at modeling the observed pupil as an ellipse or “blob” (59, 60). Remarkably, only some vendors provide a pupil size signal that compensates for errors associated with eccentric gaze angles (pupil foreshortening error, PSE). Relative to central fixation, PSE increases as viewing distance gets shorter and gaze angle increases (61). PSE can exceed 14% of the measured pupil size under typical experimental conditions, so correction may be necessary (61).
‘Tracking performance’—the ability for a system to provide uninterrupted pupil and gaze measurements—varies widely among different eye measurement systems. Tracking loss can result from changes in lighting conditions in the visible or infrared spectral regions, reflections from objects in the environment, blinks or other eyelid interference, mechanical instability, or an oblique camera position relative to the gaze angle. As we discuss later, it is essential to identify loss of pupil tracking, and to either correct or omit the affected data. Not all gaze tracking systems provide unambiguous indicators of tracking loss. Successful camera-based tracking relies on a stable image of the eye. In human work, head-mount tracking provides a stable platform. These systems can be adapted for use with NHPs (62). On the other hand, “bite plates” or chin rests used in human work are not generally applicable to NHPs. NHPs require some method to limit head movement, either with the aid of surgical implants that are well tolerated (63), use of a noninvasive head holder (4, 64, 65), or through behavioral training (66). High speed/high resolution video systems can capture both eyes and, in some systems, part of the face for head position compensation over a limited range of head movement.
Fig 1 shows a brightness curve from a NHP, trained to fixate a central red dot, using a relatively simple approach. After 30 minutes of dark adaptation, pupil size is measured with the background gray level of the screen set to zero (black). The central fixation point brightness is randomly varied over about 50 trials. The group of measurements is repeated at 4 additional (increasing) background gray levels, allowing a few minutes of adaptation between background level changes. Those data collected with the screen entirely off (both background and fixation point off) are assigned to the first data point on the abscissa. Those data where the fixation point and background are indistinguishable at the maximum background brightness are discarded. A least squares sigmoidal fit can be used to estimate the center of the screen brightness curve (Fig 1). The median brightness of experimental testing should be close to this center point to maximize the dynamic range of responses. Note that the relatively small standard deviations around data points in Fig 1 show that the brightness of the background, rather than that of the dot, dominates the PLR under these conditions.
Fig. 1. NHP brightness curve.

A NHP received rewards for fixating a small central red dot. After a 30-min dark adaptation, fixation dot brightness was randomly varied across 47– 50 trials for each of 5 background brightness levels. Abscissa values are 8-bit gray levels. “OFF” are trials where both background and fixation point pixels were off; they are assigned an arbitrary value of 1. Only 10 trials were retained for the gray level of 200 because not all contrast values allowed fixation. Error bars are +/− 1 SD. Data are fitted to a sigmoid using least square error. Each trial was 3.4 to 3.8 s in duration with a minimum of 10 s between trials. Trials were initiated by the monkey. Pupil size was measured 0.5 s after the start of fixation to assure stability of the PLR.
We control for retinal position in our experimental designs by enforcing central fixation of visually presented images. In addition, we control for brightness changes at the central location by using images that have relatively uniform brightness. “Scrambled” images with relatively uniform brightness are sometimes used as a control (67), but we caution that these images may have sufficient local variation to drive small PLRs indistinguishable from affective pupillary responses.
3.3. Experimental design considerations
In human studies, because a relatively large number of subjects (n) is typically used, individual differences in visual system performance may have little impact on the reported measures. NHP studies, which typically have an n of 2 or 3, must be treated differently. When working with a small n, it is advisable to characterize the brightness sensitivity in each subject to avoid ceiling or floor effects, since transient pupil constriction as a function of light intensity is sigmoidal (39). Once an operating point is established, individual differences in sensitivity and day-to-day lighting variation is managed during the analysis by using one or more methods of normalization (see Normalization).
We draw from two recent studies that inform issues and solutions pertaining to experimental design (45, 55). Successful experimental design contrasts autonomic responses under different experimental conditions while controlling for PLR responses. In the first study (45), monkeys (Macaca mulatta) sat in a test cubicle, which was dark save for illumination provided by a monitor screen. Monkeys received a small reward for fixating a red spot that appeared inside of a gray rectangle at the start of each “fixation trial” (Fig 2). Fixation trials lasted 4 s with variable intertrial intervals of 4–6 s. Pavlovian conditioning trials were superimposed on the fixation trials. Specifically, the gray rectangle was tilted to either the right or left to signal reward or not, and the trials could occur before, during, or after the fixation trial (Fig 2, top row). Reward was paired with tilt in only one direction. This reward was larger than the fixation reward and not contingent on fixation. The tilt-related (Pavlovian) reward was delivered after a 500-ms trace period (45). Another configurational change of the gray rectangle was used for the same task (Fig 2, bottom row). In this case, the central 1/3rd of the rectangle shifts to the left or right. Only one direction is rewarded.
Fig. 2. Stimuli with equal relative luminance in an affective task.
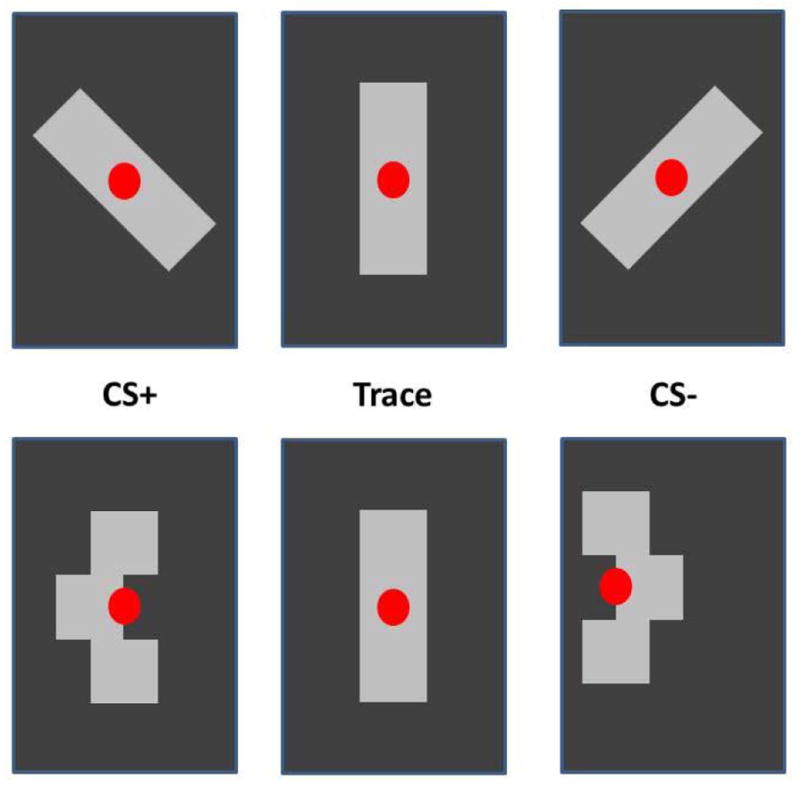
Two sets of stimuli used in a Pavlovian conditioning task. All figures have the same relative luminance. The top row uses the tilt of the stimulus to signal CS+ or CS−. The bottom row uses a central shift. The neutral position is the same for both sets of stimuli and remains on the screen during the trace period. The neutral position is maintained until a reward is delivered. Then, the red fixation spot is turned off for 4 to 6 s (intertrial interval). A new trial is signaled by the illumination of the fixation spot. The equal luminance across stimuli minimizes PLR on stimulus changes. All stimuli are novel at the start of testing. Only CS+ stimuli predicted the delivery of a reward.
Using the isoluminant set from Fig 2 we were able to show that the direction of configurational change associated with reward delivery produces a significantly different change in pupil size compared to the unrewarded configuration (Fig 3B). Thus, isoluminant stimuli are a helpful tool for studying task conditions without the need to measure color sensitivity. Other visual tasks can be designed to manage the dynamic component of the PLR in a different way. In our experiment, all conditions had matched PLRs as witnessed by the initial overlap of both curves in Fig 3B. Alternatively, events that might evoke a PLR, such as large eye movements, can be followed by sufficient time to allow the PLR to stabilize. Periods of 200 to 300 ms may be sufficient under some lighting conditions, including those used here, which used periods of 200–500 ms to stabilize the PLR. However, periods of 1,000 ms or more may be necessary. It is best to measure the mean pupil response across a group of trials for each subject under the expected lighting conditions and adjust task timing to allow sufficient time for PLR stabilization.
Fig. 3. Using isoluminant images for management of PLR responses.

(A) Percent change in pupil size in anticipation of different amounts of reward. Two visual stimuli are presented prior to the choice (at time 0), each one offering a different amount (0 to 0.8 ml) of water or juice. Note that this plot shows events well after the PLR has settled. The separation of the traces seen on the left reflects reward expectation differences during viewing, just prior to choice. Responses are shown for stimulus Set 1, the isoluminant gray images. Stimulus Set 2 is a color set to test spatially uniform cues. (B) Percent change in pupil size following onset of cues that predict fluid reward (CS+, blue trace) and cues that predict no reward (CS−, red trace), using the isoluminant figures shown in Fig 2. Shaded area on each trace shows the standard error of the mean. The image on the screen changes configuration at time = 0. The configuration identified as ‘Trace’ (the middle configuration in Fig 2) remains stable throughout the trace period of this plot. Reward is delivered after the trace period. The nearly identical initial change in response to the CS+ and CS− (0 to 500 ms) shows that the configurational shift produces a nearly identical response regardless of the direction of the change. Careful management of the PLR yields robust and repeatable pupil changes (time > 500 ms) that reflect the monkey’s reaction to the likelihood of an upcoming reward.
When the experimental design is more complex, it may be impossible to rely on gray-level isoluminant stimuli with small configurational shifts. In our second study that used pupil size as a measure of emotional state, we combined a color stimulus set with a monochrome isoluminant set (Fig 3A). The color stimuli were of similar brightness, but were not necessarily matched to the color sensitivities of individual subjects (55) or the apparent luminance of the stimuli. The isoluminant gray scale set provided a control for these features, while the color set provided control for spatial cues. Here we were able to show that pupil size discriminated the different amounts of reward associated with the stimuli, not simply whether the monkey was going to receive any reward.
The last experimental design consideration addressed here is management of the potentially different time courses of pupil response and single unit activity. Fig 4A shows a neuron in the orbitofrontal cortex (OFC) with responses that segregate into three separate groups as a function of expected reward amount well before the reward is delivered (46). Fig 4B shows contemporaneously recorded pupil responses that do not show a similar segregation until around the time of reward, although some reward size effects are apparent earlier, likely driven by reciprocal connections between OFC and LC (53). The 500 ms choice period (Choice to Reward) was selected to allow evolution of a pupil response prior to reward delivery. How much of the pupil response occurring after reward delivery should be assigned to the choice event is an empirical question. The possibility that pupil responses may require more time to unfold than single unit responses should be considered. Some studies use a variable period before reward, which allows greater separation on at least some trials. An alternative is to test longer inter-event periods towards the end of training, but prior to electrode/chamber implantation and recording.
Fig. 4. Simultaneously recorded neural activity and pupil size.

(A) Raster plots are sorted by chosen amount of reward and both spike-density functions and raster plots are color coded by reward amount. Note the wide segregation of neuronal responses by reward size well before reward delivery. (B) Mean pupil size (+/− SEM) recorded in the same session with the single unit shown in part A. Reward sizes are color coded by reward amount. Note the wide segregation of pupil responses by reward size around time of reward delivery. The 500 ms pre-reward (“choice”) period is used to separate pupil changes related to anticipation of reward from pupil changes that may be better associated with reward delivery. PLRs occur earlier in the trial and are not shown.
3.4. Longitudinal studies
Certain problems arise when making comparisons of autonomic responses across days, weeks or months in longitudinal studies. In our case, we examined behavioral performance and autonomic responses before and after an excitotoxic amygdala lesion in a single unit recording study aimed at identifying the amygdala’s contributions to reward-value coding in the prefrontal cortex (46). Changes in autonomic function have been observed in human patients following amygdala lesions (68). We found that amygdala lesions produced a transient (4–6 w) disruption of pupil response to reward-predicting images. After that initial postoperative phase, however, task-dependent changes in pupil size were indistinguishable from those recorded before bilateral neurotoxic amygdala lesions, indicating that the pupil reflex physiology was relatively unaffected. Notably, pupil size as we measured it is a relative measure, so if there is a tonic change in autonomic state, this may be masked by the normalization process outlined above. Unlike the case for pupil diameter, we found lesion-related changes in the autonomic regulation of HR (taken up in a later section), potentially because HR is a stochastic point process that does not require normalization.
Another consideration for longitudinal, within-subject design is the impact of time on equipment. Most display technologies (e.g., cathode ray tube (CRT), backlit liquid crystal display (LCD)) lose brightness over time. Industry figures often cite brightness reduction after 10,000 hours of operation (typically 3 – 4 years of regular use). Brightness can reduce to 50% for CRTs and 20% for backlit LCDs. Loss accelerates with age, so previously used equipment will change output more rapidly. Replacement of failed equipment (monitor or video cards) can introduce a shift in brightness part way through an experiment. Purchasing two video monitors and having a spare, exactly matching, video card are reasonable precautions. The video monitor can be replaced immediately after the intervention (e.g., lesion) to recapitulate changes that occur in the first phase of the experiment. One elegant solution is to track and adjust monitors using a spectroradiometer designed for measuring the luminance of a computer display. Simpler methods may be adequate, but all require planning ahead.
3.5. Pupil data acquisition and processing
Although each researcher is likely to use a somewhat different approach, here we provide a step-by-step description of how to acquire and process task-based pupil size measures. Physiological records are unpublished data from a recent study (55). Pupil size was measured at 60 fps using an infrared camera based system (ViewPoint PC-60, Arrington Research, Scottsdale, AZ). This system provides analog outputs via a D/A converter. These outputs were low-pass filtered (4 pole Bessel) with a corner frequency (cutoff) of 140 Hz, then digitized at 1000 samples/s and stored along with event markers and thresholded segments of single-unit spike potentials on a 32-channel Multichannel Acquisition Processor (MAP, Plexon Inc., Dallas, TX). The pupil analysis tool chain was developed around our existing data analysis tool for behavioral neurophysiology: MatOFF (69), written in MATLAB (Mathworks, Natick, MA, USA). Pupillary data must be processed to remove noise, remove blink artifacts and otherwise ensure data quality. Because the goal of MatOFF, like all other behavioral analysis programs, is to find and characterize associations with behavioral events, we carry out most of this processing across entire recording sessions before the behavioral analyses. In addition, we have automated the processing sequence. Processing before identifying which epochs are associated with which behavioral events, as well as automating the procedure, blinds the experimenter to the behavioral condition and thus reduces experimenter bias. Further, this approach also treats the recording as a continuous block, potentially reducing artifacts that may arise from segmentation. Processing an entire recording session at once also simplifies global calculations such as mean pupil size. For the above reasons, we use our own extension to the Client Development Kit (CDK) supplied by Plexon. The desired analog channel data are read from a .PLX file via the CDK, processed in MATLAB, and then output to a .MAT file. Our extension to the CDK allows us to read the resulting .MAT file using the same command structure as reading .PLX files. The only difference seen by subsequent MATLAB analysis programs is analog channel number. Data can be drawn conveniently from either the raw record or pre-processed data, without regard to the data file format. We call channels stored as .MAT files “external” data. Thus, reading an analog channel from a .PLX file uses plx_ad.m (reads raw data from Plexon file), while reading a processed (external) analog file uses external_plx_ad.m (reads a .MAT file). The same argument list is used for either function call. For convenience and to automate the selection of which function to call, external channel numbers never overlap with raw data channel numbers. The use of external analog data files is a very general approach. It avoids duplicating the raw data and never risks writing to the original data file. It allows pre-processing of any or all channels in a format that simply mimics the original analog data.
The first external analog channel for pupil size data implements noise reduction. There are different types of contamination possible with video-derived eye-tracking signals. Some of our data were contaminated with a video refresh signal (Fig 5, blue trace). Noise was removed (Fig 5, red trace) by convolution using a Savitzky-Golay FIR filter (window size = 11 samples at 1 ms/sample). Other noise sources may require different filter methods. Whatever filter method is chosen, however, it should minimize frequency-dependent phase shifts to prevent the introduction of timing errors. The Matlab filtfilt function can be helpful in this regard.
Fig. 5. Pupil processing steps.

(A) High frequency noise and video quantization noise are removed from the pupil-size signal with a Savitzky-Golay FIR filter (2nd order, window size = 201 samples at 1 ms/sample) to provide a smooth interpolation at 1-ms intervals. Raw signal is shown in blue, filtered signal in red. (B) Automatic blink- extraction algorithm demonstrated on the pupil-size signal. Blue trace is the pupil signal with drops to zero (minimum signal limit) during blinks. Each blink is isolated by a time window that surrounds the steep transitions of the blink. A step-by-step walk outwards from the center point between transitions locates the return to baseline (red dots). Baseline is calculated from samples early and late in the window. The two baselines are connected with linear interpolation (green line).
The next essential step is blink extraction. Blinks are the most common artifact in pupil data and many experimental results hinge on records where blinks must be removed. They are usually much faster than the pupil size changes tracked during behavioral experiments; accordingly, the goal is to chop out the blink period and interpolate across the resulting gap. We use an algorithm that locates the beginning and end of a blink based on a combination of XY eye position and pupil size data. This blink detection leverages an option in the ViewPoint eye-tracking system that generates a maximum (or minimum, depending on setting) analog output signal value on the X, Y and pupil-size channels when eye tracking is lost. After the blink, the pupil signal returns to baseline quickly, while the eye-position signals remain at the limit position for up to 50 ms as position tracking is re-established. For our purposes, blink events separated by less than 50 ms are combined into a single blink. Alternative methods for blink detection have also been described in the literature (70).
The Matlab-based blink detector searches for blinks by first looking at the X and Y gaze signals for extreme values. A large window (epoch) of pupil data is selected to encompass the blink event and surrounding pupil data. A simple thresholding approach to finding the beginning and end of a blink was not effective, because large eye movements around the time of a blink will produce false hits. Thus, the program carefully tracks the rise and fall of the pupil signal during a blink using the following procedure. The program marches outward from the middle of the blink window until it locates a large slope (negative slope earlier in time, positive slope later in time). The large slope is characterized by large sample value differences between adjacent sample points, a parameter that is adjusted to match the anti-alias filter time constant on the pupil channel. The stepwise algorithm then identifies the beginning of small steps characteristic of a return to near baseline values. The stepwise process ends when the values are sufficiently near (within the noise level) to the baseline of pupil data. The baseline is calculated from a group of samples selected from data early (or late) in the window. Analog data between these end points (blink start, blink stop) is replaced with a linear interpolation. Two new external analog channels (as described earlier) are created as the blinks are located and filtered. One channel is the new pupil data with blinks removed (de-blinked pupil record), and the other channel (blink marker) has only two values that distinguish between recorded pupil data and interpolated data. Blink markers can be processed in parallel with the de-blinked pupil records to build statistics about the possible correlation of blink characteristics (e.g., frequency, duration and timing) with other experimental events. Unusual blink events can also be flagged for later inspection. The blink extraction algorithm can be robust, but we have found outliers in our data, for example, when a large saccade occurred immediately before or after a blink. These rare outliers were discarded..
Following the initial signal processing of a complete session, the eye position and pupil size data are down-sampled from 1,000 Hz at an integer multiple of 20 to a sample rate of 50 Hz and stored in a MatOFF database (69).
3.6. Normalization
Although pupil size can be used as an absolute metric, accurate measurements require knowing the exact geometry of the camera relative to the eye. Precision requires consistency across recording sessions, and requires careful attention to lighting and display brightness to control for the PLR. Combining data across subjects requires a method to scale individual psychophysical differences. A common practice to manage individual differences, either for averaging or for comparison, is some form of pupil size normalization, usually referencing or base-lining the pupil size to a particular experimental condition or particular moment in each trial. We chose to normalize across single recording sessions, where the subject and the lighting conditions are stable (Fig 3A). Normalization can be in percent (or fraction) of pupil change relative to the baseline period, sometimes using all the baseline periods averaged across a session (45, 71). In our case, we designed the experiment to have a stable baseline period to normalize each trial individually. As an alternative to percent change in pupil size, pupil size changes can be translated into Z scores (10, 54). Other approaches to normalization are possible. Some authors have counted the number of pupil-size change events using a percentage size change to define the event (54, 72).
One major drawback of baseline averaging is the possibility of masking responses by ignoring certain characteristics of pupil control. When comparing responses under non-isoluminant conditions, the pupillary size change should be scaled to the static gain characteristics of the subject. There are several ways to estimate or measure this relationship (47). After scaling, or under isoluminant conditions, hippus can be included in the response measure to improve sensitivity. For example, rather than measuring the response relative to an averaged baseline value, the response period can be divided into early and late phases. This method provides a trial-by-trial pupil size change that more faithfully follows baseline fluxuations of the pupil. This approach has been used to measure longer term changes in pupil size that are potentially linked to changes in arousal (73).
4. Measuring affective influences on heart rate
4.1. Physiology and experimental design
HR and heart rate variability (HRV) have a long mutual history of applications and methods (74–76). Like pupillary changes, changes in HR and HRV are thought to reflect cognitive (15, 16) and emotional states (14, 20, 23). HR and HRV, however, can be used to capture changes in emotional or cognitive states over a longer time period (minutes) than pupillary responses, which return to baseline within seconds after an event. HRV and pupillary responses may reflect different aspects of cognition or emotional state, since they are not always in concordance (20).
The autonomic physiology behind HRV is complex (77), especially in disease states, but the basic contributions of sympathetic and parasympathetic drive to HRV have been studied in detail (76, 78, 79). Under healthy physiological conditions, HR is established by specialized pacemaker cardiomyocytes of the sinoatrial node. Parasympathetic input via the vagus nerve decreases HR, while sympathetic fibers increase HR. Each autonomic input may have a tonic influence, so that HR can be modulated either by increased activity in one pathway or decreased activity in the other. Homeostatic control of HR is driven by a range of receptors, including cardiac and carotid stretch receptors, influenced by the hemodynamics of blood flow (stroke volume, peripheral resistance, etc.). HRV is most commonly measured by the time between QRS complexes of the electrocardiogram or the time between pulse pressure changes. Frequency analyses of changes in HR, e.g., changes in R-wave to R-wave (R-R interval) typically display separable low-frequency (LF) and high-frequency (HF) peaks. The more rapid dynamics of the acetylcholine-driven parasympathetic innervation of the sinoatrial node drives the HF energy distribution, whereas both sympathetic and parasympathetic probably contribute to spectral power in the LF range.
The important influences of behavioral factors on central control of HR have been recognized for some time (35, 80). NHPs provide a model for human HRV, but with important differences (42). Resting HR scales with body mass across many species (81). The HR of adolescent Macaca mulatta is about double that of a human counterpart (82). The faster HR puts physiological limits on HR acceleration. A faster HR may impact frequency resolution when comparing low frequency (LF) versus high frequency (HF) power spectral contributions in the frequency domain (42, 83). In general, frequency domain (e.g., Fourier transform) analysis is the most commonly used approach for measures of HRV. Fourier domain frequency resolution depends upon the inverse of the recording duration (84), which conflicts with trial-based experimental designs that rely on short recording epochs to maximize the number of behavioral trials in a session. The required frequency resolution will be impacted by the average HR and the degree to which that average rate is shifted by sympathetic and parasympathetic drive. The faster average HR of Macaca mulatta will reduce the required frequency resolution for the same percentage shift in HR. For example, 1% shift in a human resting HR of 70 bpm (0.7 Hz) is smaller than a 1% shift in a monkey resting HR of 130 bpm (1.3 Hz), potentially making the latter difference easier to detect.
4.2. Heart rate data acquisition and processing
Specialized electrocardiogram recording ECG amplifiers are helpful in the context of other electrophysiological recording. We employ Biopac (Goleta, CA) ECG (ECG100C) amplifiers with the matching IPS100c power supply and MAC110c leads. These amplifiers are compatible with thoracic impedance (EBI100C) and skin conductance response (SCR) units (GSR100C) to provide grounding paths between the units that do not attenuate SCR responses. These units are also suitable for human work in the context of other appropriate safety measures to mitigate shock hazards. (Electrical safety is beyond the scope of this discussion. The reader is advised to consult qualified experts regarding electrical safety during physiological recording.) Although the Biopac ECG amplifier has a restricted bandwidth, we chose to provide additional low-pass filtering (described later) to assure strong attenuation above 500 Hz (Nyquist criteria).
Except for rare individuals, humans do not have the hair covering seen in smaller NHPs (85). Effective surface ECG recordings in macaques require daily shaving to maintain an exposed patch of skin. To reduce the likelihood of removal by the monkey, surface ECG electrodes (Kendall Medi-Trace 530 Series Foam Electrodes, Covidien, Mansfield, MA) are placed only on the monkey’s back. Leads are placed over the bones of the rib-cage and scapula to limit electrical interference from muscle activity. Placements are varied from day-to-day to avoid irritating a single patch of skin, an important consideration when recordings are repeated over many months. Different placements can produce different signal waveforms, so processing must account for the day-to-day waveform differences. Some of the electrode placements may increase the respiratory artifact as evidenced in the baseline and amplitude fluctuations. These arise from shifts in the thoracic cavity and impedance changes at the electrode/skin interface. These signals can be advantageous for tracking respiratory rate, often a signal of interest. Other measures can be employed to stabilize electrodes, like wrapping the torso of the animal with elastic bandage (4).
Our recorded ECG signals are collected with the Plexon MAP system and managed with the Plexon CDK as described for eye data. Signals were low-pass filtered (4 pole Bessel) at 360 Hz, then digitized at 1000 samples/s. Digital signal processing is accomplished using the Matlab Signal Processing Toolbox. Before searching for R-wave events to calculate interbeat intervals, the respiratory signal is extracted from ECG baseline fluctuations (86). The power spectrum of respiration defines the high-frequency (HF) band of HR variability, which differs from that of humans (42). Most recordings provide robust ECG baseline shifts. We developed individual-specific normative frequency band information to apply on days where respiratory signals cannot be extracted (Fig 6). We used all recovered respiratory data from an individual before lesion to generate a power spectrum of respiration as a template. We made a separate template from all days where respiratory data was recovered after lesion. The templates were then used on those days were respiratory data could not be recovered.
Fig. 6. ECG processing steps.

(Top panel - ECG) The ECG signal is low-pass filtered at 360 Hz, then digitized at 1 kHz. X-axis in s with about 10 s of data shown (see bottom panel for scale). Y-axis is arbitrary units of signal amplitude. (Second panel – Bandpass filter) After the respiratory signal is recovered and removed by subtraction, the resulting signal is bandpass filtered from 10 to 50 Hz using a zero-phase filter with Matlab filtfilt function. (Third panel-- Beat detection) R-wave peaks are accentuated using a Hilbert transform, and then located with the Matlab findpeaks function. A red mark indicates each peak. (Bottom panel – Continuous estimate of HR) R-R intervals are linearly interpolated, yielding beats per minute, which is then treated as a continuous signal for further analysis.
For HRV measurement, the respiratory ECG baseline shifts are removed from the ECG signal as part of an initial band pass filtering (Butterworth bidirectional filter, 10 to 50 Hz). Isolating QRS complexes is a challenge for reasons that will be discussed shortly. R-wave peaks are identified from the QRS envelope using an older version of the Matlab findpeaks function that is a wrapper for DSPDATA.FINDPEAKS. Later versions of Matlab findpeaks fix an end-of-array edge effect that is not relevant to our dataset. These later versions are dramatically slower, although careful selection of MPH and MPD parameters might resolve the speed issue. After R-R interval extraction, the result is tested and tagged for visual inspection (Fig 6, third panel). Suspect R-R intervals are flagged automatically using a series of tests that were established based on vetted datasets. The vetted datasets came from epochs where every QRS complex was manually inspected to locate completely clean epochs. Once accepted, QRS peaks are interpolated with cubic splines to create a continuous record of HR (Fig 6, bottom panel).
As noted above, calculating instantaneous HR using R-R intervals is a more challenging task in NHPs than in humans because additional noise sources complicate QRS detection. Any untoward impedance variation with surface electrodes on hairy skin is exacerbated by shaking and quick movements; these movements are common in NHP even when the animal is comfortably seated and attending to a rewarding or engaging behavioral task. For tasks that have elements of surprise, like unexpected food rewards, disruptive movements may occur in concert with the event of interest, obfuscating relevant correlations. Another difficulty with NHP HR arises from the normal resting cardiac activity of a typical adolescent rhesus macaque (e.g., 5 to 9 kg in weight). In addition to the faster HRs typical for macaques relative to adult humans, our recordings show far more frequent transient arrhythmias (e.g., premature ventricular contractions, PVCs) than reported for healthy human subjects (87). The higher HR reduces the electrically quiet time between beats. This is a disadvantage for signal detection in the time domain. Further, PVCs produce neither typical cardiac output nor typical QRS signatures. Standard human software packages have been employed in NHP by others after careful inspection and editing of the HR records and corroboration with simultaneous impedance measurement (4). We chose, instead, to validate each step of ECG signal processing when comparing autonomic responses before and after ablation of the amygdala.
Whether or not commercial software is used, ECG signal processing begins with addressing signal quality. In our approach a signal envelope was first generated by applying a Hilbert transform to the squared differential of the ECG signal (88). Derived this way, the signal envelope accentuates rapid changes in the QRS complex for local peak detection. The goal is to make the slope between the R-waves and S-waves more salient, although regions of noise can create false positives. To differentiate QRS complexes from noise, and to preserve information from individual QRS complexes, we analyze the variance of QRS complexes. The peaks of the signal envelope provide references for locating local maxima of QRS complexes that correspond with R-wave peaks. Using local maxima, we align normalized individual QRS complexes and analyze their variance with principal components. Selecting principal components that explain 95% of the variance, we locate well-defined clusters of QRS complexes. The result is inspected to ensure that populations of similar QRS complexes are clustered together. To avoid the risks of full automation (i.e., unanticipated signal quality issues), all QRS-complex candidate clusters are reviewed first in principle component space, and then reviewed by waveform, before acceptance as QRS complexes. Reviewers are blind to the behavioral conditions. The algorithm selects the clusters for the most commonly represented QRS waveforms. This assumes that the majority of chosen waveforms are indeed QRS complexes, a condition that is verified both at the time of acquisition as well as at the beginning of analysis. After the algorithm produces clusters in principle component dimensions, the researcher has the option of adding or removing clusters by observing their waveforms. These vetted datasets and the hand-picked gold standard ones (discussed earlier) are used to build libraries. We plan to develop a fully automated approach based on these libraries. After QRS identification, instantaneous HR is calculated from the interval between R waves (Fig 6). Epochs of ECG with abnormal QRS complexes are tagged and excluded from further analyses.
A special issue arises in NHPs when experimental manipulation directly impacts autonomic function (see 3.4. Longitudinal studies). In our case, bilateral lesions of the amygdala (55) produced a persistent ~10% increase in HR in all three subjects (Fig 7). This change in heart rate reflects a tonic change in homeostatic control. Given this change, it is important to validate that HRV measures are comparable before and after the lesions. As part of that validation, we asked whether the systematic increase in HR was accompanied by autonomic changes that would interfere with frequency domain measures of HRV (i.e., LF vs HF peaks). Fig 8 is a result of that analysis. In two of the three animals (H and V), there was virtually no change in the peak frequency of LF or HF HR. In one monkey (N), the HF peak at 0.386 Hz was increased by 0.061 Hz (15.8%), which is further from the LF peak relative to the preoperative recordings. The LF peak frequency was stable in all three subjects. Notably, the HF peaks are around 0.3 to 0.4 Hz even though the respiratory rates are closer to 0.5 Hz. The frequency bands agree with a prior work in NHP (HF range 0.24 to 1.04 Hz) (4). We infer that the variability of parasympathetic drive is influenced by time delays in the parasympathetic reflex loops in addition to synchrony with respiratory drive. The influence of the reflex loop delay may explain why changes in HR are independent of any change in the LF/HF ratio. This is the first demonstration that amygdala lesions produce tonic changes in HR. These findings are all the more robust, as HR measurements were taken in identical settings in the context of an experimental design explicitly intended to compare preoperative and postoperative measures (e.g., a pre-post design). Although changes in blood pressure responses in anticipation of affective stimuli have been reported after amygdala lesions in marmosets (44), no changes in HR were reported, potentially due to the higher HR of marmosets (300–350 bpm). Our results therefore suggest that removal of the amygdala leads to a tonic increase in sympathetic tone, either by increasing sympathetic drive or by decreasing parasympathetic drive. This change may be caused by changing the balance of inhibition/excitation in central autonomic control centers such as the hypothalamus and periaqueductal gray matter (89).
Fig. 7. Changes in average HR following bilateral amygdala lesions in three macaques.
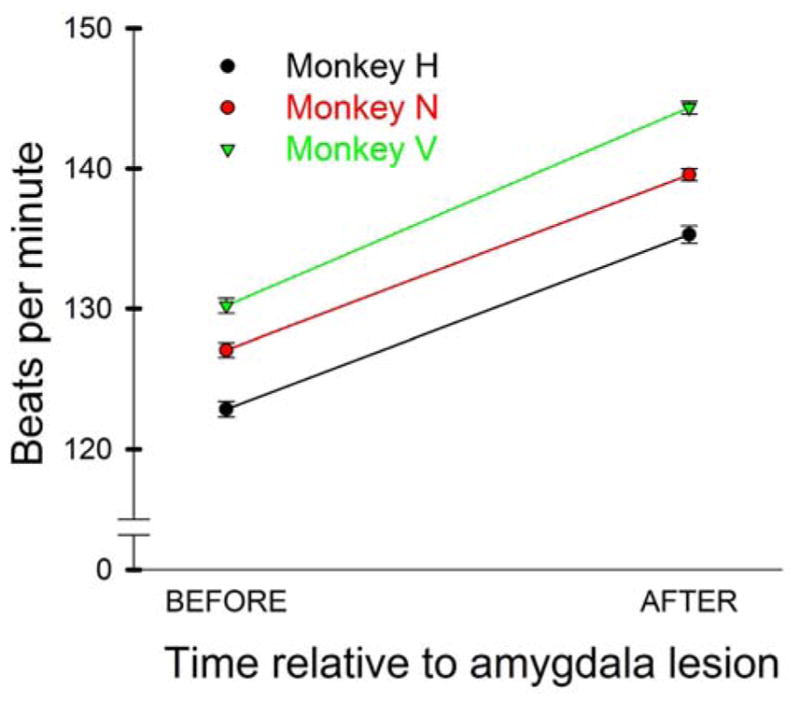
HRs increased about 10% in all three subjects following bilateral amygdala lesions. Values are averaged across all recording sessions conducted before and after surgery (number of sessions for monkey, before lesion, after lesion: H: 84, 61; N 101, 226; V 115, 104). All sessions had >15 min of uninterrupted recordings (H: 17.4, 19.4; N: 24.3, 22.1; V: 22.5, 23.1 s). Error bars (very small) show 95% confidence intervals.
Fig. 8. Shifts in LF and HF peaks after bilateral amygdala lesions in three subjects.

Within-subject power-spectrum averages using the same dataset as Fig 7. Blue trace is pre-operative data; red trace is post-operative data for each of three subjects. LF and HF peaks are marked with circles and matching color markers on the frequency axis show frequency of each peak. Missing red markers are overlaid by blue markers. Subjects H and V had virtually no shifts in LF or HF peaks in spite of the baseline HR changes (Fig 7). Subject N had ~16% increase in the HF peak.
Fig 8 shows that a frequency resolution of 100 mHz or better would be necessary to separate LF from HF contributions to the power spectrum. As discussed earlier, frequency domain analysis cannot be used with short trial durations, as the short epochs do not provide sufficient frequency resolution. This is the case with our Pavlovian conditioning task. For the Pavlovian task, we can use a time-domain analysis. One simple time-domain metric is to compare the standard deviation of R-R intervals for groups of trials in each experimental condition. It is thus a time-domain measure of HRV called the standard deviation of normal-normal beat intervals (SDNN). The ten-second SDNN (SDNN-10s) can reveal differences between early and late CS+ and CS− stimuli in the Pavlovian task described earlier, where CS+ predicts a reward that follows a trace interval, but CS− does not (Figs 2 and 3B). In this case, early means the first quartile of trials in a CS+/CS− learning session. Late means the last quartile of the learning session. Although one might examine whether HRV reflects learning about the cues, here we have a different purpose—to illustrate how HRV can be used to probe cognitive states over relatively long periods of time in a randomized trial design. Fig 9 shows that SDNN-10s reflect something about the CS+ and CS− association with reward/nonreward over the time frame of a session. SDNN-10s averaged across sessions changed significantly between the early trials (first quartile) and the final trials (last quartile) for both the CS+ and the CS− cues, which were each presented randomly in 19% of the fixation trials (45). Neutral cues (in the middle and labeled “trace” in Fig 2) were presented the remaining 62% of the trials and showed no significant change in SDNN-10s. Together, these indicate that the NHP acquired an emotional or attentional response that was selective for predictive cues. The response is selective because non-predictive cues (“control”) showed no effect.
Fig. 9. Time-domain analysis of HR change in a Pavlovian conditioning task.

Monkeys were shown a CS+ (Fig 2) signaling upcoming reward or a CS− that was not associated with a reward on 38% of randomized trials. In the remaining 62% of trials, the same image was shown without conformational change (Fig 2 “trace”) as a control. Given the short trial period (8–10s), poor frequency resolution renders frequency-domain analysis problematic. Standard deviation (SD) of the R-R interval (SDNN-10s) provides a time- domain method to compare autonomic activity early and late (first and last quartile) in each learning session. SDs measured on single trials are averaged together to produce each bar. Error bars are 95% confidence intervals. Both CS+ and CS− show significant decreases in average SDNN between early and late trials (unpaired t-test, p < .05, marked with asterisk). The control cues shows no significant (“n.s.”) change (early CS+: 4.422 +/−3.12SD, n=75, CS−: 4.88 +/−2.37SD, n=76, control: 3.62 +/−1.26SD, n=114; late CS+: 3.27 +/−2.85, n=76, CS−: 3.57 +/−2.51SD, n=73, control: 3.09 +/−2.91SD, n=115).
5. Conclusions
Autonomic outputs of the central nervous system represent an underutilized yet valuable category of behavior for neurophysiological studies in NHP. For the most part, standard equipment intended for recording autonomic signals in humans can be used or modified for recording signals in NHP, generally without disturbing single-unit recording apparatus. In fact, most commercial systems for neurophysiology provide time-synchronized analog inputs well suited for these signals. When using equipment designed for humans, collecting reliable autonomic measures from the NHP must take into account not only the potential impact of experimental design, but also the physical and physiological differences between NHP and humans, for example the hairy skin and faster HRs of NHP. The NHP data acquired with this equipment is generally noisier than human data. Depending upon on signal quality, standard analytical software may not be sufficient to give reliable results. Careful attention must be paid to data quality at each acquisition and processing step. Some NHP studies have experimental design features quite divergent from human studies. It is important to recognize the potential impact of those differences on measures and potential results. We have offered a number of calibration, stimulus configuration, and signal processing techniques that we employ in our own work to assure useable data.
Autonomic measures hold great promise for measuring variables that would otherwise be inaccessible to the researcher. NHP research on emotion and decision making circuitry of the brain will inform our understanding of human behavior and, ultimately, contribute to the translation of basic science into much-needed effective therapeutic intervention. Nowhere is this more apparent than in efforts to understand the neural basis of psychiatric disorders where autonomic measures provide a window into ongoing emotional states.
Highlights.
Autonomic (heart rate and pupil size) measurements can provide crucial information about cognitive and affective states of nonhuman primates (NHP) during single unit recording and lesion studies.
Experimental design, data acquisition and post-process methods must be carefully considered prior to data collection for successful collection and interpretation of autonomic signals.
Amygdala lesions disrupt autonomic control of the pupil and heart in NHP, yet these changes do not necessarily prevent the use of these signals in a pre/post lesion design.
Acknowledgments
This work was supported by the Intramural Research Program of the National Institute of Mental Health (ZIAMH002886). The authors thank John Kakareka, Randy Pursley and Tom Pohida of the Signal Processing and Instrumentation Section in the NIH Center for Information Technology for their expert computational support throughout this project. We thank Jackson Turbeville, who also contributed while working in that section. We also thank Kevin Blomstrom, Kevin Fomalont and Joshua Ripple for assistance with data collection.
Footnotes
Publisher's Disclaimer: This is a PDF file of an unedited manuscript that has been accepted for publication. As a service to our customers we are providing this early version of the manuscript. The manuscript will undergo copyediting, typesetting, and review of the resulting proof before it is published in its final citable form. Please note that during the production process errors may be discovered which could affect the content, and all legal disclaimers that apply to the journal pertain.
References
- 1.Larson JA. The Cardio-Pneumo-Psychogram and its Use in the Study of the Emotions, with Practical Application. Journal of experimental psychology. 1922;5(5):323–8. [Google Scholar]
- 2.Committee to Review the Scientific Evidence on the Polygraph (National Research Council (U.S.), National Research Council (U.S.). Board on Behavioral Cognitive and Sensory Sciences., National Research Council (U.S.). Committee on National Statistics., National Research Council (U.S.). Division of Behavioral and Social Sciences and Education. The polygraph and lie detection. Washington, D.C: National Academies Press; 2003. p. xvi.p. 398. [Google Scholar]
- 3.Granhag PrA, Vrij A, Verschuere B. Detecting deception: current challenges and cognitive approaches. Hoboken: Wiley; 2015. pages cm p. [Google Scholar]
- 4.Bliss-Moreau E, Machado CJ, Amaral DG. Macaque cardiac physiology is sensitive to the valence of passively viewed sensory stimuli. PloS one. 2013;8(8):e71170. doi: 10.1371/journal.pone.0071170. [DOI] [PMC free article] [PubMed] [Google Scholar]
- 5.Satterthwaite TD, Green L, Myerson J, Parker J, Ramaratnam M, Buckner RL. Dissociable but inter-related systems of cognitive control and reward during decision making: evidence from pupillometry and event-related fMRI. NeuroImage. 2007 Sep 1;37(3):1017–31. doi: 10.1016/j.neuroimage.2007.04.066. [DOI] [PubMed] [Google Scholar]
- 6.Varazzani C, San-Galli A, Gilardeau S, Bouret S. Noradrenaline and dopamine neurons in the reward/effort trade-off: a direct electrophysiological comparison in behaving monkeys. The Journal of neuroscience: the official journal of the Society for Neuroscience. 2015 May 20;35(20):7866–77. doi: 10.1523/JNEUROSCI.0454-15.2015. [DOI] [PMC free article] [PubMed] [Google Scholar]
- 7.Lavin C, San Martin R, Rosales Jubal E. Pupil dilation signals uncertainty and surprise in a learning gambling task. Frontiers in behavioral neuroscience. 2014;7:218. doi: 10.3389/fnbeh.2013.00218. [DOI] [PMC free article] [PubMed] [Google Scholar]
- 8.Iriki A, Tanaka M, Iwamura Y. Attention-induced neuronal activity in the monkey somatosensory cortex revealed by pupillometrics. Neurosci Res. 1996 Jun;25(2):173–81. doi: 10.1016/0168-0102(96)01043-7. [DOI] [PubMed] [Google Scholar]
- 9.Kennerley SW, Wallis JD. Reward-dependent modulation of working memory in lateral prefrontal cortex. The Journal of neuroscience: the official journal of the Society for Neuroscience. 2009 Mar 11;29(10):3259–70. doi: 10.1523/JNEUROSCI.5353-08.2009. [DOI] [PMC free article] [PubMed] [Google Scholar]
- 10.Ebitz RB, Platt ML. Neuronal activity in primate dorsal anterior cingulate cortex signals task conflict and predicts adjustments in pupil-linked arousal. Neuron. 2015 Feb 4;85(3):628–40. doi: 10.1016/j.neuron.2014.12.053. [DOI] [PMC free article] [PubMed] [Google Scholar]
- 11.Bradley MM, Miccoli L, Escrig MA, Lang PJ. The pupil as a measure of emotional arousal and autonomic activation. Psychophysiology. 2008 Jul;45(4):602–7. doi: 10.1111/j.1469-8986.2008.00654.x. [DOI] [PMC free article] [PubMed] [Google Scholar]
- 12.Bertrand AL, Garcia JB, Viera EB, Santos AM, Bertrand RH. Pupillometry: the influence of gender and anxiety on the pain response. Pain Physician. 2013 May-Jun;16(3):E257–66. [PubMed] [Google Scholar]
- 13.Lader M. The psychophysiology of anxiety. Encephale. 1983;9(4 Suppl 2):205B–10B. [PubMed] [Google Scholar]
- 14.Williams DP, Cash C, Rankin C, Bernardi A, Koenig J, Thayer JF. Resting heart rate variability predicts self-reported difficulties in emotion regulation: a focus on different facets of emotion regulation. Front Psychol. 2015;6:261. doi: 10.3389/fpsyg.2015.00261. [DOI] [PMC free article] [PubMed] [Google Scholar]
- 15.Zeki Al Hazzouri A, Haan MN, Deng Y, Neuhaus J, Yaffe K. Reduced heart rate variability is associated with worse cognitive performance in elderly Mexican Americans. Hypertension. 2014 Jan;63(1):181–7. doi: 10.1161/HYPERTENSIONAHA.113.01888. [DOI] [PMC free article] [PubMed] [Google Scholar]
- 16.Duschek S, Muckenthaler M, Werner N, del Paso GA. Relationships between features of autonomic cardiovascular control and cognitive performance. Biological psychology. 2009 May;81(2):110–7. doi: 10.1016/j.biopsycho.2009.03.003. [DOI] [PubMed] [Google Scholar]
- 17.Beatty J. Task-evoked pupillary responses, processing load, and the structure of processing resources. Psychol Bull. 1982 Mar;91(2):276–92. [PubMed] [Google Scholar]
- 18.Marshall SP, Davis CL, Knust SR. The Index of Cognitive Activity: Estimating Cognitive Effort from Pupil Dilation. Technical Report of EyeTracking, Inc. 2004:1–9. [Google Scholar]
- 19.Bauer RM. Physiologic measures of emotion. J Clin Neurophysiol. 1998 Sep;15(5):388–96. doi: 10.1097/00004691-199809000-00003. [DOI] [PubMed] [Google Scholar]
- 20.Kreibig SD. Autonomic nervous system activity in emotion: a review. Biological psychology. 2010 Jul;84(3):394–421. doi: 10.1016/j.biopsycho.2010.03.010. [DOI] [PubMed] [Google Scholar]
- 21.Lang PJ. The emotion probe. Studies of motivation and attention. The American psychologist. 1995 May;50(5):372–85. doi: 10.1037//0003-066x.50.5.372. [DOI] [PubMed] [Google Scholar]
- 22.Allard ES, Wadlinger HA, Isaacowitz DM. Positive gaze preferences in older adults: assessing the role of cognitive effort with pupil dilation. Neuropsychol Dev Cogn B Aging Neuropsychol Cogn. 2010 May;17(3):296–311. doi: 10.1080/13825580903265681. [DOI] [PMC free article] [PubMed] [Google Scholar]
- 23.van der Kooy KG, van Hout HP, van Marwijk HW, de Haan M, Stehouwer CD, Beekman AT. Differences in heart rate variability between depressed and non-depressed elderly. Int J Geriatr Psychiatry. 2006 Feb;21(2):147–50. doi: 10.1002/gps.1439. [DOI] [PubMed] [Google Scholar]
- 24.Chaney RH, Givens CA, Aoki MF, Gombiner ML. Pupillary responses in recognizing awareness in persons with profound mental retardation. Perceptual and motor skills. 1989 Oct;69(2):523–8. doi: 10.2466/pms.1989.69.2.523. [DOI] [PubMed] [Google Scholar]
- 25.Vos P, De Cock P, Petry K, Van Den Noortgate W, Maes B. See me, feel me. Using physiology to validate behavioural observations of emotions of people with severe or profound intellectual disability. J Intellect Disabil Res. 2013 May;57(5):452–61. doi: 10.1111/jir.12030. [DOI] [PubMed] [Google Scholar]
- 26.Anderson CJ, Colombo J, Jill Shaddy D. Visual scanning and pupillary responses in young children with Autism Spectrum Disorder. J Clin Exp Neuropsychol. 2006 Oct;28(7):1238–56. doi: 10.1080/13803390500376790. [DOI] [PubMed] [Google Scholar]
- 27.Erstenyuk V, Swanson MR, Siller M. Pupillary responses during a joint attention task are associated with nonverbal cognitive abilities and sub-clinical symptoms of autism. Res Autism Spectr Disord. 2014 Jun 1;8(6):644–53. doi: 10.1016/j.rasd.2014.03.003. [DOI] [PMC free article] [PubMed] [Google Scholar]
- 28.Farzin F, Scaggs F, Hervey C, Berry-Kravis E, Hessl D. Reliability of eye tracking and pupillometry measures in individuals with fragile X syndrome. J Autism Dev Disord. 2011 Nov;41(11):1515–22. doi: 10.1007/s10803-011-1176-2. [DOI] [PMC free article] [PubMed] [Google Scholar]
- 29.Sepeta L, Tsuchiya N, Davies MS, Sigman M, Bookheimer SY, Dapretto M. Abnormal social reward processing in autism as indexed by pupillary responses to happy faces. J Neurodev Disord. 2012;4(1):17. doi: 10.1186/1866-1955-4-17. [DOI] [PMC free article] [PubMed] [Google Scholar]
- 30.Graur S, Siegle G. Pupillary motility: bringing neuroscience to the psychiatry clinic of the future. Curr Neurol Neurosci Rep. 2013 Aug;13(8):365. doi: 10.1007/s11910-013-0365-0. [DOI] [PMC free article] [PubMed] [Google Scholar]
- 31.O’Kelly J, James L, Palaniappan R, Taborin J, Fachner J, Magee WL. Neurophysiological and behavioral responses to music therapy in vegetative and minimally conscious States. Front Hum Neurosci. 2013;7:884. doi: 10.3389/fnhum.2013.00884. [DOI] [PMC free article] [PubMed] [Google Scholar]
- 32.Janig W, McLachlan EM. Neurobiology of the autonomic nervous system. In: Mathias CJ, Bannister R, editors. Autonomic Failure: A Textbook of Clinical Disorders of the Autonomic Nervous System. 5. Oxford, UK: Oxford University Press; 2013. p. 860. [Google Scholar]
- 33.Pendergast DR, Moon RE, Krasney JJ, Held HE, Zamparo P. Human Physiology in an Aquatic Environment. Compr Physiol. 2015 Oct;5(4):1705–50. doi: 10.1002/cphy.c140018. [DOI] [PubMed] [Google Scholar]
- 34.Dum RP, Levinthal DJ, Strick PL. Motor, cognitive, and affective areas of the cerebral cortex influence the adrenal medulla. Proceedings of the National Academy of Sciences of the United States of America. 2016 Aug 30;113(35):9922–7. doi: 10.1073/pnas.1605044113. [DOI] [PMC free article] [PubMed] [Google Scholar]
- 35.Benarroch EE. The central autonomic network: functional organization, dysfunction, and perspective. Mayo Clin Proc. 1993 Oct;68(10):988–1001. doi: 10.1016/s0025-6196(12)62272-1. [DOI] [PubMed] [Google Scholar]
- 36.Rhesus Macaque Genome S, Analysis C. Gibbs RA, Rogers J, Katze MG, Bumgarner R, et al. Evolutionary and biomedical insights from the rhesus macaque genome. Science (New York, NY) 2007 Apr 13;316(5822):222–34. doi: 10.1126/science.1139247. [DOI] [PubMed] [Google Scholar]
- 37.Crawford ML. Central vision of man and macaque: cone and rod sensitivity. Brain research. 1977 Jan 7;119(2):345–56. doi: 10.1016/0006-8993(77)90315-8. [DOI] [PubMed] [Google Scholar]
- 38.Van Essen DC. Surface-based atlases of cerebellar cortex in the human, macaque, and mouse. Annals of the New York Academy of Sciences. 2002 Dec;978:468–79. doi: 10.1111/j.1749-6632.2002.tb07588.x. [DOI] [PubMed] [Google Scholar]
- 39.Clarke RJ, Zhang H, Gamlin PD. Characteristics of the pupillary light reflex in the alert rhesus monkey. Journal of neurophysiology. 2003 Jun;89(6):3179–89. doi: 10.1152/jn.01131.2002. [DOI] [PubMed] [Google Scholar]
- 40.Gamlin PD, Zhang H, Harlow A, Barbur JL. Pupil responses to stimulus color, structure and light flux increments in the rhesus monkey. Vision Res. 1998 Nov;38(21):3353–8. doi: 10.1016/s0042-6989(98)00096-0. [DOI] [PubMed] [Google Scholar]
- 41.Amiez C, Procyk E, Honore J, Sequeira H, Joseph JP. Reward anticipation, cognition, and electrodermal activity in the conditioned monkey. Experimental brain research Experimentelle Hirnforschung Experimentation cerebrale. 2003 Apr;149(3):267–75. doi: 10.1007/s00221-002-1353-9. [DOI] [PubMed] [Google Scholar]
- 42.Jansen HT, Dellinger JA. Effects of atropine on respiratory sinus arrhythmia (RSA) in the rhesus macaque. Neurotoxicology and teratology. 1988 Mar-Apr;10(2):169–74. doi: 10.1016/0892-0362(88)90081-5. [DOI] [PubMed] [Google Scholar]
- 43.Paton JJ, Belova MA, Morrison SE, Salzman CD. The primate amygdala represents the positive and negative value of visual stimuli during learning. Nature. 2006 Feb 16;439(7078):865–70. doi: 10.1038/nature04490. [DOI] [PMC free article] [PubMed] [Google Scholar]
- 44.Braesicke K, Parkinson JA, Reekie Y, Man MS, Hopewell L, Pears A, et al. Autonomic arousal in an appetitive context in primates: a behavioural and neural analysis. The European journal of neuroscience. 2005 Mar;21(6):1733–40. doi: 10.1111/j.1460-9568.2005.03987.x. [DOI] [PubMed] [Google Scholar]
- 45.Rudebeck PH, Putnam PT, Daniels TE, Yang T, Mitz AR, Rhodes SE, et al. A role for primate subgenual cingulate cortex in sustaining autonomic arousal. Proceedings of the National Academy of Sciences of the United States of America. 2014 Apr 8;111(14):5391–6. doi: 10.1073/pnas.1317695111. [DOI] [PMC free article] [PubMed] [Google Scholar]
- 46.Rudebeck PH, Mitz AR, Chacko RV, Murray EA. Effects of amygdala lesions on reward-value coding in orbital and medial prefrontal cortex. Neuron. 2013 Dec 18;80(6):1519–31. doi: 10.1016/j.neuron.2013.09.036. [DOI] [PMC free article] [PubMed] [Google Scholar]
- 47.Usui S, Stark L. A model for nonlinear stochastic behavior of the pupil. Biological cybernetics. 1982;45(1):13–21. doi: 10.1007/BF00387209. [DOI] [PubMed] [Google Scholar]
- 48.Longtin A, Milton JG, Bos JE, Mackey MC. Noise and critical behavior of the pupil light reflex at oscillation onset. Physical review A, Atomic, molecular, and optical physics. 1990 Jun 15;41(12):6992–7005. doi: 10.1103/physreva.41.6992. [DOI] [PubMed] [Google Scholar]
- 49.Hess EH. Pupillometrics: A method of studying mental, emotional, and sensory processes. In: Greenfield NS, Sternbach RA, editors. Handbook of Psychophysiology. New York, NY: Holt, Richard & Winston; 1972. pp. 491–531. [Google Scholar]
- 50.Janisse MP. Pupil size, affect and exposure frequency. Social Behavior and Personality. 1974;2(2):125–46. [Google Scholar]
- 51.Critchley HD, Tang J, Glaser D, Butterworth B, Dolan RJ. Anterior cingulate activity during error and autonomic response. NeuroImage. 2005 Oct 1;27(4):885–95. doi: 10.1016/j.neuroimage.2005.05.047. [DOI] [PubMed] [Google Scholar]
- 52.Donchin E, Heffley E, Hillyard SA, Loveless N, Maltzman I, Ohman A, et al. Cognition and event-related potentials. II. The orienting reflex and P300. Annals of the New York Academy of Sciences. 1984;425:39–57. doi: 10.1111/j.1749-6632.1984.tb23522.x. [DOI] [PubMed] [Google Scholar]
- 53.Nieuwenhuis S, De Geus EJ, Aston-Jones G. The anatomical and functional relationship between the P3 and autonomic components of the orienting response. Psychophysiology. 2011 Feb;48(2):162–75. doi: 10.1111/j.1469-8986.2010.01057.x. [DOI] [PMC free article] [PubMed] [Google Scholar]
- 54.Joshi S, Li Y, Kalwani RM, Gold JI. Relationships between Pupil Diameter and Neuronal Activity in the Locus Coeruleus, Colliculi, and Cingulate Cortex. Neuron. 2016 Jan 6;89(1):221–34. doi: 10.1016/j.neuron.2015.11.028. [DOI] [PMC free article] [PubMed] [Google Scholar]
- 55.Rudebeck PH, Mitz AR, Chacko RV, Murray EA. Effects of amygdala lesions on reward-value coding in orbital and medial prefrontal cortex. Neuron. 2013;80(6):1519–31. doi: 10.1016/j.neuron.2013.09.036. [DOI] [PMC free article] [PubMed] [Google Scholar]
- 56.Regan BC, Reffin JP, Mollon JD. Luminance noise and the rapid determination of discrimination ellipses in colour deficiency. Vision Res. 1994 May;34(10):1279–99. doi: 10.1016/0042-6989(94)90203-8. [DOI] [PubMed] [Google Scholar]
- 57.Kardon RH, Kirkali PA, Thompson HS. Automated pupil perimetry. Pupil field mapping in patients and normal subjects. Ophthalmology. 1991 Apr;98(4):485–95. doi: 10.1016/s0161-6420(91)32267-x. discussion 95–6. [DOI] [PubMed] [Google Scholar]
- 58.Sogo H. GazeParser: an open-source and multiplatform library for low-cost eye tracking and analysis. Behav Res Methods. 2013 Sep;45(3):684–95. doi: 10.3758/s13428-012-0286-x. [DOI] [PMC free article] [PubMed] [Google Scholar]
- 59.Chen S, Epps J. Efficient and robust pupil size and blink estimation from near-field video sequences for human-machine interaction. IEEE Trans Cybern. 2014 Dec;44(12):2356–67. doi: 10.1109/TCYB.2014.2306916. [DOI] [PubMed] [Google Scholar]
- 60.Lin X, Klette G, Klette R, Craig J, Dean S. Accurately Measuring the Size of the Pupil of the Eye. Proceedings of the Image and Vision Computing; New Zealand. 2003; Nov 27, 2003. pp. 221–6. [Google Scholar]
- 61.Hayes T, Petrov A. Mapping and Correcting the Influence of Gaze Position on Pupil Size Measurements. Journal of vision. 2015 Sep 1;15(12):781. doi: 10.3758/s13428-015-0588-x. [DOI] [PMC free article] [PubMed] [Google Scholar]
- 62.Nagasaka Y, Shimoda K, Fujii N. Multidimensional recording (MDR) and data sharing: an ecological open research and educational platform for neuroscience. PloS one. 2011;6(7):e22561. doi: 10.1371/journal.pone.0022561. [DOI] [PMC free article] [PubMed] [Google Scholar]
- 63.Davis TS, Torab K, House P, Greger B. A minimally invasive approach to long-term head fixation in behaving nonhuman primates. Journal of neuroscience methods. 2009 Jun 30;181(1):106–10. doi: 10.1016/j.jneumeth.2009.04.012. [DOI] [PMC free article] [PubMed] [Google Scholar]
- 64.Amemori S, Amemori K, Cantor ML, Graybiel AM. A non-invasive head-holding device for chronic neural recordings in awake behaving monkeys. Journal of neuroscience methods. 2015 Jan 30;240:154–60. doi: 10.1016/j.jneumeth.2014.11.006. [DOI] [PMC free article] [PubMed] [Google Scholar]
- 65.Machado CJ, Nelson EE. Eye-tracking with nonhuman primates is now more accessible than ever before. Am J Primatol. 2011 Jun;73(6):562–9. doi: 10.1002/ajp.20928. [DOI] [PMC free article] [PubMed] [Google Scholar]
- 66.Wilson CR, Buckley MJ, Gaffan D. Degraded transfer of memories between the visual hemifields in normal macaques revealed by a novel infrared eyetracking method without head fixation. Neuropsychologia. 2010 Apr;48(5):1376–84. doi: 10.1016/j.neuropsychologia.2010.01.003. [DOI] [PubMed] [Google Scholar]
- 67.Eger E, Schweinberger SR, Dolan RJ, Henson RN. Familiarity enhances invariance of face representations in human ventral visual cortex: fMRI evidence. NeuroImage. 2005 Jul 15;26(4):1128–39. doi: 10.1016/j.neuroimage.2005.03.010. [DOI] [PubMed] [Google Scholar]
- 68.Masaoka Y, Hirasawa K, Yamane F, Hori T, Homma I. Effects of left amygdala lesions on respiration, skin conductance, heart rate, anxiety, and activity of the right amygdala during anticipation of negative stimulus. Behav Modif. 2003 Oct;27(5):607–19. doi: 10.1177/0145445503256314. [DOI] [PubMed] [Google Scholar]
- 69.Genovesio A, Mitz AR. MatOFF: a tool for analyzing behaviorally complex neurophysiological experiments. Journal of neuroscience methods. 2007 Sep 15;165(1):38–48. doi: 10.1016/j.jneumeth.2007.05.026. [DOI] [PMC free article] [PubMed] [Google Scholar]
- 70.Gitelman DR. ILAB: a program for postexperimental eye movement analysis. Behav Res Methods Instrum Comput. 2002 Nov;34(4):605–12. doi: 10.3758/bf03195488. [DOI] [PubMed] [Google Scholar]
- 71.Ebitz RB, Pearson JM, Platt ML. Pupil size and social vigilance in rhesus macaques. Front Neurosci. 2014;8:100. doi: 10.3389/fnins.2014.00100. [DOI] [PMC free article] [PubMed] [Google Scholar]
- 72.Hampson RE, Opris I, Deadwyler SA. Neural correlates of fast pupil dilation in nonhuman primates: relation to behavioral performance and cognitive workload. Behavioural brain research. 2010 Sep 1;212(1):1–11. doi: 10.1016/j.bbr.2010.03.011. [DOI] [PMC free article] [PubMed] [Google Scholar]
- 73.Nassar MR, Rumsey KM, Wilson RC, Parikh K, Heasly B, Gold JI. Rational regulation of learning dynamics by pupil-linked arousal systems. Nature neuroscience. 2012 Jun 03;15(7):1040–6. doi: 10.1038/nn.3130. [DOI] [PMC free article] [PubMed] [Google Scholar]
- 74.Billman GE. Heart rate variability - a historical perspective. Front Physiol. 2011;2:86. doi: 10.3389/fphys.2011.00086. [DOI] [PMC free article] [PubMed] [Google Scholar]
- 75.Rajendra Acharya U, Paul Joseph K, Kannathal N, Lim CM, Suri JS. Heart rate variability: a review. Med Biol Eng Comput. 2006 Dec;44(12):1031–51. doi: 10.1007/s11517-006-0119-0. [DOI] [PubMed] [Google Scholar]
- 76.Berntson GG, Bigger JT, Jr, Eckberg DL, Grossman P, Kaufmann PG, Malik M, et al. Heart rate variability: origins, methods, and interpretive caveats. Psychophysiology. 1997 Nov;34(6):623–48. doi: 10.1111/j.1469-8986.1997.tb02140.x. [DOI] [PubMed] [Google Scholar]
- 77.Billman GE. The LF/HF ratio does not accurately measure cardiac sympatho-vagal balance. Front Physiol. 2013;4:26. doi: 10.3389/fphys.2013.00026. [DOI] [PMC free article] [PubMed] [Google Scholar]
- 78.Montano N, Porta A, Cogliati C, Costantino G, Tobaldini E, Casali KR, et al. Heart rate variability explored in the frequency domain: a tool to investigate the link between heart and behavior. Neurosci Biobehav Rev. 2009 Feb;33(2):71–80. doi: 10.1016/j.neubiorev.2008.07.006. [DOI] [PubMed] [Google Scholar]
- 79.Pagani M, Lombardi F, Guzzetti S, Rimoldi O, Furlan R, Pizzinelli P, et al. Power Spectral Analysis of Heart Rate and Arterial Pressure Variabilities as a Marker of Sympatho-Vagal Interaction in Man and Conscious Dog. Circulation Research. 1986;59:178–93. doi: 10.1161/01.res.59.2.178. [DOI] [PubMed] [Google Scholar]
- 80.Cohen DH, Randall DC. Classical conditioning of cardiovascular responses. Annu Rev Physiol. 1984;46:187–97. doi: 10.1146/annurev.ph.46.030184.001155. [DOI] [PubMed] [Google Scholar]
- 81.Lillywhite HB, Zippel KC, Farrell AP. Resting and maximal heart rates in ectothermic vertebrates. Comp Biochem Physiol A Mol Integr Physiol. 1999 Dec;124(4):369–82. doi: 10.1016/s1095-6433(99)00129-4. [DOI] [PubMed] [Google Scholar]
- 82.Rasmussen KL, Suomi SJ. Heart rate and endocrine responses to stress in adolescent male rhesus monkeys on Cayo Santiago. P R Health Sci J. 1989 Apr;8(1):65–71. [PubMed] [Google Scholar]
- 83.Lombardi F, Stein PK. Origin of heart rate variability and turbulence: an appraisal of autonomic modulation of cardiovascular function. Front Physiol. 2011;2:95. doi: 10.3389/fphys.2011.00095. [DOI] [PMC free article] [PubMed] [Google Scholar]
- 84.Glisson TH, Black CI, Sage AP. The Digital Computation of Discrete Spectra Using Fast Fourier Transform. IEEE T Acoust Speech. 1970 Sep;Au18(3):271–87. [Google Scholar]
- 85.Schwartz GG, Rosenblum LA. Allometry of primate hair density and the evolution of human hairlessness. American journal of physical anthropology. 1981 May;55(1):9–12. doi: 10.1002/ajpa.1330550103. [DOI] [PubMed] [Google Scholar]
- 86.Babaeizadeh S, Zhou SH, Pittman SD, White DP. Electrocardiogram-derived respiration in screening of sleep-disordered breathing. Journal of electrocardiology. 2011 Nov-Dec;44(6):700–6. doi: 10.1016/j.jelectrocard.2011.08.004. [DOI] [PubMed] [Google Scholar]
- 87.Hingorani P, Karnad DR, Rohekar P, Kerkar V, Lokhandwala YY, Kothari S. Arrhythmias Seen in Baseline 24-Hour Holter ECG Recordings in Healthy Normal Volunteers During Phase I Clinical Trials. Journal of clinical pharmacology. 2015 Dec 2; doi: 10.1002/jcph.679. [DOI] [PubMed] [Google Scholar]
- 88.Benitez D, Gaydecki PA, Zaidi A, Fitzpatrick AP. The use of the Hilbert transform in ECG signal analysis. Computers in biology and medicine. 2001 Sep;31(5):399–406. doi: 10.1016/s0010-4825(01)00009-9. [DOI] [PubMed] [Google Scholar]
- 89.Ongur D, An X, Price JL. Prefrontal cortical projections to the hypothalamus in macaque monkeys. The Journal of comparative neurology. 1998 Nov 30;401(4):480–505. [PubMed] [Google Scholar]