Abstract
During systole, Ca2+ is released from the sarcoplasmic reticulum (SR) through ryanodine receptors (RyRs) while, simultaneously, other ions (specifically K+, Mg2+, and Cl−) provide counter-ion flux. These ions move back into the SR during diastole through the SERCA pump and SR K+ and Cl− channels. In homeostasis, all ion concentrations in different cellular regions (e.g., junctional and non-junctional SR, dyadic cleft, and cytosol) are the same at the beginning and end of the cardiac cycle. Here, we used an equivalent circuit compartment model of the SR and the surrounding cytoplasm to understand the heart rate dependence of SR ion homeostasis. We found that the Ca2+, Mg2+, K+, and Cl− concentrations in the SR and the cytoplasm self-adjust within just a few heartbeats with only very small changes in Mg2+, K+, and Cl− concentrations and membrane voltages (just a few percent). However, those small changes were enough to compensate for the large heart-rate-dependent changes in SR and cytoplasmic Ca2+ concentrations in the new steady state. The modeling suggests that ion adaptation to increases in heart rate is inherent to the system and that physiological changes that increase contractility and cardiac output are accommodated by the same self-adjusting mechanism of producing small changes in ion driving forces. Our findings also support the long-held hypothesis that SR membrane potentials are small (~1–2 mV).
Keywords: Excitation/contraction coupling, calcium release, Ryanodine receptor, Equivalent circuit model
1. Introduction
Heart rate can vary dramatically with physical activity or stress levels. Doing that requires rapid adaptation from the tissue level down to the single protein level to maintain excitation-contraction (EC) coupling. For example, Ca2+ is released from the sarcoplasmic reticulum (SR) through ryanodine receptors (RyRs) each time the heart beats. After the RyRs close, the sarco/endoplasmic reticulum Ca2+ ATPase (SERCA) pump works to restore the Ca2+ concentration inside the SR back to its pre-release level. The time SERCA has to accomplish this task decreases as the heart rate increases, and therefore SR Ca2+ load changes with heart rate.
This variation in SR Ca2+ homeostasis with heart rate is well-established and has been thoroughly studied [1,2]. During and between Ca2+ release events, other ions (specifically K+, Mg2+, and Cl−) also move across the SR membrane. These ions provide the counter-ion flux during Ca2+ release required to maintain the trans-SR Ca2+ driving force. Currently, little is known about the heart rate dependence of the SR K+, Mg2+, or Cl− homeostasis.
The K+, Mg2+ or Cl− move into and out of the SR through ion channels. These include the SR K+ and Cl− channels [3,4], as well as the RyR which conducts Ca2+, Mg2+, and K+ [5,6]. Homeostasis requires that the number of K+, Mg2+, and Cl− ions that flow out of (or into) the SR during Ca2+ release must go back in (out) between release events. Failure to achieve homeostasis for all ions from heartbeat to heartbeat would result in the SR steadily accumulating or losing K+, Mg2+, or Cl−, compromising SR membrane potential stability, counter-ion availability, and/or EC coupling with potentially pathological consequences (e.g., as in K+ channel-knockout mice [7]).
To better understand the heart rate dependence of SR ion homeostasis, we developed an equivalent circuit compartment model of the SR and the surrounding cytoplasm. This model permits us to quantify how Ca2+, Mg2+, K+, and Cl− concentrations and electrochemical potentials between various compartments change and adapt with heart rate. We found that Mg2+, K+, and Cl− concentrations in the SR and the cytoplasm self-adjust to achieve homeostasis within just a few heartbeats, consistent with recent experiments [2]. All the ion concentrations are interdependent on each other; Ca2+ concentrations changes affect Mg2+, K+, and Cl− concentrations. The net result, from a cardiac function point of view, is large, heart-rate-dependent effects on SR and cytoplasmic Ca2+ concentrations.
The capacity of the SR to achieve Mg2+, K+, and Cl− homeostasis was remarkably robust; even with very large parameter changes, Ca2+ release and ion homeostasis was always achieved, indicating it is something inherent to the simplified system we study and probably to the physiological system as well. It also suggests that physiological changes designed to increase contractility and cardiac output (e.g., phosphorylation of RyR or regulation of the SERCA pump by phospholamban) are accommodated by the same self-adjusting mechanism of producing small changes in ion driving forces.
2. Theory and methods
2.1. Equivalent circuit
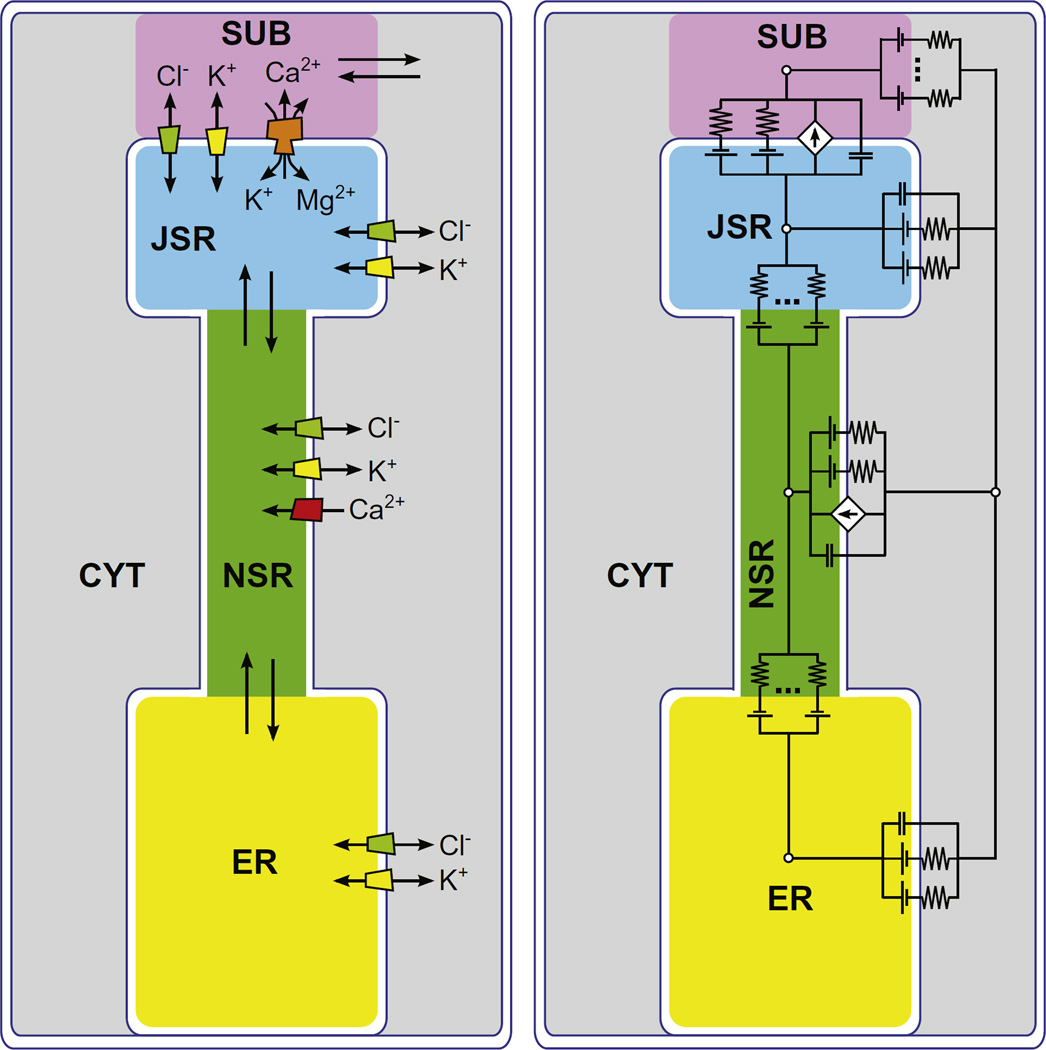
To build our compartment model we considered a 32 pL cell with ~20,000 SR Ca2+ release units (CRUs), where cytosol, mitochondria, and the endo/sarcoplasmic reticulum occupy 66%, 30.3%, and 3.7% of the cell volume, respectively [8,9]. We modeled the space around a single CRU using five compartments: junctional SR (JSR), non-junctional SR (NSR), endoplasmic reticulum (ER), junctional cleft subspace (SUB) and the surrounding cytosol (CYT) (Fig. 1, left panel). We used the abbreviations in parentheses in mathematical symbols. Each compartment was a cylinder with dimensions based on experimental data [8] (Table 1).
Fig. 1.
(Color online) (left) Sketch of the compartment model. Ion fluxes between compartments are indicated by the arrows. (right) Equivalent circuit of the compartment model.
Table 1.
Compartment parameters. In each compartment, initial [X−] was defined to provide electroneutrality.
| Compartment | Radius (µm) | Height (µm) | Volume (µm3) | Ca2+ buffering power | Initial [Ca2+] | Initial [K+] | Initial [Mg2+] | Initial [Cl−] |
|---|---|---|---|---|---|---|---|---|
| JSR | 0.167 | 0.045 | 0.00396 | 75 | 0.65 mM | 120 mM | 1 mM | 5 mM |
| NSR | 0.084 | 0.9 | 0.0198 | 5 | 0.65 mM | 120 mM | 1 mM | 5 mM |
| ER | 0.167 | 0.47 | 0.04136 | 5 | 0.65 mM | 120 mM | 1 mM | 5 mM |
| SUB | 0.167 | 0.015 | 0.00132 | 125 | 0.1 µM | 120 mM | 1 mM | 5 mM |
| CYT | 0.5 | 1.43 | 1.0566 | 125 | 0.1 µM | 120 mM | 1 mM | 5 mM |
For each ion species (Ca2+, Mg2+, K+ and Cl−), the total number of ions was fixed in the system as a whole. However, the concentrations of each ion type fluctuated independently in the various compartments as ions moved between compartments. Ca2+ buffering was modeled as an increase in the effective compartment volume “seen” by Ca2+ (Table 1). We also included non-Cl− anions in each compartment as an additional ionic species, X−. These represent all the charge neutralizing anions that must exist in each compartment (e.g., proteins and phosphates). Their concentration in the cytosol and ER always neutralized those compartments and flowed between the others (see below).
Ions flowed from compartment to compartment down electrochemical potential gradients produced by differences in concentration and/or voltage. Ions moved either through ion channels across capacitive membranes (the JSR-SUB, CYT-NSR, and CYT-ER membranes with capacitance per area 0.01 pF/µm2 [10]) or via bulk electrodiffusion between contiguous compartments (the CYT-SUB, NSR-JSR, and ER-NSR interfaces). Ca2+ also crossed the NSR-CYT membrane through SERCA pumps, for which we use the model of Shannon et al. [9]. At high heart rates, the SERCA pump rate increases due to dissociation of phospholamban [11,12]. The role of this phenomenon was explored by doubling SERCA pump rate while keeping all other parameters the same.
K+ and Cl− currents carried by SR K+ and Cl− channels followed Ohm's law:
| (1) |
where the current of ion species i between compartments 1 and 2 () depends on the conductance , the potential difference between compartments 1 and 2 (V1,2), and the concentration in each compartment ( and ). zi is the valence of ion species i, and k, T, and e are the Boltzmann constant, absolute temperature, and elementary charge, respectively. The SR K+ and Cl− channels both had conductances of 100 pS. The Ca2+, Mg2+, and K+ currents through the RyR followed the Goldman-Hodgkin-Katz current formula [13]. The permeabilities were chosen to reproduce the individual ionic currents at 0 mV in physiological ion conditions, as calculated using the Gillespie ion permeation model [14]. The salient ion current/voltage curves were previously published [5].
Bulk electrodiffusion currents followed Eq. (1). We used 10 nS for all X− bulk conductances so that they could move quickly to provide electroneutrality, since they are all the charge neutralizing anions already in each compartment and those that move with the cations. The particular choice of the X− conductances did not significantly affect our results (data not shown). For all other ions, the SUB-CYT conductance was 250 pS. Both the ER-NSR and NSR-JSR conductances were 10 pS, which were tuned so that the time needed to refill the JSR is in agreement with experimental data [15] (data not shown). The ER was included because, in the cell, it is connected to the SR where it can serve as a reservoir of ions to replenish the NSR in addition to the SERCA pump [16]. The model results are generally insensitive to the specific choice of flux rate, except under the extreme circumstance of the SERCA pump being off (not shown).
In our equivalent circuit model, the concentration of each ion species and the voltage in each compartment (Fig. 1, right panel) evolved over time to satisfy Kirchhoff's current laws. This initial-value system of algebraic-differential equations (the initial ion concentrations are listed in Table 1) was solved using Mathematica 8.0.1 (Wolfram Research, Champaign, IL) with Runge-Kutta methods.
2.2. Membrane channels and Ca2+ release
RyRs were localized only in the JSR-SUB membrane and SERCA pumps only in the NSR-CYT membrane. 320 SR K+ channels and 320 SR Cl− channels were distributed over the whole SR membrane, with a 80 on each membrane (i.e., JSR-SUB, JSR-CYT, NSR-CYT, ER-CYT). Open RyRs conduct Ca2+, Mg2+, and K+ while open SR K+ and Cl− channels conduct only their namesake ions. The SR K+ channel was recently identified [17] as the trimeric intracellular cation (TRIC) channel [7].
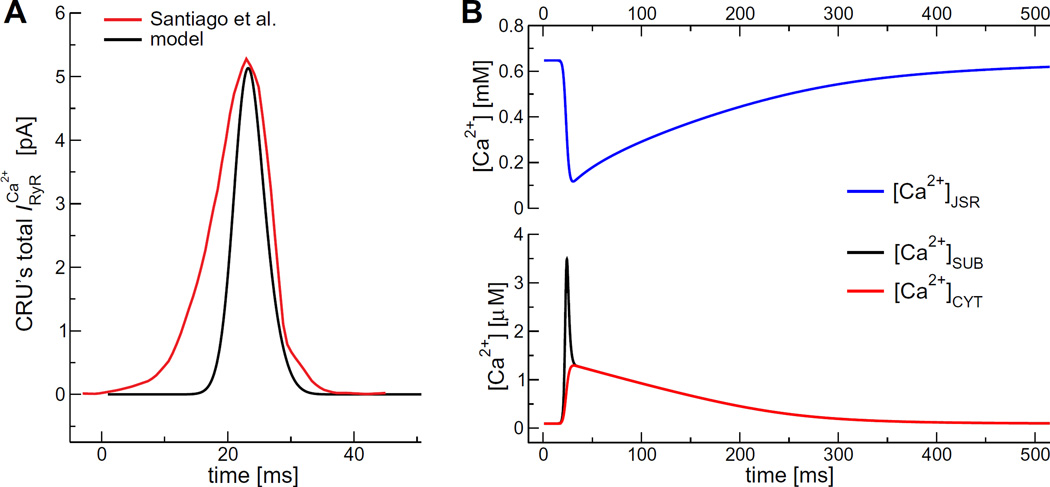
The K+ and Cl− channels were assumed to be always open and the SERCA pumps always active. The RyRs were initially closed and then opened to initiate the release of Ca2+. Specifically, we used a smooth RyR gating function of a Gaussian with mean 25 ms and variance 2.7 ms and amplitude 0.33; the gating function both initiates and terminates RyR-mediated Ca2+ release. This gave a time course of Ca2+ current from a single CRU (Fig. 2A, red line) that was in reasonable agreement with experiments by Santiago et al. [18].
Fig. 2.
(A) Total Ca2+ current from a single CRU. (B) During systole JSR Ca2+ concentration decreases rapidly (red line) and increases both in the SUB (black line) and in the CYT (blue line). After Ca2+ release ends, systolic concentrations are restored slowly. (For interpretation of the references to color in this figure legend, the reader is referred to the web version of this article.)
To compare our model result to other models, Fig. 2B shows the predicted time course of [Ca2+]JSR, [Ca2+]SUB, and [Ca2+]CYT during a Ca2+ transient at a heart rate of 60 beats per minute (bpm). The [Ca2+]JSR drops rapidly to ~15% of its steady-state diastolic level, consistent with previous modeling studies [19]. The [Ca2+]SUB, and [Ca2+]CYT suddenly increase, reaching a peak of 3.5 µM and 1.2 µM, respectively. This is also in agreement with experimental results [20] and previous computational models [9,21]
2.3. Changing heart rate
All simulations were started with the initial concentrations listed in Table 1 and with all membrane potentials set to 0 mV. At the start of the simulation, the RyR gating function was turned on and the system evolved with the RyRs opening once per second (60 bpm) until Ca2+, Mg2+, K+, and Cl− concentrations at the beginning and end of a 1 second interval were the same to four significant figures (i.e., ion homeostasis was achieved at that heart rate). The pacing was then stepped to the desired new rate and the simulation continued until a new ion homeostasis was reached at the new heart rate.
2.4. What is and is not in the model
Compartment models by their nature are necessarily highly approximate; spatial inhomogeneity within a region is completely ignored and compartment homogenization occurs instantaneously. Beyond that, our model in particular makes further approximations:
Buffering, like the homogenization of the compartments' ion concentrations, is instantaneous by giving Ca2+ an effective larger volume for each compartment; while both processes are generally fast, the exact microsecond and location dependent results are missed. This was done because the exact rate constants of the buffers are unknown, especially for the highly unusual [Ca2+] binding dependence of calsequestrin [22]. We used experimentally measured equivalent buffering volumes when possible [1].
Not all cellular Ca2+ signaling pathways are included in the model, especially the sarcolemmal Na+/Ca2+ exchanger and dihydropyridine receptors (DHPRs). Other potential SR Ca2+ leak pathways (e.g., IP3 receptors and TRP channels) are also not included. The model has been reduced to only those fluxes relevant to address our hypothesis. As the model only addresses change in response to SR Ca release, no sarcolemmal fluxes were included in the model. For instance, analysis of the parameter space indicates that no realistic change in SR Ca2+ release due DHPR-dependent variation in excitation-contraction coupling or to realistic changes in SR [Ca2+] will alter the numbers, but not our conclusions.
RyR gating is imposed through the gating function to mimic the response of Ca2+ influx through the DHPRs, rather than in response to actual Ca2+ influx through DHPRs. Moreover, the RyRs are insensitive to subspace [Ca2+] and therefore do not exhibit Ca2+ leak out of the SR through stochastic openings. Ca2+ release due to SR Ca2+ leak is extremely slow relative to action potential-induced release. To simulate leak, we performed calculations with 1 of the ~50 RyRs always open and none of the results changed substantially (data not shown).
The goal of this work is not an exact quantitative model. By including the major SR ion pathways, we have created a model with which one can begin to qualitatively understand ion movements during the cardiac cycle.
3. Results
Fig. 3 illustrates the predicted SR Ca2+ load changes due to triggered Ca2+ release events at 3 different heart rates (60, 180, and 360 bpm; 1, 3, and 6 Hz, respectively). The time course of [Ca2+]JSR shown in the figure illustrates five important features that we will analyze further later:
Fig. 3.
The SR Ca2+ load ([Ca2+]JSR) as a function of time for the indicated heart rates. The solid black lines are for the regular SERCA model and the dashed blue lines for the SERCA × 2 model. The new steady-state diastolic and systolic Ca2+ concentrations are indicated for the standard SERCA model at 360 bpm. (For interpretation of the references to color in this figure legend, the reader is referred to the web version of this article.)
Our model produces the expected rhythmic pattern of the SR Ca2+ release-uptake cycle in a system driven solely by the periodic opening and closing of the RyRs.
At each pacing rate, both the systolic and diastolic values of all ion concentrations and membrane voltages reach a steady state within a small number of heartbeats (the peak and trough values are consistent). Moreover, the vast majority of adaptation occurs during the first beat.
The systolic and diastolic SR Ca2+ levels are heart rate dependent. For example, the diastolic SR Ca2+ load (maxima) at 360 bpmis ~60–70% of the 60 bpm load.
Ion re-equilibration occurs spontaneously. There is nothing in the model to make this happen. It occurs no matter how heart rate is changed (60 to 30, 60 to 360, or even 60 to 900 bpm; latter not shown).
The changes in the concentrations of all ion species except Ca2+ are quite small (generally <3%), but those differences are enough to establish zero net flux at the new pacing rate.
3.1. SERCA contribution
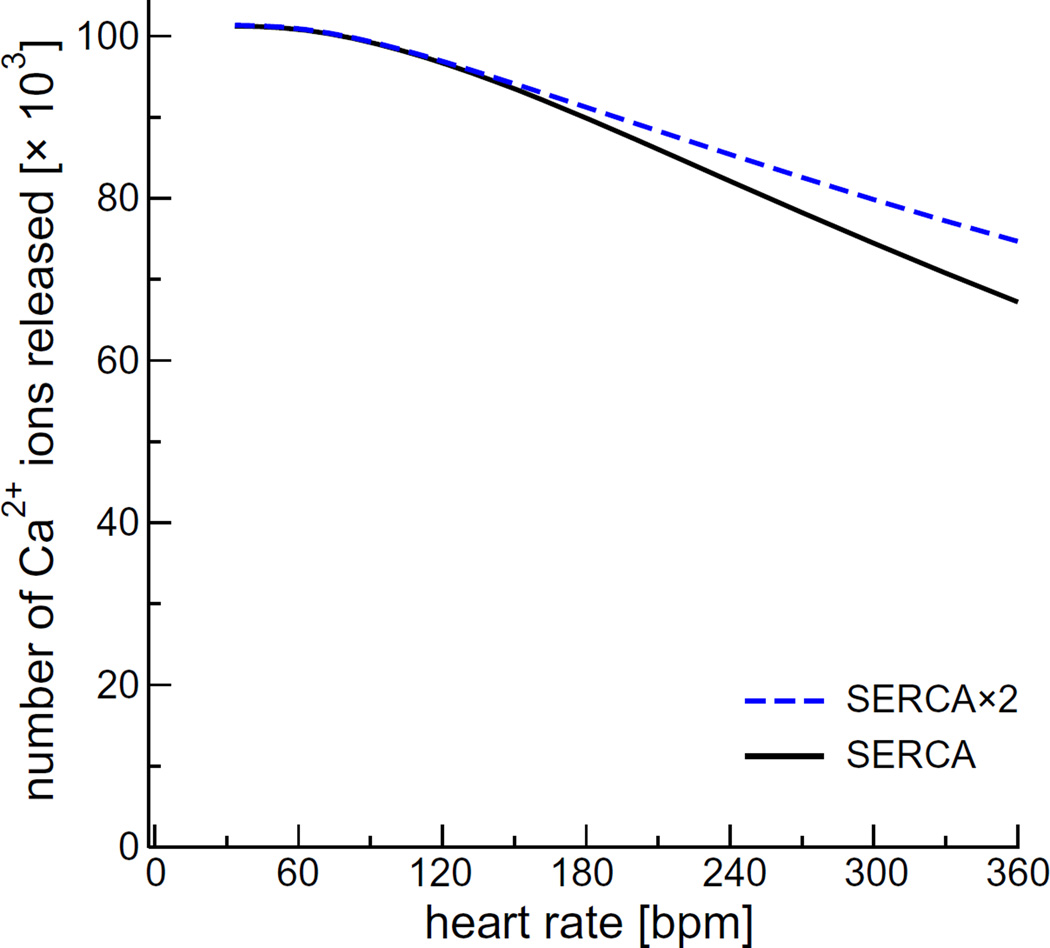
Fig. 3 also shows that doubling of the SERCA pumping rate (“SERCA × 2”) does not substantially alter the SR Ca2+ load (dashed blue line) at heart rates <180 bpm. The small increase at 180 bpm translates into a slight (<10%) increase in the number of Ca2+ ions released (Fig. 4). Doubling SERCA pump rate had a more substantial action at 360 bpm. This is representative of our subsequent finding, and therefore we include the “SERCA × 2” results in all figures with dashed lines.
Fig. 4.
The number of Ca2+ ions released by a CRU during one heartbeat as a function of pacing rate for the regular SERCA model [9] (solid black line) and the phospholamban-enhanced model with twice the pumping rate (dashed blue line). (For interpretation of the references to color in this figure legend, the reader is referred to the web version of this article.)
3.2. Ion concentration and membrane potential adaptation
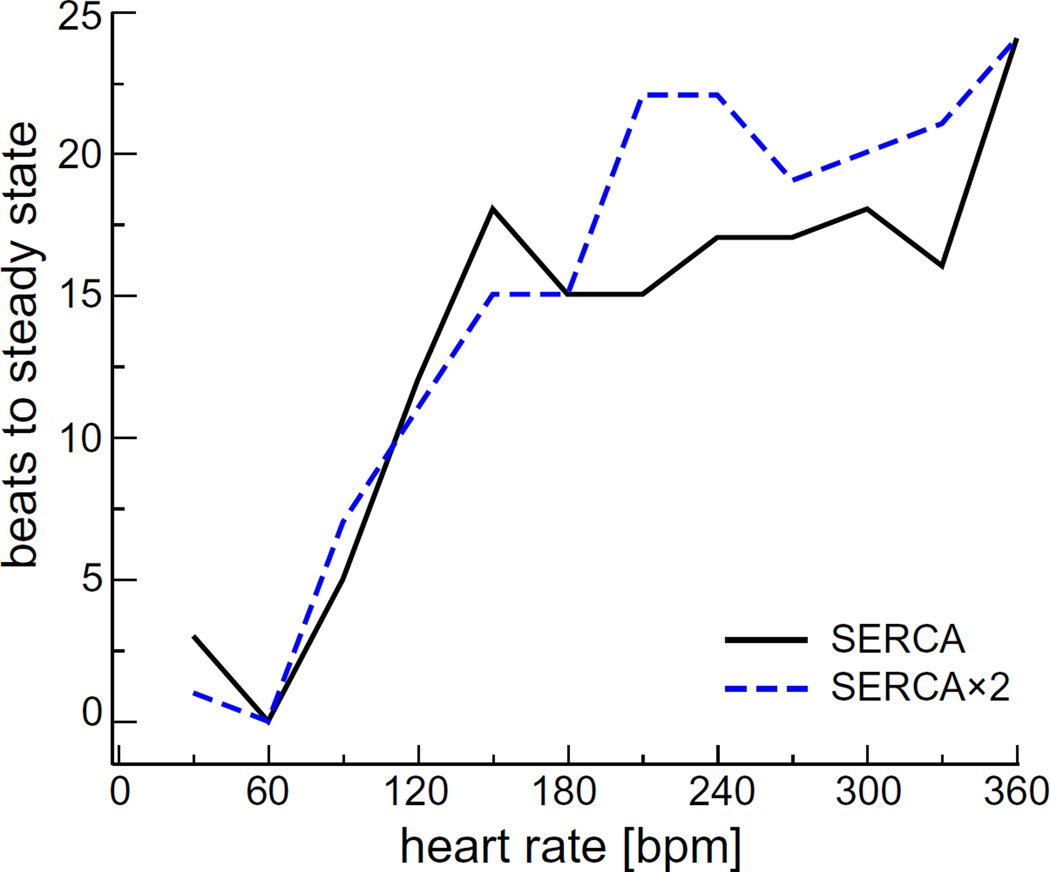
Like the JSR Ca2+ concentration shown in Fig. 3, the concentrations of Ca2+, Mg2+, K+, and Cl− in all compartments reached new steady-state levels at all the heart rates we tested. How quickly this homeostasis was achieved varied with heart rate, as shown in Fig. 5. Each line shows the number of beats needed to reach steady-state after starting with a heart rate of 60 bpm (1 Hz). Under all conditions, it always took <25 beats and <6 s (not shown) to reach the new steady state.
Fig. 5.
(Color online) The number of beats needed to reach new steady-state. These are the number of beats it took for all simulated concentrations in all compartments to have a difference of <0.01% from the previous beat. The simulation started at a pacing rate of 60 bpm (1 Hz) and, after steady state was reached, was instantaneously increased to the heart rate on the x-axis.
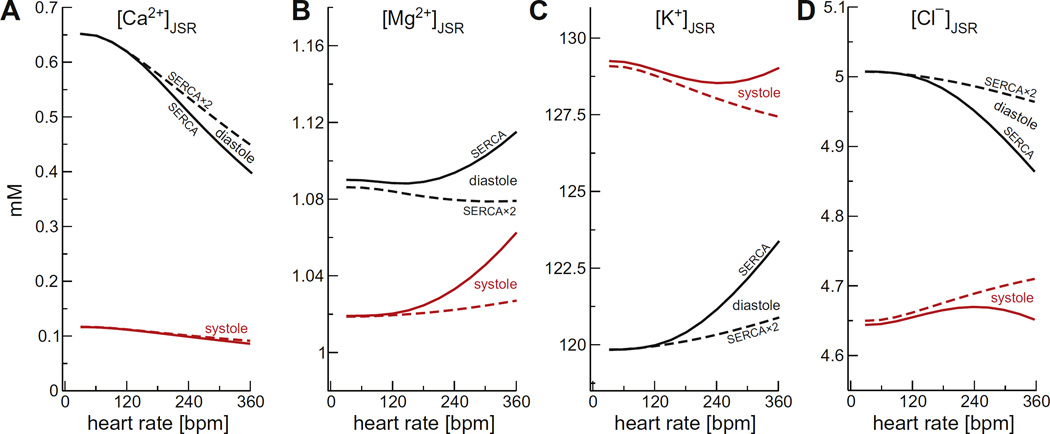
Fig. 6 shows the pacing rate dependence of the steady-state diastolic and systolic ion concentrations in the JSR (panel A: Ca2+, B: Mg2+, C: K+, D: Cl−). With the exception of the SR Ca2+ load, the changes to steady-state ion concentrations were very small, even with the slower SERCA pump. Compared to 60 bpm, the largest changes were always in the diastolic values with the slower SERCA model. For example, Mg2+ changed by <0.04 mM (~4% of the 60 bpm diastolic value), K+ by <3 mM (~2.5%), and Cl− by <0.15 mM (~3%). The faster SERCA pump significantly reduced these diastolic changes, and the largest changes were now in the systolic values; Mg2+ changed by at most <0.03 mM (~2.6% of the 60 bpm systolic value), K+ by ~1.5 mM (~1.2%), and Cl− by ~0.06 mM (~1.3%).
Fig. 6.
The steady-state ion concentrations in the JSR as a function of pacing rate for (A) Ca2+, (B) Mg2+, (C) K+, and (D) Cl−. Diastolic concentrations are shown in black and systolic concentrations in red. The solid lines are for the regular SERCA model and the dashed lines for the SERCA × 2 model. Systolic [Mg2+] was the minimum during the cycle. (For interpretation of the references to color in this figure legend, the reader is referred to the web version of this article.)
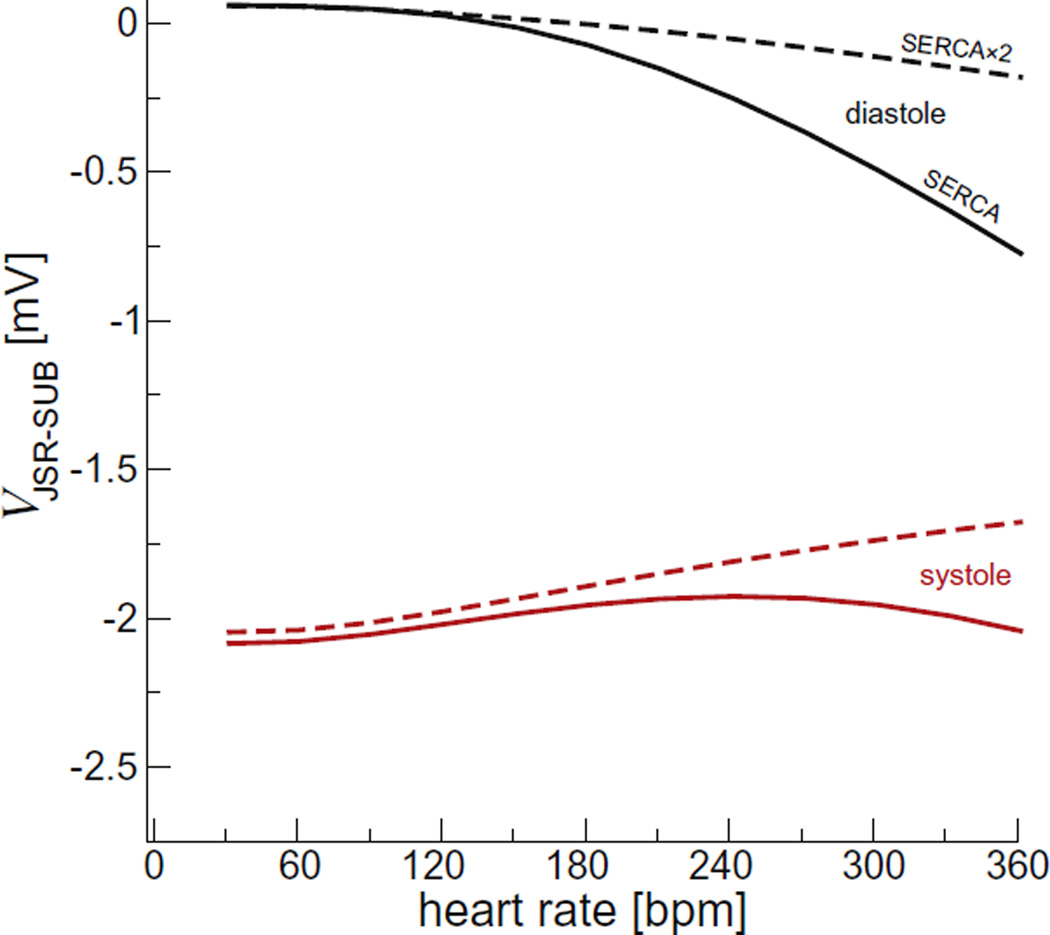
The changes in JSR membrane potential (Vm) were similarly small (Fig. 7). The end diastolic JSR Vm (Fig. 7, black) was near 0 mV at 60 bpm and −0.75 mV at 360 bpm. The peak systolic JSR Vm (Fig. 7, red) was ~−2 mV for all pacing rates. Thus, the JSR Vm change evoked by each individual Ca2+ release event was always <2.25 mV. This small amplitude change in the JSR Vm is the result of robust counter-ion flux during Ca2+ release [5].
Fig. 7.
The peak junctional SR membrane potential. Diastolic values are shown in black and the largest during systole in red. The solid lines are for the regular SERCA model and the dashed lines for the SERCA × 2 model. (For interpretation of the references to color in this figure legend, the reader is referred to the web version of this article.)
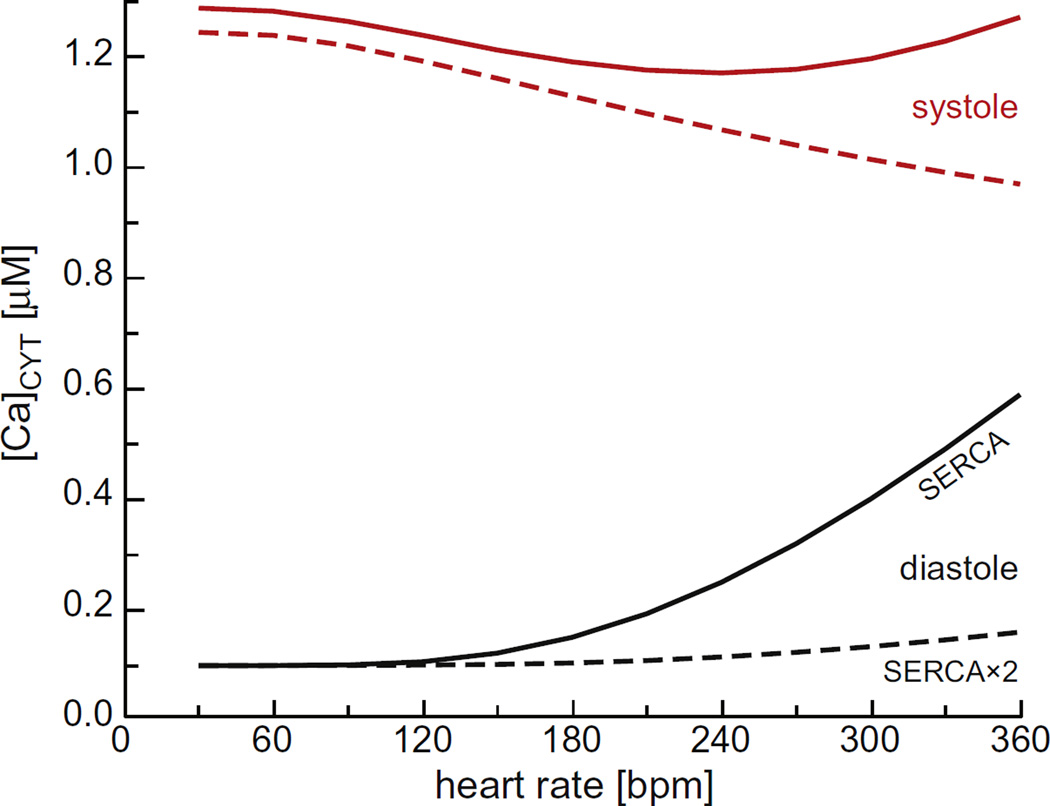
The only large changes in concentration were for Ca2+. In the JSR, Fig. 6A shows that the diastolic Ca2+ load decreased substantially with pacing rate because there was insufficient time for the SERCA pump to take up more Ca2+. There was a concomitant increase in cytosolic Ca2+ concentration, as shown in Fig. 8.
Fig. 8.
The cytosolic Ca2+ concentration as a function of pacing rate. Diastolic concentrations are shown in black and systolic concentrations in red. The solid lines are for the regular SERCA model and the dashed lines for the SERCA × 2 model. (For interpretation of the references to color in this figure legend, the reader is referred to the web version of this article.)
3.3. Robustness
In order to understand the sensitivity of the model to its parameters, we systematically adjusted key variables to extreme values. Parameters were generally paired together; the number of K+ and Cl− channels were paired, as were initial [K+] and [Mg2+] (equal in all compartments) and K+ and Mg2+ permeability through RyR. Within each pairing, all permutations of the multiplying factors 1.0, 0.5, 0.1, and 0.0 were applied to normal values. SERCA pump rate was also varied as an independent parameter with the same factors. The model was run for all of these conditions at 60 and 600 bpm. In some cases, computational issues arose when using the exact value 0, in which case 10−8 was used instead.
In general, we observed that the model is resilient to such changes in two key ways. First, the model itself always reaches homeostasis, although more extreme changes generally require more beats to achieve it. Second, the results are quantitatively similar to the normal case, but vary in physiologically important ways. To illustrate, we describe in more detail varying the total number of K+ and Cl− channels. For the case with 10% of the normal number of K+ channels and 100% of the number of Cl− channels, the maximum ion concentrations across all compartments change by 5% or less, while the peak voltages are double that of the normal case. When K+ channels are removed completely and Cl− channels remain at 100% (i.e., the total knockout of TRIC channels [7]), [Ca2+] in each compartment varies only by several percent from the normal case. While Ca2+ release appears normal, peak voltages across all membranes increase by a factor of ~20. The total removal of K+-selective channels requires all K+ ions to move through the RyR, which requires larger driving forces (voltage) than normal to maintain Ca2+ release. Similarly, in the most extreme permutation when both K+ and Cl− channels are completely removed, the peak membrane voltages increase by a factor of ~2500, while [Ca2+] in all compartments are still within several percent of the normal case.
For the cases we studied, we observed that voltages adjust much more readily than ion concentrations; ion concentrations generally stay within a factor of 2 of their normal value, and often much less for [Ca2+]. The exception to this is varying the SERCA pump rate, which has the strongest effect on [Ca2+], as expected. With SERCA pump rate turned off, [Ca2+] in the SR becomes fully depleted, and Ca2+ release stopped with micromolar [Ca2+] in all compartments and voltages <3mV. Taken together, these results show that a JSR-to-subspace Ca2+ concentration gradient produced by a working SERCA pump always produces Ca2+ release and that the feedback loops of the system (e.g., voltage changes opposing large charge movements and therefore large concentration gradients) adjust to accommodate this release.
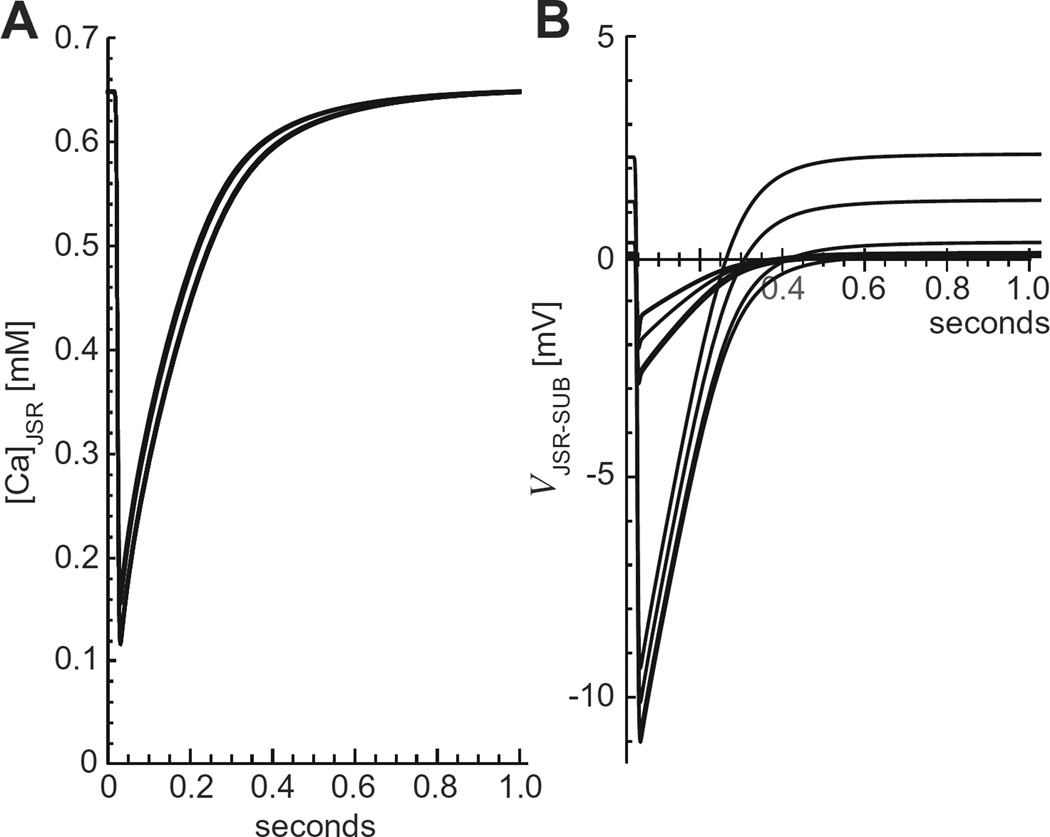
Overall, we found that Ca2+ release was strikingly similar in many cases, but there were large changes in membrane potentials while concentrations were not changed significantly; the one major exception was when the SERCA pump was turned off and Ca2+ release was not possible. Fig. 9 shows examples of this, specifically when the initial [K+] and [Mg2+] were changed. Ca2+ release is generally unaffected (Fig. 9A), but the JSR-SUB membrane potential varied widely (Fig. 9B), as did other potentials.
Fig. 9.
(A) The JSR Ca2+ concentration as a function of time at 60 bpm for different combinations of 0, 10%, 50%, and 100% of normal [K+] and [Mg2+]. (B) The JSR-SUB membrane potential for the same cases.
4. Discussion
Our equivalent circuit model of a single Ca2+ release unit is, to our knowledge, the first such model of cardiac Ca2+ release to include compartment voltages and to include all salient ions (Ca2+, Mg2+, K+ and Cl−) and their channels. Our goal was a reductionist Ca2+ release model using experimental numbers whenever possible, which required using data from several species (e.g., cell and SERCA pump parameters from rabbit [1,9], RyR permeation data from dog [23], and K+ channel data from sheep [17]). Because of this and the approximate nature of compartment models, our aim was not quantitative accuracy for a specific species, but rather a qualitative understanding of how ion concentrations and membrane voltages adjust to instantaneous changes in heart rate.
4.1. New heart rate: Small changes, big effects
The forces that move ions between compartments are their concentration gradients and voltage differences. These must be the same at the end of the contraction as at the beginning. This requires zero net flux for each ion species into and out of all compartments during each cycle. In our model, the only large variations that occur are in the Ca2+ concentrations in the JSR, subspace, and cytosol. Zero net K+, Mg2+, and Cl− flux occurs because there are small adjustments in the diastolic and systolic intercompartment voltages and concentration gradients.
If there is enough time between beats, during diastole the various SR ions will be in equilibrium with their local concentration gradients and the voltage differences producing zero net flux between the different compartments. (Even the SERCA pump flux is zero because in the model by Shannon et al. [9] this occurs when [Ca2+]NSR/[Ca2+]CYT is ~6900. Also, our model does not include diastolic SR Ca2+ leak.) In our system, this special case occurs only at pacing rates less than ~30 bpm. At higher pacing rates, there is a net flux of ions during diastole because the SERCA pump is still moving Ca2+ back into the NSR, leaving a lower JSR concentration and higher cytosolic concentration, as compared to 30 bpm (Figs. 6A and 8, black lines). Overall, the changes in the K+, Mg2+, and Cl− concentrations and voltages are relatively small. This is exemplified by the JSR concentrations and JSR-subspace voltage in Figs. 6B–C and 7 (black lines), respectively; JSR concentrations differ by <3% at all pacing rates compared to 60 bpm. All concentrations and voltages throughout the system are changed to a similar extent (data not shown). That major changes in Ca2+ concentrations (and contractility) are accommodated by small relative changes in the levels of other ionic species makes sense because small relative changes in these ions are enough to compensate for the change in total charge moved during Ca2+ release, since Ca2+ concentration is much smaller (especially compared to K+).
At the end of systole, all ion concentrations and voltages reach either a minimal or maximal value in each compartment before returning to their diastolic value. In the JSR, for example, Ca2+, Mg2+, and Cl− have minima (Fig. 6A,B,D, red lines) while K+ has a maximum (Fig. 6C, red lines). The JSR-subspace voltage is most negative (Fig. 7, red lines). Each of these values changes with pacing rate, but as with the diastolic values, they change only a few percent.
These multiple small changes in both diastolic and systolic concentrations and voltages combine to produce the necessary zero net flux of all ions over the time course of the contraction. (This was numerically verified.) Our model also reveals that the vast majority of these adjustments occurs during the first beat following an abrupt change in heart rate. For example, Fig. 3 shows that an instantaneous change from 60 to 360 bpm caused only very minor changes in JSR Ca2+ concentration after the first beat at the new faster rate. In Fig. 5 we show the number of beats needed to reach the new concentrations of all ions to within 0.01%. Even with this exacting standard, the concentration adjustments occur very quickly. This same quick adjustment has recently been shown experimentally in whole heart optical mapping of SR Ca2+ load [2].
4.2. Robustness of SR Ca2+ release and ion homeostasis
Fig. 9 shows that in general none of the changes to parameters we tried (except turning off the SERCA pump) produced significant changes in SR Ca2+ release, either its dynamics or net Ca2+ release, but they did produce significant changes in membrane potentials. The mechanism behind this robustness of SR Ca2+ release is the following: when the RyRs are closed during diastole, the SERCA pump produces a high concentration of Ca2+ in the SR; when the RyRs open, there is a large concentration gradient (equivalent to ~120 mV [5]) and Ca2+ is necessarily released since the JSR to subspace voltage never becomes large enough to oppose it; if there is a reduction in the number of avenues for countercurrent to flow, counterions still move because charge in the form of Ca2+ has crossed a membrane, but that charge causes larger membrane potentials since the same amount of charge is moved but there is more resistance to counterion flow.
Therefore, it is the large Ca2+ concentration gradient between the JSR and the subspace that always produces robust SR Ca2+ release, unless there is no pump to produce the gradient. The robustness of ion homeostasis then follows from the fact that the Ca2+ diffusing from the subspace into the cytoplasm depletes the SR membrane potentials, reversing the driving forces of the K+ and Cl− ions so that they re-equilibrate before the next release. If heart rate jumps, a new steady state of ion concentrations and voltages is reached because as less Ca2+ is released during systole (because less was pumped back into the SR, Fig. 6A), the membrane potentials are only slightly altered because the membranes are large and thus have a relatively high capacitance. Therefore, even a large jump in heart rate results in only small changes in the K+ and Cl− ions' driving forces which, over the next few cycles, can readjust to new values.
4.3. Ion concentration and membrane potential changes during muscle contraction
The main aim of this paper is to understand the cycling of ions into and out of the SR in response to changes in heart rate. A detailed description of the driving forces and countercurrents across the membranes is beyond the scope of this paper, but will be addressed in future publications. We do, however, wish to briefly discuss some aspects of ion driving forces within the SR.
So far we considered how voltages and concentrations change between diastole and systole. (An example was already shown in Fig. 2B.) These changes are also relatively small for K+, Mg2+, and Cl−. (The changes in Ca2+ concentrations in, for example, the cytosol and the JSR are already well-known [1].) Focusing on the JSR (Fig. 6), the largest absolute change is the ~5–8 mM change in K+ concentration (a ~4–7% change). The largest relative change was the ~6–8% (~0.06–0.8 mM) change in JSR Mg2+ concentration, while Cl− changed ~4–7% (~0.2–0.35 mM), depending on the pacing rate.
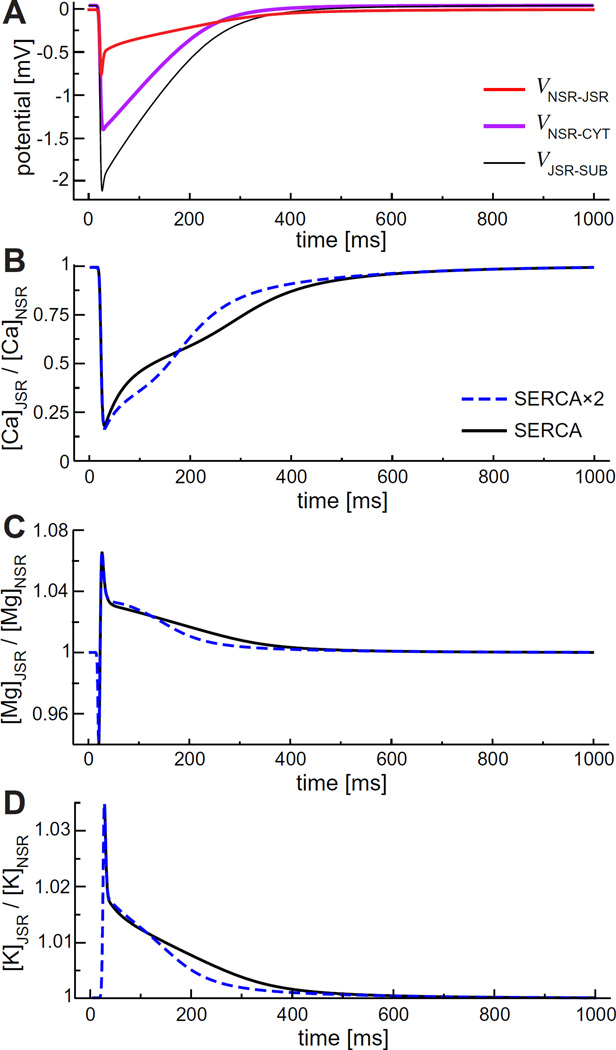
These concentrations change quickly in time, and therefore so do the ions' driving forces, specifically the inter-compartment concentration ratios and the voltages. These time courses are shown in Fig. 10 for the NSR and JSR interface. We use this as an example because the NSR is the compartment that refills the JSR with Ca2+ and the voltage aspect of this refilling has not been considered before. In general, the JSR-NSR voltage does not contribute much to the Ca2+ refill since the −0.75mV at peak is small compared to the driving force of the concentration gradient; the voltage is equivalent to a concentration gradient of ~0.97 (JSR:NSR), as compared to actual concentration gradient of ~0.25 for Ca2+ (Fig. 10B). For other ions like K+, Mg2+, and Cl−, however, the voltage component of the driving force is comparable to the concentration gradient. The importance of this effect will be studied further in future work.
Fig. 10.
(Color online) Driving forces of ions from the NSR to the JSR. (A) Electrostatic potential difference. (B–C) Concentration ratios of Ca2+, Mg2+, and K+.
Fig. 10B and C show some unexpected movements of Ca2+ and Mg2+, respectively, between the JSR and NSR. Specifically, the JSR:NSR Ca2+ concentration ratio for the two SERCA pump models intersect and the Mg2+ concentration ratio exhibits biphasic behavior.
At first glance, the intersection of the two JSR:NSR Ca2+ concentration ratios might counterintuitively indicate that the faster SERCA pump model is at times slower in refilling the JSR than the regular SERCA pump model. During Ca2+ release, the JSR Ca2+ concentration has approximately the same time course for both pump models. However, the NSR Ca2+ concentration time courses are very different because the SERCA pumps are located only on the NSR-CYT membrane, with the faster pump filling the NSR faster (data not shown) to produce the initial lower JSR:NSR Ca2+ concentration ratio seen in Fig. 10B.
The biphasic behavior of the Mg2+ diffusion driving force shown in Fig. 10C is also at first counterintuitive. During the initial stages of Ca2+ release, Mg2+ exits the JSR into the subspace (causing the initial decrease seen in Fig. 10C) and, during the final stages, reenters the JSR from the subspace (data not shown). This is the opposite of what had been hypothesized to happen [5]; Mg2+ does not act as a countercurrent to Ca2+ release, but actually initially accompanies the exiting Ca2+. Whereas previous countercurrent calculations assumed an equal concentration of Mg2+ across the SR membrane [5], here the pacing rate of the heart induces a diastolic Mg2+ concentration gradient where the JSR Mg2+ concentration is larger than in the subspace. This gradient is a consequence of ion homeostasis; it is necessary for Mg2+ to have zero net flux during the cardiac cycle. Mg2+ countercurrent and countercurrent in general will be described in more detail in future work.
4.4. Implications
Our results indicate that SR ion homeostasis is robust and rapidly self-adjusting. This is a general property of the system; even when changing some parameters to extremes (e.g., setting the number of K+ and Cl− channels to 0), the system always reaches homeostasis of all ions and voltages and produces significant Ca2+ release, unless the SERCA pump is blocked. This is consistent with the continued SR Ca2+ release observed in pathological conditions like the knock-out of half of the TRIC channels [7] or changes in cytosolic [Mg2+] due to ATP use or diseases like heart failure [24]. What is different in the physiological case is that the membrane potentials tend to be very small, on the order of ~1–2 mV, while pathological cases tend to have larger membrane potentials. This is because there are both a large number of ions, especially K+, and a large number of transmembrane pathways for those ions. Large membrane potentials can then be avoided by moving a relatively small number of ions through many channels instead a limited number of channels.
Under physiological conditions, the system responds to large beat-to-beat changes in SR and cytosolic Ca2+ concentrations with a series of small shifts in membrane potential, intra-SR voltages, and SR K+, Mg2+, and Cl− concentrations. These small changes together counteract the sudden30–40% changes in JSR Ca2+ load (Fig. 6A) and ~500% changes in cytosolic Ca2+ concentration (Fig. 8), assuring the SR achieves net ion homeostasis within just a few beats (Fig. 5). While our model does not include all ion movements (e.g., diastolic Ca2+ leak, the Na+/Ca2+ exchange pump, L-type Ca2+ channels), these are unlikely to change the SR's robust ion self-adjusting behavior we found.
The ability of the system to self-adjust in response to changes in pacing rate (or other perturbations as our analysis found) is inherent in the mathematical properties of the system, as it includes a number of natural negative-feedback mechanisms. This is similar to what other modeling studies have found generally (e.g., [25]) as well as Eisner's general “autoregulation” of SR load [26].
Our results also validate the assumption that the SR Vm is near 0 mV and remains largely unchanged during SR Ca2+ release. For example, we found that the SR Ca2+ release at high heart rates has almost no effect on JSR Vm. Also, modeling generally assumes that the voltage across the SERCA pump is small and can be ignored. Our model corroborates this assumption; in our model the NSR-JSR potential even at its peak is <0.75 mV (Fig. 10, red line).
Most of the changes we found, either in voltage or concentration, would not be experimentally detectable. Somlyo et al. [27] did measure ion movements into and out of the SR, but by comparing ion SR contents before and after a sustained skeletal muscle tetanus. These measurements cannot, however, reveal the changes in SR K+, Mg2+, and Cl− levels evoked by individual SR Ca2+ release events. Modeling like that done here is the only way to ascertain this information and to provide new insights into the SR ion homeostasis that underlies and supports the Ca2+ release cycle.
5. Conclusion
The equivalent circuit model of ion movement during cardiac muscle contraction described here reveals fast self-adjusting ion concentrations and intercompartment voltages that occur in response to systolic SR Ca2+ release. No element of our model has “knowledge” of the desired global end result of ion re-equilibration. Rather, this occurs because local ion movements across individual membranes are inherently coupled: (a) each compartment is connected to at least one other, (b) local ion movements change compartment concentrations and voltages, and (c) these changes affect ion currents across other membranes. We showed that these interconnections permits multiple small changes in multiple factors to compensate for large dynamic fluctuations in SR Ca2+ levels.
Acknowledgments
CB, DG, and MF were supported by NIH grant R01 AR054098 (MF principal investigator). This work was supported by separate grants from the American Heart Association to DG and TRS (DG: 14GRNT20380691, TRS: 14GRNT20380907).
Footnotes
Disclosures
None.
References
- 1.Bers DM. Excitation-Contraction Coupling and Cardiac Contractile Force. second. Dordrecht, The Netherlands: Kluwer Academic Publishers; 2001. [Google Scholar]
- 2.Wang L, Myles RC, De Jesus NM, Ohlendorf AKP, Bers DM, Ripplinger CM. Optical mapping of sarcoplasmic reticulum Ca2+ in the intact heart: ryanodine receptor refractoriness during alternans and fibrillation. Circ. Res. 2014;114:1410–1421. doi: 10.1161/CIRCRESAHA.114.302505. [DOI] [PMC free article] [PubMed] [Google Scholar]
- 3.Coronado R, Rosenberg RL, Miller C. Ionic selectivity, saturation, and block in a K+-selective channel from sarcoplasmic reticulum. J. Gen. Physiol. 1980;76:425–446. doi: 10.1085/jgp.76.4.425. [DOI] [PMC free article] [PubMed] [Google Scholar]
- 4.Rousseau E, Roberson M, Meissner G. Properties of single chloride selective channel from sarcoplasmic reticulum. Eur. Biophys. J. 1988;16:143–151. doi: 10.1007/BF00261900. [DOI] [PubMed] [Google Scholar]
- 5.Gillespie D, Fill M. Intracellular calcium release channels mediate their own countercurrent: the ryanodine receptor case study. Biophys. J. 2008;95:3706–3714. doi: 10.1529/biophysj.108.131987. [DOI] [PMC free article] [PubMed] [Google Scholar]
- 6.Guo T, Nani A, Shonts S, Perryman M, Chen H, Shannon TR, et al. Sarcoplasmic reticulum K+ (TRIC) channel does not carry essential countercurrent during Ca2+ release. Biophys. J. 2013;105:1151–1160. doi: 10.1016/j.bpj.2013.07.042. [DOI] [PMC free article] [PubMed] [Google Scholar]
- 7.Yazawa M, Ferrante C, Feng J, Mio K, Ogura T, Zhang M, et al. TRIC channels are essential for Ca2+ handling in intracellular stores. Nature. 2007;448:78–82. doi: 10.1038/nature05928. [DOI] [PubMed] [Google Scholar]
- 8.Soeller C, Crossman D, Gilbert R, Cannell MB. Analysis of ryanodine receptor clusters in rat and human cardiac myocytes. Proc. Natl. Acad. Sci. 2007;104:14958–14963. doi: 10.1073/pnas.0703016104. [DOI] [PMC free article] [PubMed] [Google Scholar]
- 9.Shannon TR, Wang F, Puglisi J, Weber C, Bers DM. A mathematical treatment of integrated Ca dynamics within the ventricular myocyte. Biophys. J. 2004;87:3351–3371. doi: 10.1529/biophysj.104.047449. [DOI] [PMC free article] [PubMed] [Google Scholar]
- 10.Baylor SM, Chandler WK, Marshall MW. Calcium release and sarcoplasmic reticulum membrane potential in frog skeletal muscle fibres. J. Physiol. Lond. 1984;348:209–238. doi: 10.1113/jphysiol.1984.sp015106. [DOI] [PMC free article] [PubMed] [Google Scholar]
- 11.Koss KL, Kranias EG. Phospholamban: a prominent regulator of myocardial contractility. Circ. Res. 1996;79:1059–1063. doi: 10.1161/01.res.79.6.1059. [DOI] [PubMed] [Google Scholar]
- 12.Simmerman HKB, Jones LR. Phospholamban: protein structure, mechanism of action, and role in cardiac function. Physiol. Rev. 1998;78:921–947. doi: 10.1152/physrev.1998.78.4.921. [DOI] [PubMed] [Google Scholar]
- 13.Hille B, editor. Ion Channels of Excitable Membranes. third. Sunderland: Sinauer Associates Inc.; 2001. [Google Scholar]
- 14.Gillespie D. Energetics of divalent selectivity in a calcium channel: the ryanodine receptor case study. Biophys. J. 2008;94:1169–1184. doi: 10.1529/biophysj.107.116798. [DOI] [PMC free article] [PubMed] [Google Scholar]
- 15.Picht E, Zima AV, Shannon TR, Duncan AM, Blatter LA, Bers DM. Dynamic calcium movement inside cardiac sarcoplasmic reticulum during release. Circ. Res. 2011;108:847–856. doi: 10.1161/CIRCRESAHA.111.240234. [DOI] [PMC free article] [PubMed] [Google Scholar]
- 16.Rossi D, Barone V, Giacomello E, Cusimano V, Sorrentino V. The sarcoplasmic reticulum: an organized patchwork of specialized domains. Traffic. 2008;9:1044–1049. doi: 10.1111/j.1600-0854.2008.00717.x. [DOI] [PubMed] [Google Scholar]
- 17.Pitt SJ, Park K-H, Nishi M, Urashima T, Aoki S, Yamazaki D, et al. Charade of the SR K+-channel: two ion-channels, TRIC-A and TRIC-B, masquerade as a single K+-channel. Biophys. J. 2010;99:417–426. doi: 10.1016/j.bpj.2010.04.051. [DOI] [PMC free article] [PubMed] [Google Scholar]
- 18.Santiago DJ, Ríos E, Shannon TR. Isoproterenol increases the fraction of spark-dependent RyR-mediated leak in ventricular myocytes. Biophys. J. 2013;104:976–985. doi: 10.1016/j.bpj.2013.01.026. [DOI] [PMC free article] [PubMed] [Google Scholar]
- 19.Stern MD, Ríos E, Maltsev VA. Life and death of a cardiac calcium spark. J. Gen. Physiol. 2013;142:257–274. doi: 10.1085/jgp.201311034. [DOI] [PMC free article] [PubMed] [Google Scholar]
- 20.Weber CR, Piacentino V, Ginsburg KS, Houser SR, Bers DM. Na+-Ca2+ exchange current and submembrane [Ca2+s] during the cardiac action potential. Circ. Res. 2002;90:182–189. doi: 10.1161/hh0202.103940. [DOI] [PubMed] [Google Scholar]
- 21.Hatano A, Okada J-i, Washio T, Hisada T, Sugiura S. A three-dimensional simulation model of cardiomyocyte integrating excitation-contraction coupling and metabolism. Biophys. J. 2011;101:2601–2610. doi: 10.1016/j.bpj.2011.10.020. [DOI] [PMC free article] [PubMed] [Google Scholar]
- 22.Lewis KM, Ronish LA, Ríos E, Kang C. Characterization of two human skeletal calsequestrin mutants implicated in malignant hyperthermia and vacuolar aggregate myopathy. J. Biol. Chem. 2015;290:28665–28674. doi: 10.1074/jbc.M115.686261. [DOI] [PMC free article] [PubMed] [Google Scholar]
- 23.Xu L, Mann G, Meissner G. Regulation of cardiac Ca2+ release channel (ryanodine receptor) by Ca2+, H+, Mg2+, and adenine nucleotides under normal and simulated ischemic conditions. Circ. Res. 1996;79:1100–1109. doi: 10.1161/01.res.79.6.1100. [DOI] [PubMed] [Google Scholar]
- 24.Haigney MCP, Wei S, Kaab S, Griffiths E, Berger R, Tunin R, et al. Loss of cardiac magnesium in experimental heart failure prolongs and destabilizes repolarization in dogs. J. Am. Coll. Cardiol. 1998;31:701–706. doi: 10.1016/s0735-1097(97)00524-x. [DOI] [PubMed] [Google Scholar]
- 25.Walker Mark A, Williams George SB, Kohl T, Lehnart Stephan E, Jafri MS, Greenstein Joseph L, et al. Superresolution modeling of calcium release in the heart. Biophys. J. 2014;107:3018–3029. doi: 10.1016/j.bpj.2014.11.003. [DOI] [PMC free article] [PubMed] [Google Scholar]
- 26.Eisner DA, Trafford AW, Dñaz ME, Overend CL, O'Neill SC. The control of Ca release from the cardiac sarcoplasmic reticulum: regulation versus autoregulation. Cardiovasc. Res. 1998;38:589–604. doi: 10.1016/s0008-6363(98)00062-5. [DOI] [PubMed] [Google Scholar]
- 27.Somlyo AV, Gonzalez-Serratos HG, Shuman H, McClellan G, Somlyo AP. Calcium release and ionic changes in the sarcoplasmic reticulum of tetanized muscle: an electron-probe study. J. Cell Biol. 1981;90:577–594. doi: 10.1083/jcb.90.3.577. [DOI] [PMC free article] [PubMed] [Google Scholar]


