

Abstract
Objective
To examine the influence of physician and hospital market structures on medical technology diffusion, studying the diffusion of drug‐eluting stents (DESs), which became available in April 2003.
Data Sources/Study Setting
Medicare claims linked to physician demographic data from the American Medical Association and to hospital characteristics from the American Hospital Association Survey.
Study Design
Retrospective claims data analyses.
Data Collection/Extraction Methods
All fee‐for‐service Medicare beneficiaries who received a percutaneous coronary intervention (PCI) with a cardiac stent in 2003 or 2004. Each PCI record was joined to characteristics on the patient, the procedure, the cardiologist, and the hospital where the PCI was delivered. We accounted for the endogeneity of physician and hospital market structure using exogenous variation in the distances between patient, physician, and hospital locations. We estimated multivariate linear probability models that related the use of a DES in the PCI on market structure while controlling for patient, physician, and hospital characteristics.
Principal Findings
DESs diffused faster in markets where cardiology practices faced more competition. Conversely, we found no evidence that the structure of the hospital market mattered.
Conclusions
Competitive pressure to maintain or expand PCI volume shares compelled cardiologists to adopt DESs more quickly.
Keywords: Market structure, medical technology diffusion
Over the last 50 years, innovation in medical technology has been a key driver in improving life expectancy (Cutler and McClellan 2001) and escalating health care costs (Newhouse 1992; Smith, Newhouse, and Freeland 2009). The evidence suggests that medical technology innovations have been cost‐effective in improving population health, but the distribution of these gains has been uneven. Several studies have proposed that specialization in intensive treatments can lead to greater treatment variation (Chandra and Staiger 2007; Chandra and Skinner 2009; Skinner and Staiger 2009). Overall, the observed geographic variation suggests that new medical technologies are often under‐ and overutilized, and that the diffusion of medical care technology may not be optimal. Given the large cost and health consequences of over‐ and underuse, the welfare loss from nonoptimal diffusion of medical technologies is likely significant.
The literature on medical technology diffusion dates back to the 1960s (Coleman et al. 1966). Most studies have focused on variations in diffusion across hospitals (Chandra, Malenka, and Skinner 2014) and have primarily looked at hospital‐level diffusion of high‐cost procedures (Bloom, Hillman, and Schwartz 1991; Fendrick et al. 1994) like magnetic resonance imaging and computed tomography scanners (Banta 1980; Hillman et al. 1984; Hillman and Schwartz 1985; Steinberg, Sisk, and Locke 1985a,b; Baker and Wheeler 1998). However, physicians are the key agent in determining whether a patient receives a given medical technology. This suggests that understanding the forces that affect physician technology adoption is necessary to address disparities in medical technology use. Research on physician technology adoption is scarce, and most studies that do exist have only focused on a limited set of physician characteristics such as age, urban versus rural location, and type of practice (solo/group) (Freiman 1985; Forte et al. 2008; Hollingsworth et al. 2008).
In this paper, we examined the role market structure played in the diffusion of new medical technology. In general, market structure describes the number and relative size of providers in a market. The role of provider market structure on medical technology diffusion is unknown, but empirical research from nonhealth care industries has demonstrated that new technology diffusion occurs more quickly in the presence of more competition (Levin, Levin, and Meisel 1987; Seim and Vaiard 2011).
Using a 100 percent fee‐for‐service Medicare population, we investigated the adoption of drug‐eluting stents (DESs), a breakthrough medical technology that was introduced into the U.S. market in April 2003 for use in percutaneous coronary intervention (PCI), a common interventional cardiology procedure used to widen constricted coronary arteries. Our focus was whether variation in the use of DESs was related to the PCI market structure cardiologists and hospitals faced when the technology was first introduced.
Background on DESs and Market Introduction
Stents are used in PCI. A PCI typically involves the insertion of a catheter from an artery in the groin to a narrowed or blocked artery of the heart. The balloon inflates and widens the constricted artery, thereby restoring blood circulation to the heart. Traditionally, the main complication of PCI has been restenosis, where the affected artery re‐narrows, requiring patients to undergo repeat PCIs (Shih and Berliner 2008).
Drug‐eluting stents comprised the latest breakthrough in stent technology for PCI. The DES is a stent coated with drugs designed to prevent or slow restenosis (Groeneveld et al. 2008b). At the time of its introduction, the DES was largely considered a significant improvement over other stent technologies for most patients.
The Cypher stent (produced by Cordis Corporation, a subsidiary of Johnson & Johnson; Fremont, California, USA) was the first DES approved for use in the United States and was released into the PCI market in April 2003. The new technology spread quickly, and within 6 months, the Cypher stent was being used in 60 percent of all PCIs (Malenka et al. 2008). Cypher controlled the DES market until March 2004 when the Taxus stent (produced by Boston Scientific; Marlborough, MA, USA) was approved for use by the FDA. By June 2004, with both DES products on the market, 90 percent of PCI procedures were using the new technology (Rao et al. 2006; Groeneveld et al. 2008a; Malenka et al. 2008).
Conceptual Framework and Hypotheses on Market Structure
Providers are interested in delivering quality health services to their patients, but they are also motivated by the profitability of those services. While new technology impacts both objectives directly, we conjectured that the returns from adoption are not uniform across different market structures. Markets with more competition over patient volume likely create stronger incentives to develop comparative advantages over rivals to retain or attract patients. Adopting the latest technology is believed to be a strong and apparent signal of care quality, an important factor for patients (or their primary care physicians) deciding over providers. On the other hand, markets with greater competition may also operate under smaller price‐cost margins and weaker bargaining positions with payers. This increases the chance that incremental cost differences between old and new technologies will prevent providers from adopting the new technology.
These competing notions have a strong theoretical basis. The Fudenberg and Tirole (1985) model predicted that markets with more firms will speed up technology adoption by increasing the opportunities for stealing business. The Reinganum (1981) model, on the other hand, predicted that market structure has an ambiguous effect on innovation: more firms may increase incentives to adopt technology early to gain a competitive advantage, but more firms will also reduce postadoption gains as the incentives will be split across a larger number of agents.
The market for PCI with stent technology has several features that allow us to make more definitive hypotheses at the cardiologist and hospital level. Acquiring materials for inpatient procedures like PCI is typically an institutional responsibility. This means that it is the hospital that directly faces the incremental supply costs from adoption. As gainsharing agreements between cardiologists and their hospitals were largely nonexistent during our study period (Wilensky, Wolter, and Fischer 2007), we believe cardiologists were not directly sensitive and possibly indifferent about the incremental costs associated with adopting DESs. In addition, cardiologist payments from the Centers for Medicare & Medicaid Services (CMS) did not vary by stent type, meaning there was no financial incentive pushing them to use DES technology. In the absence of price‐cost differences, technology adoption at the cardiologist level would have only been driven by the desire to improve the effectiveness of PCI and the desire to attract patients. It is likely that the pressure to retain or expand PCI volume share following the introduction of a breakthrough stent technology would have been more compelling in PCI markets where patients had more choice over cardiologists. We conjectured that markets with more competition among cardiologists (or cardiology practices) delivering PCI would have experienced faster technology diffusion.
This compulsion would hold at the hospital level as well. Hospitals make substantial investment in institutional assets necessary to deliver PCI (i.e., catheterization laboratories), and the relative profitability of inpatient cardiology programs. Institutional cardiology programs typically compete for patients through their admitting cardiologists, and by offering the latest stent technology, hospitals could attract cardiologists interested in using DESs. Indeed, surveys suggest that “a new medical arms race” had emerged during this period, in large part to the waning influence of managed care and the entry of specialty care hospitals and clinical service lines (Devers, Brewster, and Casalino 2003; Berenson, Bodenheimer, and Pham 2006). We conjectured that DES technology would have diffused faster in these markets with higher competition among hospitals.
However, understanding adoption at the hospital level requires more explanation. Unlike cardiologists, the hospital price‐cost margin changed with DES. The list price of the first DES technology, the Cypher stent, was $3,195, approximately $2,000 more per stent than bare‐metal stent (BMS) technology (Hodgson et al. 2004). While some hospitals received substantial discounts on the list price (Avery et al. 2004), the decision to adopt came with a steep increase in material costs. Because DES was believed to significantly improve the effectiveness of PCI, CMS created two new DRGs that reimbursed hospitals on average $1,800 more per PCI to offset the higher price of the new technology. After adjusting this base amount by geographic location and other factors, the average hospital was believed to have received $2,200 more per PCI under these new DRG codes (Hodgson et al. 2004). This means that inserting a DES over BMS was only slightly more profitable for the average hospital. Factors such as urban location, charity care, teaching status, and hospital size (e.g., volume discounts) would have improved the price‐cost margin on DES, yet many hospitals did not have these advantages. Therefore, in the case of hospitals, it is ultimately an empirical question whether more competitive market structures were associated with more DES use, supporting our compulsion story, or if more competitive structures were associated with less DES use, supporting the notion that insufficient incentives existed in these markets to adopt the new technology.
Market structure is only one of several possible reasons for provider variation in DES use. Indeed, differential rate of DES use across cardiologists or hospitals could reflect a natural heterogeneity in preferences toward new technology and in perceived adoption costs. For example, large hospitals that are more established may possess economies of scale when purchasing DESs, resulting in lower per unit costs. Teaching hospitals, higher quality hospitals, higher volume hospitals, or cardiac intensive care hospitals may have better resources for informing physicians and staff on the benefits of DESs. These hospitals also may have received preferential marketing from Cordis or Boston Scientific, making DES adoption more likely. Similarly, older physicians, those with longer work history, better reputations, or higher volumes may have more information on the benefits of the DES. These more experienced physicians may have been involved in the initial DES clinical trials, making them more informed and comfortable adopting the new technology. Overall, we hypothesized that these physician and hospital heterogeneities, which are likely related to the perceived benefits and costs from adopting a new technology, will influence DES use. In our analysis of the association between DES adoption and market structure, we controlled for these characteristics to better isolate our relationship of interest.
Methods
Data Sources and Study Sample
Our primary data sources were the Medicare Standard Analytic Files (SAF), the final action claim records submitted by noninstitutional providers. Our study sample included all Medicare Fee‐for‐Service (FFS) beneficiaries identified in the Medicare Carrier SAF (Part B or physician claim record) as having received a PCI in either 2003 or 2004. The PCIs were identified in the Carrier SAF using Current Procedural Terminology codes of 92980, 92981, 92982, or 92984. The cardiologist performing the PCI and the cardiologist's practice were identified on each PCI claim in the Carrier SAF by the performing physician identifier (UPIN) and the tax‐identifier (TAXNUM). The ZIP code of the performing physician was also identified on each PCI claim in the Carrier SAF. We connected the Carrier SAF with the American Medical Association (AMA) Masterfile using the UPIN to extract characteristics on each cardiologist performing PCI. We used the Beneficiary Summary Files to extract demographic and enrollment information on each patient receiving PCI, including the ZIP code of the patient's residence.
Next, we acquired the entire calendar year of physician claims and facility claims for each patient with an identified PCI in 2003 and/or 2004. Using these SAFs, we identified a large set of patient comorbidities and an indicator for whether the patient's PCI involved the placement of a DES (see Appendix SA2 for a detailed list of codes). We linked the PCI claim from the Carrier SAF to the PCI claim in the Inpatient and Outpatient SAF to incorporate the identity of the facility where the PCI was performed. We also merged the facility claims with the American Hospital Association (AHA) Annual Survey using a unique facility identifier (PRVDRNUM), extracting detailed information on the characteristics of the hospital (which included the hospital's ZIP code). We also incorporated information on the patient's mortality following PCI using the Medicare Vital Status Files (current as of 2011). Finally, we used the U.S. Census Tiger Files to find latitude and longitude coordinates for each ZIP centroid. This allowed us the ability to calculate the distance between patient and provider ZIP (values we used to estimate physician and hospital market structure).
Patient and Procedure Characteristics
Patient characteristics included sex, age, race/ethnicity (white, African American, Asian, Hispanic, Native American), and metropolitan residence. We created the Charlson comorbidity score for each patient using their Inpatient SAF claims and the AHRQ algorithm for identifying comorbidities in the patient's ICD‐9 diagnosis and procedure codes.1 Not all patients were considered appropriate for DESs. In general, DESs need to be supplemented with dual antiplatelet therapy for at least a year to reduce the incidence of thrombosis. We identified patients that were less likely to tolerate antiplatelet therapy as those with a high risk of bleeding (e.g., ulcers, gastrointestinal bleeding, chronic liver disease, cirrhosis) or patients with poor platelet function (like those with end‐stage renal disease). We also identified patients with a non‐PCI surgical claim within 2 weeks of the indexed PCI. We did this because antiplatelet therapy is usually stopped shortly before a surgery, making DESs less appropriate for these patients. Finally, we identified patients with substance abuse, bipolar disease, and other mental health disorder history (e.g., delusional disorders or schizophrenic disorders), as these patients may be less likely to adhere to antiplatelet therapy.
We created several procedure level characteristics for each PCI. These included whether the procedure was admitted through the emergency room, whether the PCI was conducted in an inpatient or an outpatient facility, and whether the procedure took place on a weekday or weekend.
Cardiologist Characteristics
Cardiologist characteristics from the AMA Masterfile included sex, age, number of years since medical school graduation, medical school ranking (per the U.S. News and World Report), and whether the cardiologist attended a foreign medical school. In addition, we constructed several cardiologist characteristics using the Carrier SAF for each quarter‐year. We created a count of practices each cardiologist was affiliated with (which is the per cardiologist count of unique TAXNUMs within each quarter‐year), a count of unique cardiologists within each practice, and an indicator for solo practice (where the practice had one cardiologist, and that cardiologist was not affiliated with any other practice). In addition, we created counts of PCIs with and without a stent conducted by the cardiologist in each quarter‐year.2 Finally, we used the Medicare vital status file and the Medicare SAFs from 2002 to construct a proxy measure of baseline physician quality. In particular, we estimated a PCI level model of 30‐day mortality (from the PCI claim date) as the dependent variable, which we adjusted by patient age, gender, race/ethnicity, comorbidity indicators, an indicator for admission through the emergency room, and physician fixed effects. We used the parameters from this model and the sample means to calculate each physician's adjusted mortality rate over their PCIs in 2002 (the year prior to DES introduction).
Hospital Characteristics
From the AHA annual survey, we included hospital characteristics such as ownership type (government‐owned, nonprofit, for‐profit), teaching hospital status, system affiliation, whether the hospital is a cardiac intensive care hospital, and whether the hospital has a free‐standing or hospital‐based outpatient center. From the Medicare SAFs, we added quarterly hospital volume of PCI with and without a stent and estimated an adjusted mortality rate for each hospital's PCIs in 2002 (following the method described above for cardiologists).
Measuring Market Structure
The traditional Herfindahl–Hirschman Index (HHI) measures market structure by aggregating the squared volume shares (from each firm) of a market. A market is typically defined by a product or service (e.g., PCI, inpatient care) and a geographic area (e.g., county, HRR), definitions that are often made ad hoc. Larger HHI values represent markets with fewer participants and/or uneven volume shares, indicating that the market is more consolidated (less competitive). However, there are well‐known biases associated with using the HHI to describe market structure in health care markets. The HHI does not account for the distribution of patients and providers within a geographic area. In addition, provider volume shares are believed to be a function of differentiating factors like physician or hospital quality, which are typically unobserved to researchers. Because adopting new medical technologies like DES benefits the patient's outcome, it is likely the case that diffusion is also a function of these unobserved factors. Estimates of the relationship between market structure (as measured by the traditional HHI) and technology diffusion will be biased due to unobservable aspects of technology adoption and patient outcomes being correlated with observed market shares.
We employed the approach of Kessler and McClellan (2000) and Gowrisankaran and Town (2003) to construct HHI measures that are independent of unobserved provider quality, allowing us to observe the relationship between market structure and DES diffusion. We considered the cardiology practice as the firm (relevant economic agent), identifying practices using the cardiologist tax‐identifier (TAXNUM) from each PCI in the data. Our measure of the market structure is based on a model that describes how patients choose their cardiology practice. Similar to prior literature cited, we assume that the distance from patient's home to the cardiology practice is exogenous, meaning that it is associated with whether a patient chooses the cardiology practice, but it is not related to the DES use of cardiologists in that practice.
Having identified the set of cardiologist practices delivering PCI for each patient, we estimated the parameters of a conditional logit model of the patient's choice of cardiology practice using the method outlined in Berry (1994). In this model, we defined the choice set of cardiology practices for each patient to be those within 50 miles of the patient's home. In addition, to allow for patients choosing practices much further away from their homes, we defined an outside choice for each patient as those practices outside the 50 mile radius that serve patients from the same ZIP.3 The dependent variable in this choice model was ln(sh jk) – ln(sh 0k), where sh jk was the market share of practice j in ZIP k (the proportion of patients in ZIP k choosing practice j), and sh 0k was the share of patients living in ZIP k who chose a practice outside of the choice set (beyond the 50 mile radius). The explanatory variables we included in this choice model were the distance from the patient's home ZIP to the ZIP of the cardiologist's office, the square of that distance, and a set of practice fixed effects. We hypothesized that the market share of a given practice decreased with the distance between the patient's home and the practice. Using the predicted market shares for each practice, we computed predicted HHI for cardiology practices for each ZIP k (). Next, we constructed a practice‐level HHI () to characterize the market structure each practice faces as the weighted average of practice j 's volume across all ZIPs. We used the predicted share of practice j 's total volume in each ZIP as weights (see Appendix SA2 for more detail).
Following the same steps outlined above, we constructed the hospital analog of , and referred to it as , where the h indexes the hospital. We estimated and separately for 2003 and 2004, adding the subscript t to index the year.
Empirical Specification
The unit of analysis was the PCI that involved a cardiac stent. The binary outcome variable was the use of DES (over BMS) for patient i, treated by cardiologist j in hospital h in period t. We estimated a linear probability model to relate the DES use to patient and procedure characteristics (X i), cardiologist characteristics (C jt), hospital characteristics (H ht), market structure of the cardiology practice (), and of the hospital (). We clustered the standard errors at the cardiologist level. We constructed an indicator for the post‐April 2004 period (when the DES reached a steady state), and interacted this with our predicted HHI quartiles for cardiology practices and hospitals. We also included fixed effects for the corresponding HRR of the cardiologist's practice location.
Results
Figure 1 demonstrates monthly DES use across cardiologists delivering PCI with a stent. Each line in the figure charts a different cardiologist percentile over time, ranging from the 10th percentile to the 90th percentile. Each percentile line shows how DES use varied from no‐DES use (DES use = 0) to strictly DES use (DES use = 1). The vertical line for April 2004 corresponds to the market introduction of the second DES product: the Taxus stent from Boston Scientific. Despite the rapid diffusion of DES, substantial differences in use existed across cardiologists. At least 10 percent of cardiologists did not use a DES until April 2004, while the top 10 percent of users were placing a DES in over 80 percent of their PCIs by May 2003 (only 1 month after the technology was introduced). Moreover, the lines showing the 25th and 75th percentile are separated by 30 to 80 percentage points over the study period, showing that considerable variation existed across cardiologists between the bottom and top quartiles of DES users. In particular, DES use on the 25th percentile was 0.0 in May 2003, 0.6 by April 2004, and 0.8 by December 2004, while DES use on the 75th percentile was 0.5 in May 2003 and 1.0 by December 2003. Similar variation existed across hospitals (results not shown).
Figure 1.
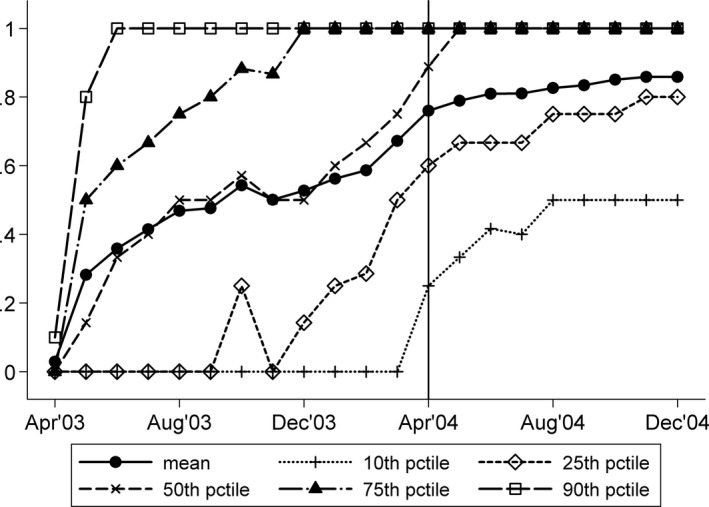
Distribution of Physician DES Use over Time (N = 631,202 PCIs with a Cardiac Stent; 8,611 Unique Cardiologists)
Table 1 presents descriptive statistics on the PCIs in our sample. From April 2003 through December 2004, there were 631,202 PCIs with a stent performed on 537,492 unique patients. Of these, we identified two distinct groups of PCI: those with a DES (N = 399,807) and those with a BMS (N = 231,395). The average PCI with a stent is delivered to a patient aged 73 years (SD 8.8), and almost 90 percent of these patients were non‐Hispanic white. The majority of patients were males (58 percent) and resided in urban areas (69 percent). A sizable fraction of the PCIs were admitted through the emergency room (28 percent overall), and in almost 18 percent of cases, patients had a medical condition where DESs would have been considered less appropriate for use (referred to as DES indication).
Table 1.
Descriptive Statistics of the PCI sample, April 2003–December 2004: Patient, Cardiologist, and Hospital Characteristics
| No. Unique Patients | PCIs with Stent | PCIs with DESs | PCIs with BMSs |
|---|---|---|---|
| N = 631,202 | N = 399,807 | N = 231,395 | |
| N = 537,492 | N = 351,904 | N = 210,178 | |
| Patient and procedure characteristics | |||
| Female (1/0) | 0.417 (0.493) | 0.423 (0.494) | 0.407 (0.491) |
| Age | 72.900 (8.791) | 72.725 (8.696) | 73.202 (8.943) |
| White | 0.897 (0.304) | 0.899 (0.301) | 0.892 (0.310) |
| African American (1/0) | 0.064 (0.245) | 0.061 (0.240) | 0.068 (0.253) |
| Asian (1/0) | 0.010 (0.099) | 0.010 (0.102) | 0.009 (0.093) |
| Hispanic (1/0) | 0.017 (0.128) | 0.016 (0.126) | 0.018 (0.132) |
| Native American (1/0) | 0.004 (0.065) | 0.004 (0.063) | 0.005 (0.070) |
| Other race (1/0) | 0.008 (0.088) | 0.008 (0.091) | 0.007 (0.082) |
| Resides in a metro area (1/0) | 0.689 (0.463) | 0.699 (0.459) | 0.671 (0.470) |
| Stent inserted (1/0) | 1.000 (0.000) | 1.000 (0.000) | 1.000 (0.000) |
| DES inserted (1/0) | 0.633 (0.482) | 1.000 (0.000) | 0.000 (0.000) |
| Admitted through emergency room (1/0) | 0.278 (0.448) | 0.253 (0.435) | 0.322 (0.467) |
| Inpatient procedure (1/0) | 0.933 (0.249) | 0.934 (0.249) | 0.933 (0.250) |
| Weekend procedure (1/0) | 0.073 (0.259) | 0.065 (0.246) | 0.086 (0.280) |
| Charlson Index (1/0) | 2.402 (1.943) | 2.344 (1.902) | 2.503 (2.007) |
| Any DES indication (1/0) | 0.178 (0.383) | 0.172 (0.378) | 0.189 (0.391) |
| Cardiologist characteristics | |||
| Years since medical school graduation | 21.393 (7.719) | 21.486 (7.740) | 21.234 (7.680) |
| Female (1/0) | 0.020 (0.141) | 0.018 (0.134) | 0.024 (0.154) |
| Age | 47.132 (9.017) | 47.213 (9.025) | 46.992 (9.003) |
| Med school ranked top 5 (1/0) | 0.038 (0.191) | 0.040 (0.196) | 0.034 (0.182) |
| Med school ranked 6–10 (1/0) | 0.048 (0.214) | 0.052 (0.221) | 0.043 (0.202) |
| Med school ranked 11–29 (1/0) | 0.105 (0.307) | 0.110 (0.313) | 0.097 (0.296) |
| Med school ranked 30 plus (1/0) | 0.507 (0.500) | 0.502 (0.500) | 0.515 (0.500) |
| Foreign med school (1/0) | 0.302 (0.459) | 0.297 (0.457) | 0.311 (0.463) |
| Quarterly no. PCIs by cardiologist | 27.843 (23.201) | 28.379 (23.610) | 26.916 (22.447) |
| Hospital characteristics | |||
| Government‐owned hospital (1/0) | 0.082 (0.274) | 0.077 (0.267) | 0.090 (0.287) |
| Nonprofit hospital (1/0) | 0.787 (0.409) | 0.801 (0.400) | 0.764 (0.424) |
| Teaching hospital (1/0) | 0.276 (0.447) | 0.296 (0.457) | 0.241 (0.428) |
| System‐affiliated hospital (1/0) | 0.704 (0.457) | 0.712 (0.453) | 0.689 (0.463) |
| Cardiac intensive care hospital (1/0) | 0.797 (0.402) | 0.803 (0.398) | 0.786 (0.410) |
| Quarterly no. PCIs in hospital | 157.883 (116.631) | 164.132 (118.773) | 147.085 (112.015) |
Sample included 8,611 unique cardiologists and 4,110 cardiology unique practices. Values are expressed as mean (SD).
BMS, bare‐metal stent; DES, drug‐eluting stent.
Few cardiologists were female (2 percent), and average age of cardiologists was 47 years (SD 9). About 9 percent had an M.D. degree from a top 10 U.S. medical school, and 30 percent were trained in non‐U.S. institutions (foreign). On average, a cardiologist performed 27.8 (SD 23.2) PCIs with a stent per annual quarter. A larger fraction of PCIs with DESs (compared to PCI with BMS) were performed in nonprofit hospitals (80 percent vs. 76 percent) and in teaching hospitals (30 percent vs. 24 percent).
Tables S1 and S2 present descriptive statistics and parameter estimates from our patient choice models of cardiology practice and hospital, respectively. Patients had an average of seven cardiology practices and four hospitals in their choice set of 50 miles of their residence ZIP. Average practice share in a given patient ZIP was 26 percent, and on average 7 percent of patients in a given ZIP choose a practice outside the 50 mile radius from their residence (the outside good). Average hospital share in a given ZIP was 36 percent, and on average 9 percent chose a hospital outside of the choice set. A 1 mile increase in distance reduced the probability of choosing a practice and hospital by 0.04 (p < .001) and 0.05 (p < .001), respectively.
Table 2 presents a cross‐tabulation of predicted hospital‐ and practice‐level HHI. Competition was greater (as measured by predicted HHI) among cardiology practices when there was more competition in the hospital market. However, variations across the quartiles of the distributions were apparent. For example, among PCIs exposed to the first quartile of predicted practice HHI, 67.8 percent were exposed to first quartile of predicted hospital HHI, 23.9 percent were exposed to the second quartile, 6.6 percent to the third quartile, and 1.8 percent were exposed to the fourth quartile.
Table 2.
Cross‐Tabulation of Predicted Practice‐Level HHI () and Hospital‐Level HHI ()
| Mean (SD): 2,101 (1,001) | Mean (SD): 3,034 (1,113) | |||||
|---|---|---|---|---|---|---|
| % Quartile 1 (<2,144) | % Quartile 2 (2,144–2,857) | % Quartile 3 (2,859–3,694) | % Quartile 4 (>3,694) | % Total | N | |
| Quartile 1 (<1,353) | 67.74 | 23.90 | 6.61 | 1.75 | 100 | 156,588 |
| Quartile 2 (1,353–1,907) | 20.61 | 40.17 | 31.88 | 7.34 | 100 | 158,004 |
| Quartile 3 (1,908–2,626) | 8.86 | 25.87 | 33.67 | 31.59 | 100 | 158,615 |
| Quartile 4 (>2,626) | 2.24 | 9.92 | 27.77 | 60.07 | 100 | 157,995 |
| N | 156,232 | 157,604 | 158,020 | 159,346 | 631,202 | |
Table 3 presents the parameters (shown as marginal effects) from our model of DES use on patient, procedure, and provider characteristics. These estimates show that DES use was less likely for older patients, males, patients that live in nonmetropolitan areas, African American, and Hispanic patients (relative to non‐Hispanic whites). Patients who were admitted through the emergency room, admitted over the weekend, and patients with higher Charlson comorbidity index were less likely to receive DES. In addition, patients with at least one DES indication were less likely to receive DES.
Table 3.
Marginal Effects of Select Patient, Procedure, Cardiologist, and Hospital Characteristics on the Probability of DES Use, April 2003–December 2004
| Coef. | SE | |
|---|---|---|
| Patient and procedure characteristics | ||
| Female | 0.031*** | 0.001 |
| Age | −0.002*** | 0.0001 |
| White | Ref | |
| African American | −0.025*** | 0.003 |
| Asian | −0.006 | 0.007 |
| Hispanic | −0.018*** | 0.006 |
| Native American | −0.023** | 0.009 |
| Other race | 0.002 | 0.007 |
| Admitted through emergency room | −0.061*** | 0.002 |
| Inpatient procedure | 0.023*** | 0.006 |
| Weekend procedure | −0.055*** | 0.003 |
| Charlson Index | −0.008*** | 0.0004 |
| Any DES indication | −0.029*** | 0.002 |
| Resides in a metro area | 0.014*** | 0.002 |
| Post‐April 2004 | 0.331*** | 0.005 |
| Hospital characteristics | ||
| For‐profit hospital | Ref | |
| Government‐owned hospital | −0.018 | 0.013 |
| Nonprofit hospital | 0.012* | 0.007 |
| Teaching hospital | 0.031*** | 0.006 |
| System‐affiliated hospital | 0.008 | 0.006 |
| Cardiac intensive care hospital | 0.021*** | 0.007 |
| Has free‐standing outpatient center | −0.013** | 0.005 |
| Has hospital‐based outpatient center | 0.013 | 0.009 |
| ln(lag quarterly PCI in hospital) | 0.0002*** | 0.00003 |
| Adjusted 30‐day PCI mortality in 2002 | −0.414*** | 0.089 |
| Cardiologist characteristics | ||
| Years since medical school graduation | 0.001* | 0.001 |
| Female | −0.058*** | 0.012 |
| Age | −0.0005 | 0.001 |
| Med school ranked top 5 | Ref | |
| Med school ranked top 6–10 | 0.004 | 0.012 |
| Med school ranked 11–29 | 0.003 | 0.011 |
| Med school ranked 30 plus | −0.018* | 0.01 |
| Foreign medical school | −0.023** | 0.01 |
| ln(lag quarterly PCI by cardiologist) | 0.001*** | 0.0001 |
| Practice size | 0.00001 | 0.001 |
| Adjusted 30‐day PCI mortality in 2002 | 0.014 | 0.039 |
| Practices in a metro area | 0.041*** | 0.012 |
Significant at *p = 10%, **p = 5%, ***p = 1%.
Models include hospital and cardiologist characteristics as well as hospital referral region (HRR) fixed effects for the cardiologist's location. Also included are competition measures: quartiles of hospital and cardiologist HHIs, and their interactions with a post‐April 2004 indicator. Standard errors are clustered at the cardiologist level.
Patients treated in hospitals with larger PCI volume in the previous quarter were more likely to receive a DES. Poorer quality hospitals (as measured by adjusted PCI mortality in pre‐DES period [2002]) were less likely to use the DES. Cardiac intensive care hospitals and teaching hospitals were more likely to use the DES, supporting our hypothesis that some types of hospitals may have better information on the benefits of the DES or would have received greater reimbursement from payers when using the new technology.
Several cardiologist characteristics were related to DES use. Female cardiologists were less likely to use DES. Foreign‐trained cardiologists were less likely to use a DES compared to cardiologists trained in a top‐five U.S. medical school. Cardiologists practicing in metropolitan areas, and those with higher PCI volume were more likely to use a DES.
Table 4 presents the marginal effects of our predicted market structure measures on DES use over two distinct periods: the presteady‐state period (April 2003–March 2004) and the steady‐state period (April 2004–December 2004). Cardiologists whose practices faced higher quartiles of HHI were less likely to use a DES. Moving from the 1st to the 2nd quartile of practice HHI corresponded to a 0.024 reduction in the probability of DES use. Moving from the 1st to the 3rd quartile demonstrated a 0.047 reduction, and moving from the 1st to the 4th demonstrated a 0.059 reduction in the probability of DES use. These competitive effects attenuated once the market reached a steady state of use, suggesting that competition had its most pronounced effect immediately after DES introduction. At the hospital level, we did not find any competitive effects throughout the study period.
Table 4.
Marginal Effects of Market Structure on the Probability of DES Use, April 2003–December 2004
| April 2003–March 2004 | April 2004–December 2004 | |||
|---|---|---|---|---|
| Coef. | SE | Coef. | SE | |
| Hospital market structure () | ||||
| Quartile 1 | Ref | Ref | ||
| Quartile 2 | 0.005 | 0.009 | 0.015* | 0.008 |
| Quartile 3 | 0.008 | 0.012 | 0.0001 | 0.011 |
| Quartile 4 | 0.007 | 0.015 | 0.010 | 0.014 |
| Cardiology practice market structure () | ||||
| Quartile 1 | Ref | Ref | ||
| Quartile 2 | −0.024*** | 0.008 | −0.011 | 0.007 |
| Quartile 3 | −0.047*** | 0.010 | −0.018* | 0.009 |
| Quartile 4 | −0.059*** | 0.013 | −0.027** | 0.012 |
Significant at *p = 10%, **p = 5%, ***p = 1%.
Discussion
The DES diffused rapidly following its introduction in April 2003. Using the Medicare FFS population that received PCI with a cardiac stent over the period April 2003 through December 2004, we observed that substantial variation in use existed across cardiologists and hospitals. We found significant evidence that the structure of the cardiology practice market mattered. DESs diffused faster in markets where cardiology practices faced more competition. This finding supports the hypothesis that competitive pressure to maintain or expand PCI volume shares compelled cardiologists to adopt DESs more quickly.
Interpreting our practice‐level finding further, we noted that 47.8 percent of PCIs with a cardiac stent used a DES during the period April 2003 through March 2004. As Table 2 showed, the 25th percentile of the predicted practice‐level HHI distribution, (), was 1,353, while the 75th percentile was 2,626, a value almost double in size. Roughly, doubling practice HHI over the period April 2003–March 2004 would have reduced the probability of DES use by 0.059, or 5.9 percentage points. Taking the mean of DES use over the period (47.8 percent), a 5.9 percentage point increase (or decrease) would have corresponded to a 12.3 percent change in DES use, or 20,774 additional PCIs would have used DES in place of BMS. During the steady‐state period (April 2004 through December 2004), DES use was more ubiquitous, where 83 percent of PCIs with a cardiac stent used DES. Doubling practice‐level HHI in this period would have corresponded to a 2.7 percentage point increase, or a 3.3 percent change in DES use. For the Medicare FFS population, this implies that another 7,535 procedures would have received DES instead of BMS.
Conversely, we found no obvious evidence that the structure of the hospital market mattered. We conjectured that hospitals faced additional, conflicting influences that did not exist at the cardiologist level. Hospitals would have faced significant pressure to secure PCI volume through adoption, but they also faced the direct cost of purchasing DES. More competitive hospital markets may have had relatively smaller volume shares or demonstrated greater substitutability to payers, making them less influential over the cost of acquiring DES and over the prices paid for PCIs with stent technology. We found some evidence to support this added price‐cost influence at the hospital level such as greater DES use for urban patients and greater use in teaching hospitals, locations where adjustment factors would have increased the reimbursement for DESs. Moreover, we found evidence that DES use was more pervasive in higher volume hospitals, locations that may have realized favorable cost economies in acquiring and using DESs.
Our findings show that medical technology diffuses faster in more competitive geographies. Given the current landscape of greater strategic affiliations between physicians and hospitals, this study offers some cautionary evidence on what might be lost from greater consolidation in the physician marketplace. We find evidence that more competitive physician market structures can foster faster diffusion, increasing patient access to the latest medical technology.
Supporting information
Appendix SA1: Author Matrix.
Appendix SA2: (1) Identifying Drug‐Eluting Stents in Medicare Claims; and (2) Measuring Market Structure.
Table S1. Patient Choice of Cardiology Practice.
Table S2. Patient Choice of Hospital.
Acknowledgments
Joint Acknowledgment/Disclosure Statement: Pinar Karaca‐Mandic acknowledges funding from a career grant (5K01‐AG036740) from the National Institutes of Health, National Institute on Aging. Andrew Wilcock acknowledges funding from a T32 training grant from the AHRQ as well as a R36 Dissertation grant from AHRQ.
Disclosures: No other disclosures.
Disclaimers: None.
Notes
We use quarterly lagged values of PCI volume of the cardiologist in empirical models.
In practice, we first defined the set of all cardiologists within a 50 mile radius, their practices, and the cardiologist the patient chose. Using the tax‐identifier of these cardiologists, we were able to construct the choice sets of the cardiology practices as well as the practice the patient choose for each PCI.
References
- Avery, M. , Chan M., Klein S., and Leung Y.. 2004. “Cordis Corporation (a Johnson & Johnson Company).” Unpublished case study paper [accessed on November 24, 2014]. Available at http://www.mavery.com/academic/Cordis_Case_Study.pdf
- Baker, L. C. , and Wheeler S. K.. 1998. “Managed Care and Technology Diffusion: The Case of MRI.” Health Affairs 17 (5): 195–207. [DOI] [PubMed] [Google Scholar]
- Banta, H. D. 1980. “The Diffusion of the Computed Tomography (CT) Scanner in the United States.” International Journal of Health Services 10 (2): 251–69. [DOI] [PubMed] [Google Scholar]
- Berenson, R. A. , Bodenheimer T., and Pham H. H.. 2006. “Specialty‐Service Lines: Salvos in the New Medical Arms Race.” Health Affairs 25 (5): w337–43. [DOI] [PubMed] [Google Scholar]
- Berry, S. T. 1994. “Estimating Discrete‐Choice Models of Product Differentiation.” The RAND Journal of Economics 25 (2): 242–62. [Google Scholar]
- Bloom, B. S. , Hillman A., and Schwartz J. S.. 1991. “Abruptly Changing Patterns of Diffusion and Use of Extra‐ Corporeal Shock‐Wave Renal Lithotripsy.” American Journal of Kidney Diseases 18 (1): 103–7. [DOI] [PubMed] [Google Scholar]
- Chandra, A. , Malenka D., and Skinner J.. 2014. The Diffusion of New Medical Technology: The Case of Drug‐Eluting Stents, Chapter in NBER book Discoveries in the Economics of Aging. Chicago, IL: University of Chicago Press. [Google Scholar]
- Chandra, A. , and Skinner J.. 2009. “Technology and Expenditure Growth in Health Care.” Tech. rep., Harvard University working paper. Cambridge, MA: Harvard Kennedy School. [Google Scholar]
- Chandra, A. , and Staiger D. O.. 2007. “Productivity Spillovers in Healthcare: Evidence from the Treatment of Heart Attacks.” The Journal of Political Economy 115: 103. [DOI] [PMC free article] [PubMed] [Google Scholar]
- Coleman, J. S. , Katz E., and Menzel H. 1966. Medical Innovation: A Diffusion Study. New York: Bobbs‐Merrill Company. [Google Scholar]
- Cutler, D. M. , and McClellan M.. 2001. “Is Technological Change in Medicine Worth It?” Health Affairs 20 (5): 11–29. [DOI] [PubMed] [Google Scholar]
- Devers, K. J. , Brewster L. R., and Casalino L. P.. 2003. “Changes in Hospital Competitive Strategy: A New Medical Arms Race?” Health Services Research 38 (1p2): 447–69. [DOI] [PMC free article] [PubMed] [Google Scholar]
- Fendrick, A. M. , Escarce J. J., McLane C., Shea J. A., and Schwartz J. S.. 1994. “Hospital Adoption of Laparo‐ Scopic Cholecystectomy.” Medical Care 32 (10): 1058–63. [DOI] [PubMed] [Google Scholar]
- Forte, M. L. , Virnig B. A., Kane R. L., Durham S., Bhandari M., Feldman R., and Swiontkowski M. F.. 2008. “Geographic Variation in Device Use for Intertrochanteric Hip Fractures.” The Journal of Bone and Joint Surgery 90 (4): 691–9. [DOI] [PubMed] [Google Scholar]
- Freiman, M. P. 1985. “The Rate of Adoption of New Procedures among Physicians: The Impact of Specialty and Practice Characteristics.” Medical Care 23 (8): 939–45. [DOI] [PubMed] [Google Scholar]
- Fudenberg, D. , and Tirole J.. 1985. “Preemption and Rent Equalization in the Adoption of New Technology.” The Review of Economic Studies 52 (3): 383–401. [Google Scholar]
- Gowrisankaran, G. , and Town R. J.. 2003. “Competition, Payers, and Hospital Quality1.” Health Services Research 38 (6p1): 1403–22. [DOI] [PMC free article] [PubMed] [Google Scholar]
- Groeneveld, P. W. , Matta M. A., Greenhut A. P., and Yang F.. 2008a. “The Costs of Drug‐Eluting Coronary Stents among Medicare Beneficiaries.” American Heart Journal 155 (6): 1097–105. [DOI] [PubMed] [Google Scholar]
- Groeneveld, P. W. . Matta M. A., Greenhut A. P., and Yang F.. 2008b. “Drug‐Eluting Compared with Bare‐Metal Coronary Stents among Elderly Patients.” Journal of the American College of Cardiology 51 (21): 2017–24. [DOI] [PubMed] [Google Scholar]
- Hillman, A. L. , and Schwartz J. S.. 1985. “The Adoption and Diffusion of CT and MRI in the United States: A Comparative Analysis.” Medical Care 23 (11): 1283–94. [DOI] [PubMed] [Google Scholar]
- Hillman, B. J. , Winkler J. D., Phelps C. E., Aroesty J., and Williams A. P.. 1984. “Adoption and Diffusion of a New Imaging Technology: A Magnetic Resonance Imaging Prospective.” American Journal of Roentgenology 143 (4): 913–7. [DOI] [PubMed] [Google Scholar]
- Hodgson, J. M. , Bottner R. K., Klein L. W., Walpole H. T., Cohen D. J., Cutlip D. E., Clark M. A., et al. 2004. “Drug‐Eluting Stent Task Force: Final Report and Recommendations of the Working Committees on Cost‐Effectiveness/Economics, Access to Care, and Medicolegal Issues.” Catheterization and Cardiovascular Interventions 62 (1): 1–17. [DOI] [PubMed] [Google Scholar]
- Hollingsworth, J. M. , Krein S. L., Dunn R. L., Wolf J. S. Jr, and Hollenbeck B. K.. 2008. “Understanding Variation in the Adoption of a New Technology in Surgery.” Medical Care 46 (4): 366–71. [DOI] [PubMed] [Google Scholar]
- Kessler, D. P. , and McClellan M. B.. 2000. “Is Hospital Competition Socially Wasteful?” The Quarterly Journal of Economics 115 (2): 577–615. [Google Scholar]
- Levin, S. G. , Levin S. L., and Meisel J. B.. 1987. “A Dynamic Analysis of the Adoption of a New Technology: The Case of Optical Scanners.” The Review of Economics and Statistics 69 (1): 12–17. [Google Scholar]
- Malenka, D. J. , Kaplan A. V., Lucas F. L., Sharp S. M., and Skinner J. S.. 2008. “Outcomes Following Coronary Stenting in the Era of Bare‐Metal vs the Era of Drug‐Eluting Stents.” Journal of the American Medical Association 299 (24): 2868–76. [DOI] [PMC free article] [PubMed] [Google Scholar]
- Newhouse, J. P. 1992. “Medical Care Costs: How Much Welfare Loss?” The Journal of Economic Perspectives 6 (3): 3–21. [DOI] [PubMed] [Google Scholar]
- Rao, S. V. , Shaw R. E., Brindis R. G., Klein L. W., Weintraub W. S., Krone R. J., and Peterson E. D.. 2006. “Patterns and Outcomes of Drug‐Eluting Coronary Stent Use in Clinical Practice.” American Heart Journal 152 (2): 321–6. [DOI] [PubMed] [Google Scholar]
- Reinganum, J. F. 1981. “Market Structure and the Diffusion of New Technology.” The Bell Journal of Economics 12 (2): 618–24. [Google Scholar]
- Seim, K. , and Vaiard V. B.. 2011. “The Effect of Market Structure on Cellular Technology Adoption and Pricing.” American Economic Journal: Microeconomics 3 (2): 221–51. [Google Scholar]
- Shih, C. , and Berliner E.. 2008. “Diffusion of New Technology and Payment Policies: Coronary Stents.” Health Affairs 27 (6): 1566–76. [DOI] [PubMed] [Google Scholar]
- Skinner, J. , and Staiger D.. 2009. “Technology Diffusion and Productivity Growth in Health Care.” Tech. rep., National Bureau of Economic Research. [DOI] [PMC free article] [PubMed]
- Smith, S. , Newhouse J. P., and Freeland M. S.. 2009. “Income, Insurance, and Technology: Why Does Health Spending Outpace Economic Growth?” Health Affairs 28 (5): 1276–84. [DOI] [PubMed] [Google Scholar]
- Steinberg, E. P. , Sisk J. E., and Locke K. E.. 1985a. “The Diffusion of Magnetic Resonance Imagers in the United States and Worldwide.” International Journal of Technology Assessment in Health Care 1 (03): 499–514. [DOI] [PubMed] [Google Scholar]
- Steinberg, E. P. Sisk J. E., and Locke K. E.. 1985b. “X‐ray CT and Magnetic Resonance Imagers. Diffusion Patterns and Policy Issues.” New England Journal of Medicine 313 (14): 859. [DOI] [PubMed] [Google Scholar]
- Wilensky, G. R. , Wolter N., and Fischer M. M.. 2007. “Gain Sharing: A Good Concept Getting a Bad Name?” Health Affairs 26 (1): w58–67. [DOI] [PubMed] [Google Scholar]
Associated Data
This section collects any data citations, data availability statements, or supplementary materials included in this article.
Supplementary Materials
Appendix SA1: Author Matrix.
Appendix SA2: (1) Identifying Drug‐Eluting Stents in Medicare Claims; and (2) Measuring Market Structure.
Table S1. Patient Choice of Cardiology Practice.
Table S2. Patient Choice of Hospital.