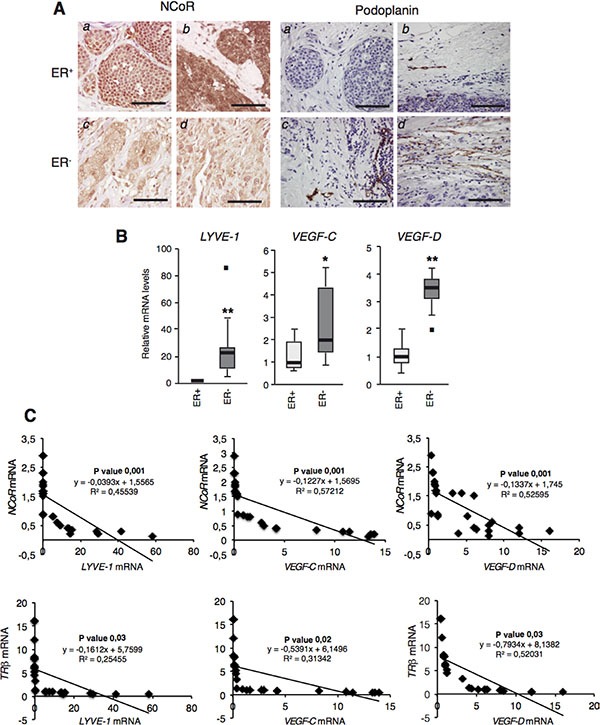
Figure 6. NCoR and TRβ levels correlate negatively with lymphangiogenic gene expresion in human breast tumors.

(A) NCoR (left panels) and Podoplanin (right panels) immunohistochemistry of representative ER+ and ER− tumors. a: ER+ lobular tumor, b ER+ ductal tumor; c and d : ER− ductal tumors. Bars: 100 μM. (B) Whisker plot of LYVE-1, VEGF-C and VEGF-D mRNA levels in ER+ and ER− tumors. Data are mean ± S.E of 12 and 14 tumors, respectively. Outliers are shown by a black square. Significance of t-test between ER positive and negative tumors are indicated as * P < 0.05, **P < 0.01. (C) NCoR mRNA levels measured in Ref. were plotted against the corresponding LYVE-1, VEGF-C and VEGF-D mRNAs obtained in each sample. The p value and linear regression coefficient obtained are shown. (D) results with individual TRβ mRNAs obtained in Ref. 31, plotted against mRNAs of the lymphangiogenic genes.
