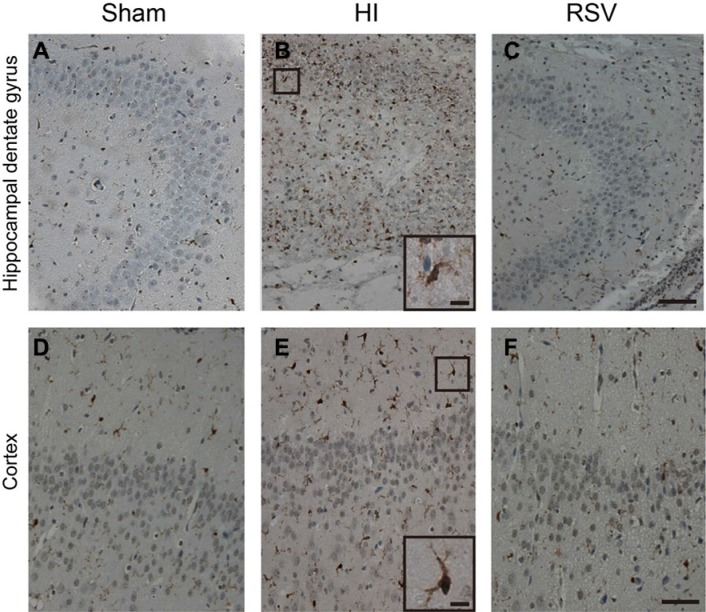
Figure 7. Iba-1 immunohistochemistry.
Representative examples of photomicrographs from 7 day after hypoxic-ischemia in the hippocampal dentate gyrus (B) and cortex (E). Note that the Iba-1 immunoreactive signals were significantly increased in the HI (B, E) group compared to the Sham (A, D), but decreased after post-treatment with RSV (C, F). Insets: Higher magnification of Iba-1 positive cells from dentate gyrus and cortex in the HI group. Scale = 100 μm (A–F) and 25 μm (insets).

