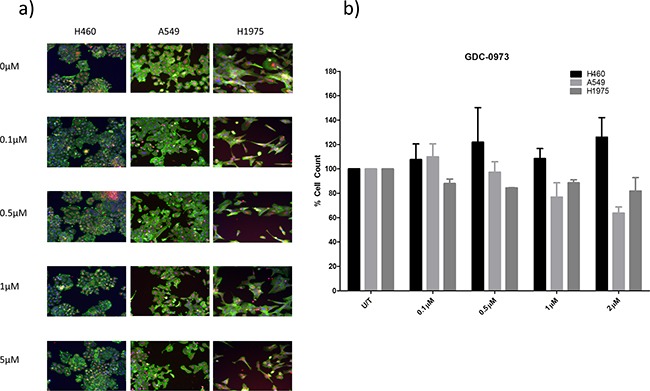
Figure 6. The effect of GDC-0973 treatment on viability in a panel of NSCLC cells.

H460, A549, and H1975 cells were treated at noted concentrations of GDC-0973 for 48 hours in a 96 well plate and then fixed & stained with Höechst nuclear stain, mitotracker red mitochondrial stain and phalloidin green F-actin stain. A. Stained plates were imaged using the InCell 1000 (10X objective, 10 fields per well, triplicate wells, n=3). B. Images were analysed for cell count using InCell 1000 software. Cell numbers from each treatment group were compared with untreated cell numbers and are represented here as % cell count compared to untreated cells, with mean ± SEM for treated groups.
