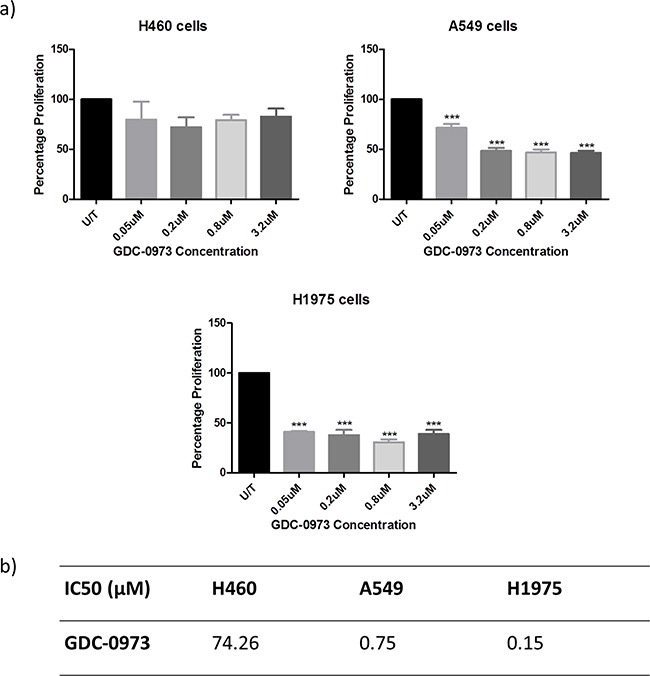
Figure 7. Anti-proliferative effects of GDC-0973 in a panel of NSCLC cell lines.

Cells were treated at noted concentrations of GDC-0973 for 72 hours, then proliferation rates were examined by BrdU incorporation ELISA (triplicate wells, n=3). A. Raw absorbance values for each treatment group were compared with untreated sample values, which were set to 100%. Data was then expressed as % proliferation compared to untreated cells, with mean ± SEM. B. Data from a) was analysed by linear regression and IC50 values were determined using GraphPad Prism.
