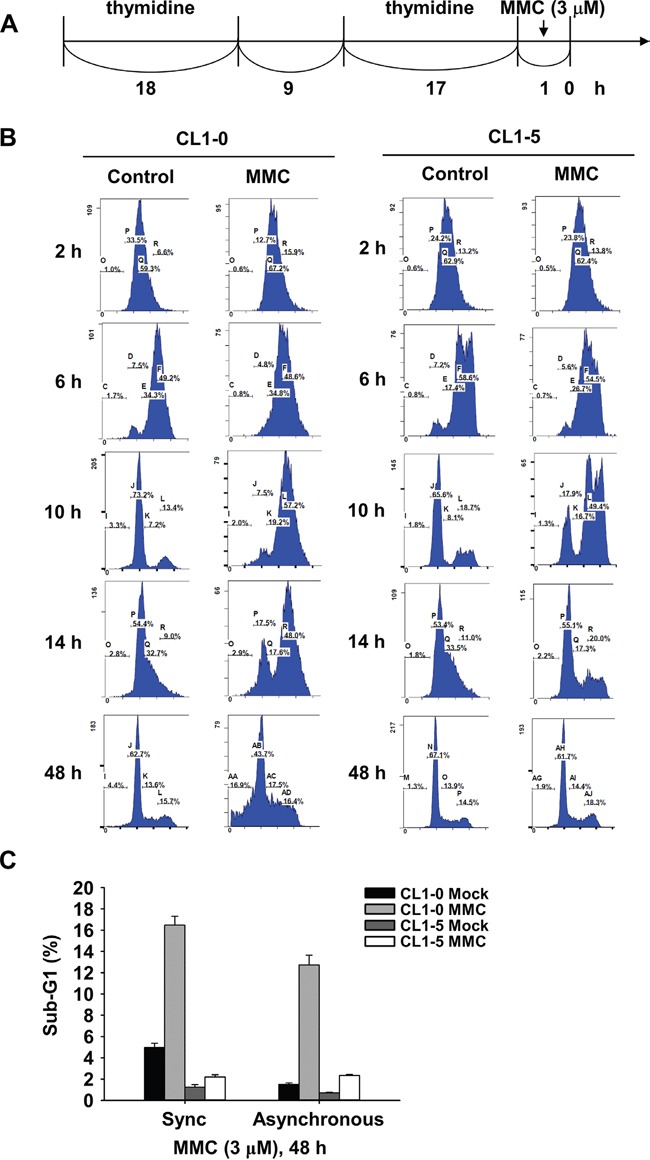
Figure 2. Cell cycle distribution of synchronized CL1-0 and CL1-5 cells post 3 μM MMC treatment.

A. Time scale of double thymidine block and MMC treatment. B. Cell cycle distribution of CL1-0 and CL1-5 cells at the indicated time points post MMC (3 μM) treatment in synchronized cells. C. Sub-G1 analysis following 1 h treatment with 3 μM MMC in synchronous or asynchronous CL1-0 and CL1-5 cells (n = 3).
