

Abstract
Aims
Opioids and antidepressants that inhibit serotonin and norepinephrine reuptake (SNRI) are recognized as analgesics to treat severe and moderate pain, but their mechanisms of action in humans remain unclear. The present study aimed to explore how oxycodone (an opioid) and venlafaxine (an SNRI) modulate spinal and supraspinal sensory processing.
Methods
Twenty volunteers were included in a randomized, double‐blinded, three‐way (placebo, oxycodone, venlafaxine), crossover study. Spinal and full scalp cortical evoked potentials (EPs) to median nerve stimulation were recorded before and after 5 days of treatment. Assessment of the central effects of the three treatments involved: (i) amplitudes and latencies of spinal EPs (spinal level); (ii) amplitudes and latencies of the P14 potential (subcortical level); (iii) amplitudes and latencies of early and late cortical EPs (cortical level); (iv) brain sources underlying early cortical Eps; and (v) brain networks underlying the late cortical EPs.
Results
In the venlafaxine arm, the spinal P11 and the late cortical N60–80 latencies were reduced by 1.8% [95% confidence interval (CI) 1.7%, 1.9%) and 5.7% (95% CI 5.3%, 6.1%), whereas the early cortical P25 amplitude was decreased by 7.1% (95%CI 6.1%, 8.7%). Oxycodone increased the subcortical P14 [+25% (95% CI 22.2%, 28.6%)], early cortical N30 [+12.9% (95% CI 12.5%, 13.2%)] amplitudes and the late cortical N60–80 latency [+2.9% (95% CI 1.9%, 4.0%)]. The brainstem and primary somatosensory cortex source strengths were increased by 66.7% (95% CI 62.5%, 75.0%) and 28.8% (95% CI 27.5%, 29.6%) in the oxycodone arm, whereas the primary somatosensory cortex strength was decreased in the venlafaxine arm by 18.3% (95% CI 12.0%, 28.1%).
Conclusions
Opioids and SNRI drugs exert different central effects. The present study contributed to the much‐needed human models of the mechanisms of action of drugs with effects on the central nervous system.
Keywords: evoked potential, opioid, SNRI, source localization
What is Already Known about this Subject
Opioids and antidepressant drugs with an effect on serotonin and norepinephrine reuptake inhibition (SNRI) are used in chronic pain but their mechanisms in humans remain unclear.
Central changes in the brain due to opioid analgesia have been observed before.
The antinociceptive effects of SNRI drugs have previously been demonstrated in animal models.
What this Study Adds
Venlafaxine induced changes at the spinal and cortical levels, whereas oxycodone induced changes at the brainstem and cortical levels.
The cortical modifications were different between venlafaxine and oxycodone.
The study contributes to the much‐needed human models of the mechanisms of action of drugs with effects on the central nervous system.
Tables of Links
| TARGETS |
|---|
| G protein‐coupled receptors 2 |
| Opioid receptors |
| Transporters 3 |
| Sodium‐dependent serotonin transporter |
| Sodium‐dependent noradrenaline transporter |
| LIGANDS |
|---|
| Oxycodone |
| Venlafaxine |
These Tables list key protein targets and ligands in this article that are hyperlinked to corresponding entries in http://www.guidetopharmacology.org, the common portal for data from the IUPHAR/BPS Guide to PHARMACOLOGY 1, and are permanently archived in the Concise Guide to PHARMACOLOGY 2015/16 2, 3.
Introduction
Pain is one of the most common symptoms of many diseases, and chronic pain is present in approximately one in five adults in the Western world. As a consequence of chronic pain, sufferers have a decreased quality of life and a number of socioeconomic issues. In spite of the prevalence of chronic pain and its consequences, its treatment is far from optimal. Severe pain is often treated with opioids, but antidepressant drugs with an effect on serotonin and norepinephrine reuptake inhibition (SNRI) are also used in chronic pain; however, the specific mode of action of these drugs in humans remains unclear. Previous studies have demonstrated opioid analgesia‐induced central changes in the brain, involving the medial thalamus, anterior cingulate cortex and insula 4, 5, 6, 7. The antinociceptive effect of SNRI drugs such as venlafaxine has been demonstrated in animal models of neuropathic pain 8, 9. However, direct demonstrations of the mechanism of action of venlafaxine in the treatment of human pain are lacking, and it is likely that the mechanisms underlying its analgesic effects differ from those responsible for its antidepressant effect 10. It also remains debatable whether this antinociceptive effect is opioid dependent. Nevertheless, serotoninergic and noradrenergic pain modulatory systems have been shown to interact at the level of the spinal cord to produce a powerful antinociceptive effect 11.
Somatosensory evoked potentials (SEPs) are a reliable method for following upstream activity from the periphery to the spinal cord, to the brainstem and finally to the cortex. Although SEPs explore the function of the large myelinated fibre pathway, which is not specifically related to nociception, this technique can provide information on a drug's effect on the central nervous system (CNS), and the level of the CNS at which the effects occur. This information can be crucial to understanding where and when within the CNS analgesics exert their action. SEPs have previously been used in opioid studies but they were mainly focused on the early evoked spinal and cortical potentials (i.e. up to 50 ms) and these studies have produced contradictory findings 12. While the early SEPs give information on spinal processing and the primary somatosensory (SI) area activity, in drug studies it is important also to investigate the later components. These later components may carry important information on a drug's effect on the brain regions where the somatosensory input is processed after its arrival in the SI area. Moreover, in addition to comparing the opioid with placebo, it would be valuable to compare it with another analgesic drug (i.e. an SNRI), to observe whether the mechanisms of action differ and whether any observed changes are due to general effects, such as sedation.
In the current randomized, double‐blind, three‐way, placebo‐controlled, crossover trial involving venlafaxine and oxycodone (a strong opioid), We recorded SEPs at Erb's point, the C7 spinous process (Cv7) and scalp cortical evoked potentials (EPs) following stimulation at the median nerve which elicited clear twitching of the thumb (i.e. the first visual occurrence of the thumb twitch/motor threshold). We hypothesized that venlafaxine (an SNRI) would induce larger changes in spinal activity than oxycodone (an opioid), and that oxycodone would affect the supraspinal and cortical processing to a greater extent than venlafaxine. Therefore, the primary objective of the present study was to investigate central changes at the spinal and supraspinal levels due to oxycodone and venlafaxine via spinal and cortical EPs. In order to test our hypothesis, the aims of the study were to compare differences from baseline due to placebo, venlafaxine and oxycodone in healthy subjects in: (i) amplitudes and latencies of peripheral, spinal and cortical SEPs; and (ii) brain sources underlying the cortical SEPs.
Methods
The trial was registered with the European Clinical Trials Database (Eudra‐CT 2013‐000170‐30, registration date: 2013–03‐04), and conducted according to the Declaration of Helsinki. The local ethics committee (N‐20130011) and the Danish Medicines Agency (201300017030) approved the study. The study was conducted in the laboratories at Mech‐Sense, the Department of Gastroenterology and Hepatology, Aalborg University Hospital, according to the rules of Good Clinical Practice and monitored by the Good Clinical Practice unit, Aalborg and Aarhus University Hospitals, Denmark. The study volunteers took each drug over a 5‐day period. Side effects (nausea, vomiting, headache, dizziness, sedation, dryness of the mouth, rapid heart rate, constipation, itching, low appetite, increased sweating, general discomfort) were recorded on a five‐point Likert scale (i.e. 0 = no side effects, 1 = minimal side effects, 2 = moderate side effects, 3 = severe side effects and 4 = very severe side effects) each day. Sensory and neurophysiological assessments were performed on days 1 and 5 for each treatment arm. The timeline of the experiment for each experimental arm is presented in Figure 1.
Figure 1.
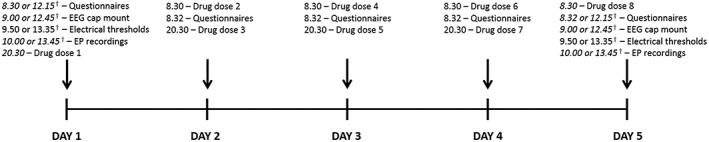
The timeline of the experiment for each of the arms. †Some volunteers had a morning experiment and some had an afternoon experiment. However, for each of the experimental arms, each volunteer came in at the same time on days 1 and 5. EEG, electroencephalogram; EP, evoked potential
Study volunteers
Twenty volunteers (all male, mean age 24.6 ± 2.5 years) participated in the study. Before inclusion, a physician conducted a routine health screening for each participant, ruling out any pain‐related conditions and history of abuse (participant and closest family). Moreover, before enrolment, the volunteers gave written informed consent, acknowledging that they understood all methods and procedures used in the experiment and that they were free to withdraw from the experiment at any time. Inclusion criteria for the study were that participants: (i) had a normal medical examination; (ii) were aged between 20 and 35 years; (iii) were male; (iv) were able to read and understand Danish; and (v) were of Scandinavian origin.
Drug and placebo administration
This was a randomized, double‐blind, three‐way crossover study, with minimum ‘wash‐out’ intervals of 1 week. Oxycodone and venlafaxine were formulated as orally administered tablets, similar to each other and to placebo. For oxycodone, the dosage was 10 mg extended release, and for venlafaxine 37.5 mg extended release. All drugs followed the same administration pattern: on days 1 and 5 once daily, and on days 2–4 twice daily, with a total of eight doses. The tablets were produced by the Hospital Pharmacy, Central Denmark Region, Denmark, which also performed the randomization of the study. The randomization list was generated using www.randomization.com by staff at the Hospital Pharmacy, where all subjects were randomized into four blocks to receive placebo, oxycodone and venlafaxine in periods 1, 2 and 3. Mirror randomization was employed in cases of participant drop‐out. The staff at the Hospital Pharmacy packed and labelled the medication, to ensure that all participants received the correct medication for the specific periods. Thus, the experimenters and the participants were fully blinded to the randomization.
Electrical stimulation
Electrical stimulation of the median nerve at the right wrist was applied through surface electrodes (15 mm × 15 mm, Neuroline 700, Ambu A/S, Ballerup, Denmark) to evoke the spinal and cortical somatosensory EPs. The stimulating electrode was placed medial to the palmaris longus tendon, just above the right wrist. The ground electrode was placed 3 cm above the stimulating electrode. The stimulus was delivered by a computer‐controlled electrical stimulator (Noxitest IES 230, Aalborg, Denmark). Custom‐made LabVIEW software (Center for Sensory‐Motor Interaction, Aalborg University, Denmark) was used to control the electrical stimulation. For each of the experimental days, the sensory threshold and thumb‐twitching threshold were found by slowly increasing the stimulus intensity in 1 mA steps. The sensory threshold was detected as the stimulation intensity at which the subjects first felt the stimulus. Subsequently, once a clear twitching of the thumb was detected, two sets of 1000 stimuli at 1 mA above the thumb‐twitching threshold were applied, with a 2‐min rest between sets. The stimulation frequency was 2.3 Hz and the duration of each stimulation was 0.2 ms.
Peripheral and EP recordings
Peripheral and spinal recordings
The peripheral and spinal activity was recorded through Ag/AgCl surface electrodes (Neuroline 710, Ambu A/S). Recording electrodes were placed on the ipsilateral Erb's point, referred to the contralateral Erb's point, and over the C7 spinous process (Cv7) referred to an electrode on the anterior neck. In order to establish good contact between skin and electrodes, the skin was lightly scratched with sand paper, to remove dead skin cells. We ensured that the electrode impedance was <2 kΩ. The spinal EPs were recorded in continuous mode at 20 kHz (SynAmp, Neuroscan, El Paso, TX, USA) and stored offline for further analysis.
Cortical recordings
A 61‐channel prewired cylindrical Ag/AgCl surface electrode EEG cap (MEQNordic A/S, Jyllinge, Denmark) was used for cortical EPs. The reference electrode was between AFz and Fz. Electrode gel was applied to reduce the electrode impedance below 10 kΩ. The impedance was monitored in the Neuroscan software (v 4.3.1, Neuroscan). The cortical EP signals were recorded in continuous mode with open online filters and a sampling rate of 10 kHz (SynAmp, Neuroscan). The recordings were stored offline for further analysis.
Experimental procedure
On day 1, the experiment was conducted before drug administration (baseline recording), and on day 5 it was conducted after the volunteer had taken the last dose of the medication. The volunteers were seated comfortably, in a supine position, with their eyes open during the entire recording. They were instructed to focus on a fixed point on the wall and to try to minimize eye movement.
Data analysis
EP analysis
The EPs from each session were analysed offline. Both the spinal and cortical EP data were pre‐processed using Neuroscan (v 4.3.1, Neuroscan) software. The Erb's point and spinal EP data were processed as follows: (i) bandpass filtered between 30 Hz and 1000 Hz by applying a zero‐phase shift filter with a slope of 24 dB/octave; (ii) epoched from 10 ms before the stimulus to 70 ms; (iii) averaged; and (iv) the two sets of data were combined by taking the average of the two sets. The cortical EP data were pre‐processed as follows: (i) bandpass filtered between 1 Hz and 1000 Hz by applying a zero‐phase shift filter with a slope of 24 dB/octave; (ii) epoched from 50 ms before the stimulus to 150 ms after; (iii) averaged; (iv) the two sets of EP data were combined by taking the average of the two sets; and (v) the combined average was re‐referenced to the ipsilateral temporal electrode (TP8).
Latencies and peak‐to‐peak amplitudes were assessed visually for the following peaks: P9 (Erb's point), N10 (Erb's point), P11 (spinal Cv7), N13 (spinal Cv7), P14 (cortical Oz), N18 (cortical Oz), N20 (cortical CP5), P25 (cortical CP5), N30 (cortical F3), P45 (cortical F3), N60–80 (cortical C1), and P100–120 (cortical C1). Each of the electrodes used for the analysis was chosen because the amplitude of that particular peak is generally maximal at that scalp location (electrode). The F3 electrode was analysed with the TP8 reference because this maximizes the N30 potential. The original reference that was located between AFz and Fz was very close to the F3 electrode, which caused the peak to be very small. The rest of the cortical data were analysed with the original reference (between AFz and Fz).
The three baseline recordings were compared, in order to validate their reliability before the results of the drugs effect on the CNS could be interpreted with confidence. The details of reliability measures are explained below.
Brain source analysis
Brain source analysis was carried out on the 61‐channel cortical recording, in order to study the brain activity underlying the EPs. Source analysis of the early potentials (14–50 ms) was performed using brain electrical source analysis (BESA) (BESA research 5.3, MEGIS software GmbH, Gräfelfing, Germany) in a peak‐by‐peak fashion until a residual variance below 10% was reached. As the brainstem generator of the P14 peak is located deep in the brain and cannot be reliably detected by brain source localization algorithms, we locked the brainstem source in place, while the cortical sources were allowed to move freely. As the later potentials (50–150 ms) are more complex and have more dominant generators, the signal decomposition method was used to separate the different brain generators. This type of analysis has been described in detail elsewhere 13 but, briefly, involved the decomposition of EP data, using multichannel matching pursuit (MMP), into components well defined in time and frequency 14. Similar MMP components in time and frequency for each subject (six datasets, three baselines and three treatments) were then clustered together by an in‐house‐developed clustering method 15. MMP decomposition and clustering were done in MATLAB (version 8.4.0, The Mathworks Inc., Natick, MA, USA). The clusters that were similar between subjects were then identified visually and used for the final analysis. Brain source localization was then applied to the MMP components. As MMP components are mono‐frequency and have single topographies, each component is generated either by a single source or a set of sources that operate synchronously. In order to obtain an estimate of the number and locations of activated brain sources for each MMP component, the source models were guided by low‐resolution brain electromagnetic tomography (LORETA) 16. Inverse modelling was performed in BESA, as for the early potentials.
For both early and late brain sources, the source strength was calculated as the area under the curve (AUC) of the source waveforms.
Statistical analysis
Descriptive statistics are reported as mean ± standard deviation if not otherwise noted. To assess whether the three baseline recordings were reliable, intra‐class correlation coefficients (ICCs) and limits of agreement were calculated for Erb's potential, spinal EPs and cortical EPs. The ICC was calculated using a two‐way random model 17. Bootstrapping was used to calculate 95% confidence intervals for ICCs, based on 1000 bootstrap samples. The limits of agreement were calculated as the 95% random error component of the data, and are reported as bias ± random error 18. The reliability measures were calculated in MATLAB (version 8.4.0, The Mathworks Inc.).
To compare the data from the three treatments with their baselines, analyses were carried out using two‐way repeated measures analysis of variance, with time point (day 1 and day 2) and treatment as the two factors, and the interaction between these two factors was assessed, to study: (i) the latencies and amplitudes of Erb's potential, and spinal and cortical Eps; (ii) source locations; and (iii) source strengths. If a significant interaction was seen, all pairwise multiple comparison procedures (Holm–Sidak method) were carried out in order to elucidate which treatment gave rise to the between‐day differences. The data were checked for equal variance and normality before running the statistical tests. P ≤ 0.05 was considered as having exploratory significance. The software package Sigma Stat v.3.0 (SPSS Inc., Chicago, IL, USA) was used for the statistical analysis.
Results
Spinal and cortical EPs were recorded successfully in all the volunteers. The electrical stimulations were well tolerated and all subjects completed the study without any complications.
Sensory data
The sensory data are presented in Table 1. There were no differences in sensory or thumb‐twitching threshold data (all P > 0.05).
Table 1.
Sensory data
| PLACEBO | OXYCODONE | VENLAFAXINE | ||||
|---|---|---|---|---|---|---|
| Sensory (95% CI) | Motor (95% CI) | Sensory (95% CI) | Motor (95% CI) | Sensory (95% CI) | Motor (95% CI) | |
| Baseline (mA) | 2.6 ± 0.7 (2.3–2.9) | 8.8 ± 2.6 (7.7–9.9) | 2.6 ± 0.6 (2.3–2.9) | 8.2 ± 2.4 (7.1–9.3) | 2.6 ± 0.6 (2.3–2.9) | 9.4 ± 2.4 (8.3–10.5) |
| Treatment (mA) | 2.7 ± 0.6 (2.4–3.0) | 8.8 ± 2.5 (7.7–9.9) | 2.5 ± 0.6 (2.2–2.8) | 9.0 ± 2.8 (7.8–10.2) | 2.6 ± 0.5 (2.4–2.8) | 8.1 ± 2.0 (7.2–9.0) |
| Effect size | 0.15 | 0.0 | 0.17 | 0.31 | 0.0 | 0.59 |
CI, confidence interval
Reliability of baseline Erb's potential, and spinal and cortical EP data
The reliability of baseline data is shown in Table 2. The latencies of the peaks were reliable for all three recordings. Amplitudes were also reliable, although the between‐day variation was higher than for the latencies.
Table 2.
Reliability of the baseline Erb's point, and spinal and cortical evoked potential recordings. Intra‐class correlation coefficients (ICCs) are reported with 95% confidence intervals, computed from 1000 bootstrap samples. The limits of agreement are reported as bias ± 95% random error component
| ICC | Limits of agreement | |||
|---|---|---|---|---|
| Latency | Amplitude | Latency (ms) | Amplitude (μV) | |
| P9 | 0.9 [0.9–1.0] | 0.9 [0.9–1.0] | 0.0 ± 0.0 | 0.0 ± 0.1 |
| N10 | 0.9 [0.9–1.0] | 0.9 [0.8–0.9] | 0.0 ± 0.0 | 0.0 ± 0.3 |
| P11 | 0.9 [0.9–1.0] | 0.7 [0.6–0.8] | 0.0 ± 0.0 | 0.0 ± 0.1 |
| N13 | 0.9 [0.9–1.0] | 0.7 [0.6–0.8] | 0.0 ± 0.0 | 0.0 ± 0.1 |
| P14 | 0.7 [0.5–0.8] | 0.5 [0.0–0.8] | 0.0 ± 0.1 | 0.0 ± 0.0 |
| N18 | 0.8 [0.7–0.9] | 0.6 [0.3–0.7] | 0.0 ± 0.1 | 0.0 ± 0.0 |
| N20 | 0.9 [0.7–0.9] | 0.9 [0.9–1.0] | 0.0 ± 0.1 | 0.0 ± 0.1 |
| P25 | 0.9 [0.8–1.0] | 1.0 [0.9–1.0] | 0.0 ± 0.2 | 0.0 ± 0.1 |
| N30 | 0.8 [0.5–0.9] | 0.9 [0.8–0.9] | 0.0 ± 0.3 | 0.0 ± 0.1 |
| P45 | 0.6 [0.2–0.8] | 0.8 [0.7–0.9] | 0.0 ± 0.4 | 0.0 ± 0.2 |
| N60–80 | 0.9 [0.9–1.0] | 0.8 [0.4–0.9] | 0.0 ± 0.6 | 0.0 ± 0.2 |
| P100–120 | 0.8 [0.6–0.9] | 0.9 [0.8–0.9] | 0.0 ± 1.4 | 0.0 ± 0.2 |
Drug effects on spinal EPs
The Erb's point and spinal Cv7 EP results are shown in Table 3 and Figure 2A,B. The raw values of the amplitudes and latencies of spinal EPs are presented in Table S1. The drug effects on the P9 (P < 0.01; F 2,38 = 4.4), N10 (P < 0.05; F 2,38 = 3.2) and P11 (P < 0.01; F 2,38 = 4.2) latencies were significant. The post‐hoc tests showed that venlafaxine reduced these latencies (all P < 0.05), whereas there were no differences in the placebo or oxycodone experimental arms. There were no differences in the N13 latency (P > 0.05; F 2,38 = 0.03). Amplitudes were not changed with either treatment (all P > 0.05; all F 2,38 < 1.8).
Table 3.
Changes in latencies and amplitudes for Erb's point and spinal evoked potentials due to the treatment
| PLACEBO | OXYCODONE | VENLAFAXINE* | ||||||
|---|---|---|---|---|---|---|---|---|
| Change from baseline | ES | Change from baseline | ES | Comparison with placebo (95% CI) | Change from baseline | ES | Comparison with placebo (95% CI) | |
| P9 latency (ms) | 0.0 ± 0.2 | 0.00 | 0.0 ± 0.2 | 0.00 | 0.0 ± 0.1 | –0.6 ± 2.0 | 0.43 | –0.6 ± 0.9* |
| N10 latency (ms) | 0.0 ± 0.2 | 0.00 | 0.0 ± 0.2 | 0.00 | 0.0 ± 0.1 | –0.2 ± 0.2 | 0.44 | –0.2 ± 0.1* |
| P11 latency (ms) | 0.0 ± 0.2 | 0.00 | 0.0 ± 0.3 | 0.00 | 0.0 ± 0.1 | –0.2 ± 0.4 | 0.33 | –0.2 ± 0.2* |
| N13 latency (ms) | –0.1 ± 0.5 | 0.15 | 0.0 ± 0.7 | 0.00 | 0.1 ± 0.4 | –0.00 ± 0.5 | 0.00 | 0.1 ± 0.4 |
| P9 Amplitude (μV) | –0.2 ± 0.8 | 0.17 | 0.4 ± 0.9 | 0.30 | 0.6 ± 0.4 | –0.2 ± 1.2 | 0.16 | 0.0 ± 0.5 |
| N10 Amplitude (μV) | 0.1 ± 1.7 | 0.03 | 0.6 ± 1.8 | 0.22 | 0.5 ± 0.8 | –0.4 ± 2.4 | 0.14 | –0.5 ± 1.4 |
| P11 Amplitude (μV) | –0.3 ± 1.1 | 0.41 | 0.0 ± 0.7 | 0.00 | 0.3 ± 0.4 | 0.2 ± 0.6 | 0.33 | 0.5 ± 0.5 |
| N13 Amplitude (μV) | –0.2 ± 0.7 | 0.33 | –0.2 ± 0.7 | 0.30 | 0.0 ± 0.4 | 0.0 ± 0.9 | 0.00 | 0.2 ± 0.5 |
P < 0.05. CI, confidence interval; ES, effect size
Figure 2.
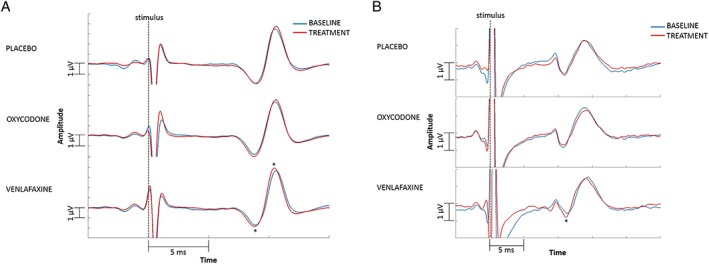
(A) Erb's point evoked potentials. The figure shows only the data up to 15 ms as this time interval includes the main peak, and cutting it down to this time interval (i.e. zooming in on the peak) visually enlarges the difference for the reader's benefit. A reduction in latency after venlafaxine administration can be seen. (B) Spinal evoked potentials. The figure shows only the data up to 25 ms as this time interval includes the main peak, and cutting it down to this time interval (i.e. zooming in on the peak) visually enlarges the difference for the reader's benefit. A reduction in latency after venlafaxine administration can be seen. Both figures show grand mean of the data, although the analyses were carried out on individuals. *P ≤ 0.05
Drug effects on cortical EPs
The cortical EP results are shown in Table 4 and Figure 3A,C. The raw values of the amplitudes and latencies of cortical EPs are presented in Table S2. The drug effects on the N60–80 latency were significant (P < 0.05; F 2,38 = 6.8). The post‐hoc tests showed that venlafaxine reduced the N60–80 latency (P < 0.01), whereas oxycodone prolonged it (P < 0.05). All other latencies remained stable with both treatments (all P > 0.05; all F 2,38 < 3.0). The drug effects on the P14 (P < 0.05; F 2,38 = 6.2), N30 (P < 0.05; F 2,38 = 3.4) and P25 (P < 0.05; F 2,38 = 5.0) amplitudes were significant. The post‐hoc tests showed that oxycodone increased the P14 (P < 0.05) and N30 (P < 0.05) amplitudes, whereas venlafaxine decreased the P25 amplitude (P < 0.05). The amplitudes of all other peaks remained stable with both treatments (all P > 0.05; all F 2,38 < 3.0).
Table 4.
Changes in subcortical and cortical evoked potential amplitudes and latencies due to the treatment
| Latencies (ms) | ||||||||
|---|---|---|---|---|---|---|---|---|
| PLACEBO | OXYCODONE* | VENLAFAXINE* | ||||||
| Change from baseline | ES | Change from baseline | ES | Comparison with placebo (95% CI) | Change from baseline | ES | Comparison with placebo (95% CI) | |
| P14 | 0.1 ± 0.4 | 0.16 | –0.2 ± 0.7 | 0.29 | –0.3 ± 0.4 | 0.3 ± 0.7 | 0.35 | 0.2 ± 0.4 |
| N18 | –0.1 ± 0.4 | 0.13 | 0.0 ± 0.5 | 0.00 | 0.1 ± 0.2 | 0.1 ± 0.4 | 0.14 | 0.2 ± 0.2 |
| N20 | 0.2 ± 0.3 | 0.27 | 0.0 ± 0.4 | 0.00 | –0.2 ± 0.2 | 0.1 ± 0.5 | 0.12 | –0.1 ± 0.3 |
| P25 | –0.1 ± 0.6 | 0.03 | 0.2 ± 0.7 | 0.07 | 0.3 ± 0.4 | –0.3 ± 1.1 | 0.10 | –0.2 ± 0.5 |
| N30 | –0.2 ± 2.0 | 0.08 | 0.4 ± 1.3 | 0.17 | 0.6 ± 1.3 | –0.4 ± 2.7 | 0.17 | –0.2 ± 1.6 |
| P45 | –0.8 ± 2.8 | 0.30 | 0.0 ± 2.5 | 0.00 | 0.8 ± 1.6 | 0.3 ± 2.8 | 0.10 | 1.1 ± 1.9 |
| N60–80 | –0.6 ± 4.1 | 0.06 | 2.0 ± 4.5 | 0.19 | 2.6 ± 2.7* | –3.9 ± 4.2 | 0.38 | –3.3 ± 2.6* |
| P100–120 | –1.1 ± 7.4 | 0.09 | 0.9 ± 7.2 | 0.07 | 2.0 ± 4.7 | –1.8 ± 7.7 | 0.15 | –0.7 ± 5.5 |
| Amplitudes (μV) | ||||||||
|---|---|---|---|---|---|---|---|---|
| PLACEBO | OXYCODONE* | VENLAFAXINE* | ||||||
| Change from baseline | ES | Change from baseline | ES | Comparison with placebo (95% CI) | Change from baseline | ES | Comparison with placebo (95% CI) | |
| P14 | 0.0 ± 0.3 | 0.00 | 0.2 ± 0.4 | 0.67 | 0.2 ± 0.2* | 0.0 ± 0.3 | 0.00 | 0.0 ± 0.2 |
| N18 | –0.1 ± 0.3 | 0.28 | 0.0 ± 0.4 | 0.00 | 0.1 ± 0.2 | 0.1 ± 0.3 | 0.33 | 0.2 ± 0.2 |
| N20 | 0.0 ± 0.5 | 0.00 | 0.1 ± 0.4 | 0.09 | 0.1 ± 0.3 | 0.0 ± 0.4 | 0.00 | 0.0 ± 0.3 |
| P25 | –0.3 ± 0.8 | 0.13 | 0.1 ± 0.8 | 0.04 | 0.4 ± 0.4 | –0.5 ± 0.7 | 0.18 | –0.2 ± 0.5* |
| N30 | –0.2 ± 1.0 | 0.12 | 0.4 ± 0.7 | 0.23 | 0.6 ± 0.6* | –0.3 ± 0.7 | 0.17 | –0.1 ± 0.5 |
| P45 | 0.2 ± 0.8 | 0.12 | 0.3 ± 1.2 | 0.19 | 0.1 ± 0.7 | –0.2 ± 1.2 | 0.10 | –0.4 ± 0.5 |
| N60–80 | –0.5 ± 1.7 | 0.24 | 0.5 ± 1.5 | 0.26 | 1.0 ± 1.1 | –0.3 ± 1.0 | 0.15 | 0.2 ± 0.7 |
| P100–120 | –0.2 ± 2.0 | 0.10 | –0.3 ± 1.6 | 0.13 | –0.1 ± 1.4 | –0.7 ± 1.6 | 0.32 | –0.5 ± 1.3 |
P < 0.05. CI, confidence interval; ES, effect size
Figure 3.
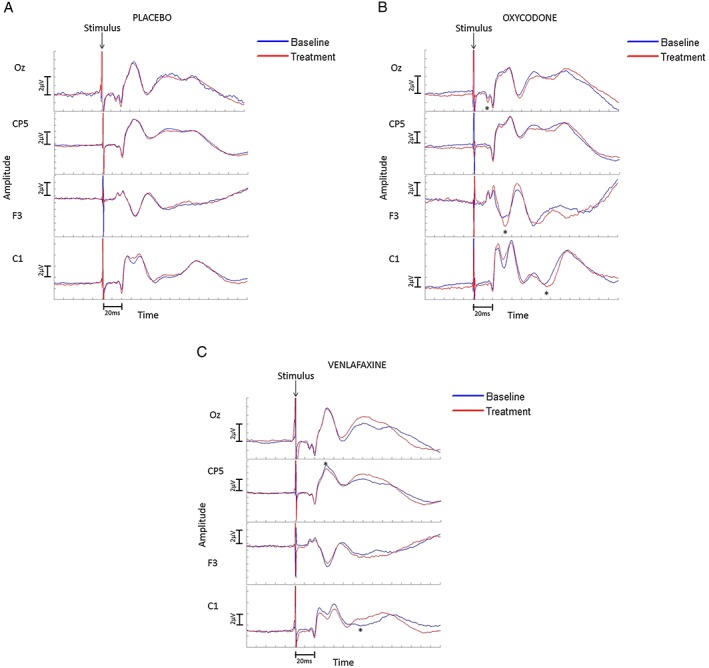
Cortical evoked potentials. The cortical electrodes Oz, CP5 and C1 are referred to a common reference between AFz and Fz, while the F3 electrode is referred to TP8. Negative peaks are down. (A) Placebo arm. No changes due to placebo are seen. (B) Oxycodone arm. An increase in the amplitude of P14 and N30, and in the latency of the N60–80 peak are seen. (C) Venlafaxine arm. A decrease in the amplitude of the P25 peak and in the latency of the N60–80 peak are seen. Both figures show grand means of the data, although the analyses were carried out on individuals. *P ≤ 0.05
Drug effects on brain source localization
Early brain sources
The brain source data are shown in Table 5A,B. The first peak, at 14–18 ms, could be described by one source in the brainstem; the peak at 20–25 ms could be described by one contralateral source, probably representing the SI area, and this source persisted throughout the analysis window (up to 45 ms). The peak at 30–45 ms had an additional contralateral source, anterior to the source describing the 20–25 ms peak (see Figure 4), probably representing the perirolandic cortex. All of the brain source locations remained stable in the three study arms (all P > 0.05; all F 2,38 < 1.2) but the drug effects on the strength of the brainstem (P < 0.05; F 2,38 = 4.0) and SI (P < 0.01; F 2,38 = 6.5) dipoles were significant. The post‐hoc tests showed that the strengths of the brainstem and SI sources were increased in the oxycodone arm (both P < 0.05), whereas the strength of the SI dipole was decreased in the venlafaxine arm (P < 0.05). There were no differences in the strength of the perirolandic source (P > 0.05; F 2,38 = 1.8).
Table 5A.
Brain source location according to Talairach coordinates
| EARLY POTENTIALS (14–45 ms) | |||||||||
|---|---|---|---|---|---|---|---|---|---|
| BRAINSTEM | SI | Perirolandic source | |||||||
| X | Y | Z | X | Y | Z | X | Y | Z | |
| BL 95% CI | –6 ± 1 (−7, –5) | –19 ± 4 (−21, –17) | –20 ± 7 (−23, –17) | –43 ± 7 (−46, –40) | –11 ± 9 (−15, –7) | 44 ± 9 (40, 48) | –37 ± 5 (−39, –35) | –4 ± 16 (−11, 3) | 37 ± 9 (33, 41) |
| PLA 95% CI | –6 ± 1 (−7, –5) | –19 ± 4 (−21, –17) | –20 ± 7 (−23, –17) | –42 ± 7 (−45, –39) | –10 ± 12 (−15, –5) | 44 ± 10 (40, 48) | –38 ± 7 (−41, –35) | −1 ± 12 (−6, 4) | 38 ± 10 (34, 42) |
| OXY 95% CI | –6 ± 1 (−7, –5) | –19 ± 4 (−21, –17) | –20 ± 7 (−23, –17) | –44 ± 11 (−49, –39) | –7 ± 13 (−13, –1) | 44 ± 12 (39, 49) | –38 ± 5 (−40, –36) | –4 ± 8 (−8, 0) | 37 ± 9 (33, 41) |
| VEN 95% CI | –6 ± 1 (−7, –5) | –19 ± 4 (−21, –17) | –20 ± 7 (−23, –17) | –43 ± 12 (−48, –38) | –10 ± 14 (−16, –4) | 47 ± 9 (43, 51) | –38 ± 6 (−41, –35) | –1 ± 12 (−6, 4) | 38 ± 11 (33, 43) |
| LATE POTENTIALS (50–150 ms) | |||||||||
|---|---|---|---|---|---|---|---|---|---|
| SI | Contralateral operculum | Ipsilateral operculum | |||||||
| X | Y | Z | X | Y | Z | X | Y | Z | |
| BL 95% CI | –31 ± 9 (−35, –27) | –15 ± 15 (−22, –8) | 37 ± 8 (33, 41) | –35 ± 7 (−38, –32) | –16 ± 16 (−23, –9) | 8 ± 15 (1, 15) | 35 ± 7 (32, 38) | –16 ± 16 (−23, –9) | 8 ± 15 (1, 15) |
| PLA 95% CI | –33 ± 10 (−37, –29) | –15 ± 13 (−21, –9) | 36 ± 13 (30, 42) | –35 ± 9 (−39, –31) | –15 ± 15 (−22, –8) | 9 ± 13 (3, 15) | 35 ± 9 (31, 39) | –15 ± 15 (−22, –8) | 9 ± 13 (3, 15) |
| OXY 95% CI | –28 ± 12 (−33, –23) | –9 ± 17 (−16, –2) | 38 ± 9 (34, 41) | –37 ± 8 (−41, –33) | –10 ± 18 (−18, –2) | –1 ± 11 (−6, 4) | 37 ± 8 (33, 41) | –10 ± 18 (−18, –2) | 6 ± 11 (1, 11) |
| VEN 95% CI | –28 ± 17 (−35, –21) | –16 ± 16 (−23, –9) | 38 ± 8 (34, 42) | –35 ± 8 (−39, –31) | –15 ± 27 (−27, –3) | 8 ± 9 (4, 12) | 35 ± 8 (31, 39) | –15 ± 27 (−27, –3) | 8 ± 9 (4, 12) |
P < 0.05. BL, baseline; CI, confidence interval; OXY, oxycodone; PLA, placebo; SI, primary somatosensory area VEN, venlafaxine. Dipole coordinates: X, lateral/medial; Y, anterior/posterior; Z, inferior/superior
Table 5B.
Brain source strengths
| EARLY POTENTIALS (14–45 ms) | |||||||||
|---|---|---|---|---|---|---|---|---|---|
| BRAINSTEM | SI | Perirolandic source | |||||||
| BASELINE | TREATMENT | ES | BASELINE | TREATMENT | ES | BASELINE | TREATMENT | ES | |
| PLA 95% CI | 0.8 ± 0.5 (0.6, 1.0) | 0.8 ± 0.7 (0.5, 1.1) | 0.00 | 7.5 ± 2.9 (6.2, 8.8) | 7.5 ± 3.1 (6.1, 8.9) | 0.00 | 36.6 ± 17.8 (28.7, 42.9) | 33.4 ± 16.5 (26.2, 40.6) | 0.19 |
| OXY 95% CI | 0.6 ± 0.4 (0.4, 0.8) | 1.0 ± 0.7 (0.7, 1.3)* | 0.70 | 6.6 ± 3.4 (5.1, 8.1) | 8.5 ± 4.5 (6.5, 10.5)* | 0.48 | 35.8 ± 16.2 (28.7, 42.9) | 39.3 ± 12.2 (34.0, 44.6) | 0.24 |
| VEN 95% CI | 0.7 ± 0.4 (0.5, 0.9) | 0.5 ± 0.4 (0.3, 0.7) | 0.50 | 8.2 ± 4.1 (6.4, 10.0) | 6.7 ± 4.9 (4.6, 8.8)* | 0.33 | 33.9 ± 17.0 (26.4, 41.4) | 35.4 ± 20.1 (26.6, 44.2) | 0.08 |
| LATE POTENTIALS (50–150 ms) | |||||||||
|---|---|---|---|---|---|---|---|---|---|
| SI | Contralateral operculum | Ipsilateral operculum | |||||||
| BASELINE | TREATMENT | ES | BASELINE | TREATMENT | ES | BASELINE | TREATMENT | ES | |
| PLA 95% CI | 127.2 ± 74.3 (94.6, 159.8) | 123.0 ± 56.0 (98.5, 147.5) | 0.06 | 71.4 ± 41.2 (53.3, 89.5) | 62.4 ± 28.4 (45.0, 74.8) | 0.25 | 41.7 ± 25.7 (30.4, 53.0) | 44.8 ± 37.5 (28.4, 61.2) | 0.10 |
| OXY 95% CI | 124.8 ± 76.2 (91.4, 158.2) | 136.7 ± 63.2 (109.0, 164.4) | 0.17 | 67.3 ± 43.1 (48.4, 86.2) | 81.9 ± 38.8 (64.9, 98.9) | 0.36 | 40.5 ± 21.5 (31.1, 49.9) | 39.8 ± 21.6 (30.4, 49.3) | 0.03 |
| VEN 95% CI | 126.6 ± 68.7 (96.5, 156.7) | 127.1 ± 53.0 (103.9, 150.3) | 0.01 | 78.1 ± 38.5 (61.2, 95.0) | 66.4 ± 33.0 (51.9, 80.9) | 0.33 | 33.4 ± 18.3 (25.4, 41.4) | 38.2 ± 17.1 (30.7, 45.7) | 0.27 |
P < 0.05. BL, baseline; CI, confidence interval; ES, effect size; OXY, oxycodone; PLA, placebo; SI, primary somatosensory area; VEN, venlafaxine
Figure 4.
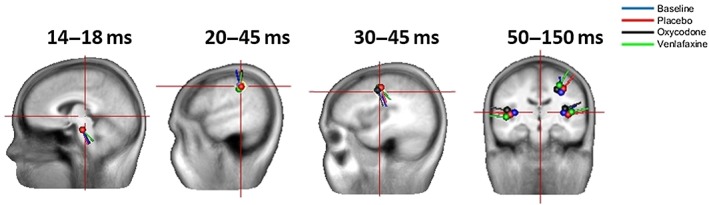
Brain sources of the cortical evoked potentials. At around 14–18 ms, the brainstem source is dominant. This is followed by a source in the primary somatosensory cortex at around 20–25 ms, and then a source in the perirolandic cortex at around 30–45 ms. Finally, the network between the primary somatosensory cortex and operculum is activated after 50 ms
Late brain sources/networks
There were two dominant brain sources communicating in a network describing the later potential, at around 50–150 ms. This included the contralateral source close to the SI area and the operculum source. Here, we use the term ‘operculum’ to represent the insula and secondary somatosensory cortex as they are anatomically very close. No changes were seen in this brain network (all P > 0.05; all F 2,38 < 2.5).
Side effects
The volunteers experienced the following side effects:
- Nausea
three volunteers in the oxycodone arm and 10 in the venlafaxine arm
- Headache
two volunteers in placebo arm, two in the oxycodone arm and four in the venlafaxine arm
- Dizziness
four volunteers in the oxycodone arm and six in the venlafaxine arm
- Sedation
two volunteers in the placebo arm, eight in the oxycodone arm and five in the venlafaxine arm
- Dryness of the mouth
eight volunteers in the venlafaxine arm
- Rapid heart rate
one volunteer in the oxycodone arm and one in the venlafaxine arm
- Constipation
one volunteer in the oxycodone arm
- Itching
six volunteers in the oxycodone arm
- Low appetite
one volunteer in the placebo arm
- Increased sweating
one volunteer in the placebo arm and two in the oxycodone arm
- General discomfort
five volunteers in the oxycodone arm and eight in the venlafaxine arm.
The volunteers rated the side effects on a five‐point Likert scale (0 = no side effects, 1 = minimal side effects, 2 = moderate side effects, 3 = severe side effects and 4 = very severe side effects). All volunteers rated the side effects as ≤3. None of the side effects were sufficiently serious to result in an interruption to the experiment.
Discussion
This study investigated how oxycodone and venlafaxine, compared with placebo, modified SEPs at the spinal and supraspinal levels. We investigated the between‐day reliability of the baseline SEP data and found that both spinal and cortical data were reliable. Thereafter, we found that venlafaxine reduced the latencies of the spinal EPs, suggesting increased neuronal excitability at this level. The corresponding decrease in the strength of the SI source may reflect an inhibitory tone in the cortico‐spinal networks. By contrast, oxycodone increased the strength of neuronal activity at the brainstem level and at SI, which mirrored the predominantly supraspinal effects of opioids. The data support the existence of different mechanisms behind the two classes of analgesics, and how they can be used in synergy in patients with complicated pain.
Reliability
The results showed Erb's point, and spinal and cortical EP data to have high reliability, although the latencies had better reliability than the amplitudes. This is understandable as amplitudes are influenced by factors such as the level of noise (both electrical and biological) to a larger extent than the latencies. Nonetheless, the reliability of amplitudes was acceptable, with ICCs generally above 0.7 and the bias negligible. In addition to this, earlier latencies tended to have better reliability than later ones. This is most likely because the later EPs are more complex and include more jitter between epochs, inducing a slight variation between the latencies of averaged EPs. Nevertheless, both early and late EPs had acceptable reliability, according to both measures of reliability used in the present study.
EPs
The Erb's point potential was analysed purely to discard any peripheral neuropathy. Although venlafaxine decreased the Erb's potential activity, this was a peripheral and presynaptic response (i.e. the CNS was not involved in the response), resilient to any experimental perturbation, but sensitive to even minimal movement in the stimulating electrode. Hence, we do not consider the small changes in Erb's point latencies to be meaningful. Venlafaxine also decreased the spinal Cv7 latency, which could imply an increased neuronal excitability and improved motor response, as has been shown previously in a functional magnetic resonance imaging study 19. Oxycodone, on the other hand, did not change any of the parameters of spinal EPs. This is in line with previous studies that looked at the effects of opioids on spinal EPs and found no differences in these parameters 20, 21. Spinal EPs are probably not sensitive enough for investigating the effect of opioids on the CNS at the dosage given in the present study. The differences due to venlafaxine, although small, were significant, so we believe that these findings reflect venlafaxine's effect at the spinal level. It can also be argued that the decrease in spinal latency could have been due to the decrease in the latency of the Erb's potential. However, the spinal P11 potential is the onset of the spinal N13 potential, and the N13 onset is a more sensitive measure of the beginning of spinal neuronal activity than the wave peak. Thus, the difference seen at P11 cannot be merely attributed to the small difference in the peripheral Erb's point potential, which would affect the presynaptic N9 latency (recorded at Cv7) before the postsynaptic N13 onset latency.
Oxycodone increased the P14 and N30 amplitudes of the cortical EPs, whereas venlafaxine decreased the P25 amplitude. As only the early EP amplitudes were affected by the two treatments, it would appear that the early SEPs are the most sensitive measures of the opioid effect on SEP amplitudes. This increase in amplitudes in the oxycodone arm is likely to be due to increased synchronization of the firing neurones 22, 23, 24. In contrast to our study, previous early somatosensory EP studies have typically shown decreases in amplitudes. 20, 21, 23, 24, 25, 26, 27, 28, 29. However, these studies generally investigated high dosage of anaesthetic opioids, and oxycodone is an analgesic opioid. The central effect of opioids is likely to vary depending on the type of opioid used (i.e. whether it is an analgesic or anaesthetic), but also on the dosage. A study investigating the dose‐dependent effect of remifentanil on somatosensory EPs showed that, at low doses, remifentanil increases the early SEP amplitudes, whereas high doses decrease them 30; therefore, our findings with oxycodone were comparable to those with low‐dose remifentanil. Interestingly, P14 and N30 amplitudes increased as a result of oxycodone but the P25 amplitude was unaltered. The P25 amplitude was analysed as part of the N20–P25 potential at CP5, whereas the P14 and N30 amplitudes, where we saw the increases, were analysed as part of the P14–N18 potential at Oz and N30–P45 potential at F3. These potentials have different brain generators than the N20–P25 peak and this is likely to explain why we saw an increase in those two potentials but not at P25.
The P25 response was previously demonstrated to represent the inhibitory tone of the SI cortex 31, 32. Therefore, the P25 amplitude reduction due to venlafaxine could suggest a reduction in the inhibitory mechanisms within the SI area, paralleling the hyperexcitability at the spinal level.
In addition to changes in amplitudes, both drugs changed the latencies of the N60–80 potential. Venlafaxine decreased the latency, whereas oxycodone increased it. The decreased latency in response to venlafaxine is presumably due to an increase in the cortico‐cortical conduction velocity/neuronal excitability between the underlying brain centres. The increase in latency in response to oxycodone implies a delayed activation of the brain activity underlying the N60–80 potential, so this latency increase is likely to be due to a decrease in the cortico‐cortical conduction velocity. These findings make it apparent that N60–80 is an important potential in brain processing following analgesic drug administration.
Brain source localization
The brain network analysis methods used in the present study had been validated previously and been shown to be sensitive for detecting changes due to analgesics 13, 23, 24. For the early SEPs, sequential peak‐by‐peak analysis was performed as the early potentials are expected to have only one (or at most two) dominant source. On the other hand, after 50 ms, the underlying brain networks become more complex 30, and consequently brain network analyses were carried out for the later peaks 33. The activated brain sources in the present study have been repeatedly reported in previous SEP studies, which showed that a brainstem/thalamus source explains the P14 potential, and that an SI source active from 20 ms onwards and a perirolandic source explains the N30 potential 33, 34. The network analysis of the later potentials added a new aspect to this type of data, although the brain sources involved in the network (SI and operculum) have also been reported previously in SEP studies 33, 34. Neither of the treatments caused changes in brain source locations but oxycodone increased the strength of brainstem and SI activity, whereas venlafaxine decreased the strength of SI activity. These findings are in line with changes to the surface EPs (i.e. an increase in the P14 and N30 amplitudes due to oxycodone, and a decrease in the P25 amplitude due to venlafaxine), so the changes in the strength of these sources are likely to be responsible for the changes in the amplitude of EPs.
Methodological considerations
In the present study, venlafaxine treatment was given over a 5‐day period, and treatment with SNRIs should typically be given for at least 2 weeks, in order to observe the maximal effect 35. However, 5‐day treatment was ethically and, in practice, the longest feasible treatment in healthy volunteers. Moreover, the effects of venlafaxine on pain mechanisms have been observed after only a few days of treatment 36, and although a longer treatment is desired for the maximal clinical effect, the 5‐day treatment in the present study was long enough to observe changes in the CNS. Furthermore, as we wanted to have a direct comparison with oxycodone, 5‐day treatment seemed the most feasible option as we could not treat healthy volunteers for 2 weeks with opioids.
We used a nonpainful stimulus in the present study, so it was not possible to assess the extent of analgesic effect of the drugs, but merely their action on the CNS. In order to record reliable spinal EPs, up to 1000 to 2000 stimulations are necessary 37. It was not feasible to perform such an experimental paradigm, with so many painful stimulations, at the required high frequency, in volunteers. Moreover, the analgesic effects of these drugs are well documented, although documentation of their action at different levels of the CNS is lacking.
Some of the subjects experienced side effects due to medication, and it could be argued that these side effects influenced the neurophysiological results seen in the study. However, as a minority of the volunteers experienced any particular side effect, and differences in spinal and cortical EPs were seen between oxycodone and venlafaxine, we believe that the changes in the CNS due to the actions of each of the drugs were due to the overall effect of each drug, and not to the side effects alone.
Conclusions
The present study showed differences in spinal and cortical processing between venlafaxine and oxycodone as compared with placebo. Venlafaxine induced changes at the spinal and cortical levels, whereas oxycodone induced changes at the brainstem and cortical levels. The cortical modifications were different between venlafaxine and oxycodone. The study sheds light on how opioids and SNRIs modify the human CNS, and the levels of the CNS at which their effects are exerted. As human models of the mechanisms of drugs with effects on the CNS are lacking, these results add a piece to the puzzle, and the approach used here should be used in future studies to explore the effects of treatment with different drugs on the CNS.
Competing Interests
There are no competing interests to declare.
The study was supported by Innovation Fund Denmark – Individuals, Disease and Society (#10–092 786/DSF), Karen Elise Jensens Foundation, The Obel Family Foundation and a free grant from Grünenthal.
Contributors
D.L. contributed to the study design, analysis, interpretation of results and drafting of the manuscript. M.V. contributed to the interpretation of the results and manuscript revision for important intellectual content. I.W.D.F. contributed to data acquisition and manuscript revision for important intellectual content. A.D. contributed to study design and manuscript revision for important intellectual content. A.M.D, was the principal investigator, and contributed to study design and manuscript revision for important intellectual content. All authors gave final approval of the manuscript and agreed to be accountable for all aspects of the work, in ensuring that questions related to the accuracy or integrity of any part of the work are appropriately investigated and resolved.
Supporting information
Table S1 Latencies and amplitudes for Erbs point and spinal evoked potentials
Table S2 Subcortical and cortical evoked potential amplitudes and latencies of different peaks
Supporting info item
Lelic, D. , Valeriani, M. , Fischer, I. W. D. , Dahan, A. , and Drewes, A. M. (2017) Venlafaxine and oxycodone have different effects on spinal and supraspinal activity in man: a somatosensory evoked potential study. Br J Clin Pharmacol, 83: 764–776. doi: 10.1111/bcp.13177.
References
- 1. Southan C, Sharman JL, Benson HE, Faccenda E, Pawson AJ, Alexander SP, et al. The IUPHAR/BPS Guide to PHARMACOLOGY in 2016: towards curated quantitative interactions between 1300 protein targets and 6000 ligands. Nucl Acids Res 2016; 44 (Database Issue): D1054–D1068. [DOI] [PMC free article] [PubMed] [Google Scholar]
- 2. Alexander SPH, Davenport AP, Kelly E, Marrion N, Peters JA, Benson HE, et al. The Concise Guide to PHARMACOLOGY 2015/16: G protein‐coupled receptors. Br J Pharmacol 2015; 172: 5744–5869. [DOI] [PMC free article] [PubMed] [Google Scholar]
- 3. Alexander SPH, Kelly E, Marrion N, Peters JA, Benson HE, Faccenda E, et al. The Concise Guide to PHARMACOLOGY 2015/16: Transporters. Br J Pharmacol 2015; 172: 6110–6202. [DOI] [PMC free article] [PubMed] [Google Scholar]
- 4. Brooks J, Tracey I. From nociception to pain perception: imaging the spinal and supraspinal pathways. J Anat 2005; 207: 19–33. [DOI] [PMC free article] [PubMed] [Google Scholar]
- 5. Leppa M, Korvenoja A, Carlson S, Timonen P, Martinkauppi S, Ahonen J, et al. Acute opioid effects on human brain as revealed by functional magnetic resonance imaging. Neuroimage 2006; 31: 661–669. [DOI] [PubMed] [Google Scholar]
- 6. Petrovic P. Opioid and placebo analgesia share the same network. Semin Pain Med 2005; 3: 31–36. [Google Scholar]
- 7. Wise R, Rogers R, Painter D, Bantick S, Ploghaus A, Williams P, et al. Combining fMRI with a pharmacokinetic model to determine which brain areas activated by painful stimulation are specifically modulated by remifentanil. Neuroimage 2002; 16: 999–1014. [DOI] [PubMed] [Google Scholar]
- 8. Lang E, Hord AH, Denson D. Venlafaxine hydrochloride (Effexor) relieves thermal hyperalgesia in rats with an experimental mononeuropathy. Pain 1996; 68: 151–155. [DOI] [PubMed] [Google Scholar]
- 9. Marchand F, Alloui A, Chapuy E, Hernandez A, Pelissier T, Ardid D, et al. The antihyperalgesic effect of venlafaxine in diabetic rats does not involve the opioid system. Neurosci Lett 2003; 342: 105–108. [DOI] [PubMed] [Google Scholar]
- 10. Gallagher HC, Gallagher RM, Butler M, Buggy DJ, Henman MC. Venlafaxine for neuropathic pain in adults. Cochrane Database Syst Rev 2015; (8): CD011091. [DOI] [PMC free article] [PubMed] [Google Scholar]
- 11. Pertovaara A. Noradrenergic pain modulation. Prog Neurobiol 2006; 80: 53–83. [DOI] [PubMed] [Google Scholar]
- 12. Malver LP, Brokjaer A, Staahl C, Graversen C, Andresen T, Drewes AM. Electroencephalography and analgesics. Br J Clin Pharmacol 2014; 77: 72–95. [DOI] [PMC free article] [PubMed] [Google Scholar]
- 13. Lelic D, Olesen S, Valeriani M, Drewes A. Brain source connectivity reveals the visceral pain network. Neuroimage 2012; 60: 37–46. [DOI] [PubMed] [Google Scholar]
- 14. Durka PJ, Matysiak A, Montes EM, Sosa PV, Blinowska KJ. Multichannel matching pursuit and EEG inverse solutions. J Neurosci Methods 2005; 148: 49–59. [DOI] [PubMed] [Google Scholar]
- 15. Lelic D, Gratkowski M, Hennings K, Drewes A. Multichannel matching pursuit validation and clustering‐A simulation and empirical study. J Neurosci Meth 2011; 196: 190–200. [DOI] [PubMed] [Google Scholar]
- 16. Pascual‐Marqui R, Esslen M, Kochi K, Lehmann D. Functional imaging with low‐resolution brain electromagnetic tomography (LORETA): A review. Meth Find Exp Clin Pharmacol 2002; 24: 91–95. [PubMed] [Google Scholar]
- 17. Weir JP. Quantifying test–retest reliability using the intraclass correlation coefficient and the SEM. J Strength Cond Res 2005; 19: 231–240. [DOI] [PubMed] [Google Scholar]
- 18. Atkinson G, Nevill AM. Statistical methods for assessing measurement error (reliability) in variables relevant to sports medicine. Sports Med 1998; 26: 217–238. [DOI] [PubMed] [Google Scholar]
- 19. Li CY, Song XZ, Han LX, Xie Q, Wang J, Li YK, et al. The effects of venlafaxine on cortical motor area activity in healthy subjects: a pilot study. J Clin Psychopharmacol 2014; 34: 93–98. [DOI] [PubMed] [Google Scholar]
- 20. Hume AL, Durkin MA. Central and spinal somatosensory conduction times during hypothermic cardiopulmonary bypass and some observations on the effects of fentanyl and isoflurane anesthesia. Electroencephalogr Clin Neurophysiol 1986; 65: 46–58. [DOI] [PubMed] [Google Scholar]
- 21. McPherson RW, Sell B, Traystman RJ. Effects of thiopental, fentanyl, and etomidate on upper extremity somatosensory evoked potentials in humans. Anesthesiology 1986; 65: 584–589. [DOI] [PubMed] [Google Scholar]
- 22. Banoub M, Tetzlaff J, Schubert A. Pharmacologic and physiologic influences affecting sensory evoked potentials: implications for perioperative monitoring. Anesthesiology 2003; 99: 716–737. [DOI] [PubMed] [Google Scholar]
- 23. Lelic D, Olesen A, Brock C, Staahl C, Drewes A. Advanced Pharmaco‐EEG reveals morphine induced changes in the brain's pain network. J Clin Neurophysiol 2012; 29: 219–225. [DOI] [PubMed] [Google Scholar]
- 24. Lelic D, Olesen AE, Gregersen H, Dahan A, Kolesnikov Y, Drewes AM. Morphine modifies the cingulate‐operculum network underlying painful rectal evoked potentials. Neuropharmacology 2014; 77: 422–427. [DOI] [PubMed] [Google Scholar]
- 25. Asouhidou I, Katsaridis V, Vaidis G, Ioannou P, Givissis P, Christodoulou A, et al. Somatosensory evoked potentials suppression due to remifentanil during spinal operations; a prospective clinical study. Scoliosis 2010; 5: 8. [DOI] [PMC free article] [PubMed] [Google Scholar]
- 26. Freye E, Buhl R, Ciaramelli F. Opioids with different affinity for subreceptors induce different effects on early and late sensory evoked potentials (SEP) in man. NIDA Res Monogr 1986; 75: 551–554. [PubMed] [Google Scholar]
- 27. Kalkman CJ, Leyssius AT, Bovill JG. Influence of high‐dose opioid anesthesia on posterior tibial nerve somatosensory cortical evoked potentials: effects of fentanyl, sufentanil, and alfentanil. J Cardiothorac Anesth 1988; 2: 758–764. [DOI] [PubMed] [Google Scholar]
- 28. Kimovec MA, Koht A, Sloan TB. Effects of sufentanil on median nerve somatosensory evoked potentials. Br J Anaesth 1990; 65: 169–172. [DOI] [PubMed] [Google Scholar]
- 29. Schubert A, Drummond JC, Peterson DO, Saidman LJ. The effect of high‐dose fentanyl on human median nerve somatosensory‐evoked responses. Can J Anaesth 1987; 34: 35–40. [DOI] [PubMed] [Google Scholar]
- 30. Crabb I, Thornton C, Konieczko KM, Chan A, Aquilina R, Frazer N, et al. Remifentanil reduces auditory and somatosensory evoked responses during isoflurane anaesthesia in a dose‐dependent manner. Br J Anaesth 1996; 76: 795–801. [DOI] [PubMed] [Google Scholar]
- 31. Restuccia D, Valeriani M, Grassi E, Gentili G, Mazza S, Tonali P, et al. Contribution of GABAergic cortical circuitry in shaping somatosensory evoked scalp responses: specific changes after single‐dose administration of tiagabine. Clin Neurophysiol 2002; 113: 656–671. [DOI] [PubMed] [Google Scholar]
- 32. Valeriani M, Restuccia D, Di Lazzaro V, Le Pera D, Barba C, Tonali P, et al. Dipolar sources of the early scalp somatosensory evoked potentials to upper limb stimulation. Effect of increasing stimulus rates. Exp Brain Res 1998; 120: 306–315. [DOI] [PubMed] [Google Scholar]
- 33. Valeriani M, Le Pera D, Tonali P. Characterizing somatosensory evoked potential sources with dipole models: advantages and limitations. Muscle Nerve 2001; 24: 325–339. [DOI] [PubMed] [Google Scholar]
- 34. Valeriani M, Le Pera D, Niddam D, Arendt‐Nielsen L, Chen AC. Dipolar source modeling of somatosensory evoked potentials to painful and nonpainful median nerve stimulation. Muscle Nerve 2000; 23: 1194–1203. [DOI] [PubMed] [Google Scholar]
- 35. SNRI . [online] Available at http://pro.medicin.dk/Laegemiddelgrupper/Grupper/315580 (last accessed 17 December 2015).
- 36. Enggaard TP, Klitgaard NA, Gram LF, Arendt‐Nielsen L, Sindrup SH. Specific effect of venlafaxine on single and repetitive experimental painful stimuli in humans. Clin Pharmacol Ther 2001; 69: 245–251. [DOI] [PubMed] [Google Scholar]
- 37. Schomer DL, da Silva FL. Somatosensory evoked potentials In: Niedermeyer's Electroencephalography: Basic Principles, Clinical Applications, and Related Fields. Philadelphia: Lippincott Williams & Wilkins, 2011. [Google Scholar]
- 38. Restuccia D, Di Lazzaro V, Valeriani M, Aulisa L, Galli M, Tonali P, et al. The role of upper limb somatosensory evoked potentials in the management of cervical spondylotic myelopathy: preliminary data. Electroencephalogr Clin Neurophysiol 1994; 92: 502–509. [DOI] [PubMed] [Google Scholar]
Associated Data
This section collects any data citations, data availability statements, or supplementary materials included in this article.
Supplementary Materials
Table S1 Latencies and amplitudes for Erbs point and spinal evoked potentials
Table S2 Subcortical and cortical evoked potential amplitudes and latencies of different peaks
Supporting info item